Q1 2024
Non-Profit Plans & Active U.S. Value Equity Analysis
Executive Summary
In June, we released a report on a recent webinar highlighting key trends driving institutional hiring activity incorporating analysis from our Prism and Style Analytics platforms. We focused the analysis within the U.S. region and concentrated on the managers winning new mandates within Large & Small-Cap growth from Non-Profit clients. In this analysis, we focus on the managers winning new mandates within Large & Small-Cap value from the same Non-Profit clients and the factors that differentiated their products.
Highlights
- Non-Profit’s lead all other plan types funding new mandates for both active Large and Small-Cap Value U.S equity (33% and 35% respectively).
- Reviewing post-negotiated fees, active U.S. Large-Cap Value mandates are paid at a slight discount compared to Growth, while there is a premium paid for Value in Larger active U.S. Small-Cap mandates.
- The most consistent winners of new mandates from Non-Profits in both Large and Small-Cap value were fundamental managers with high active shares.
U.S. Large-Cap Value
Using Prism Analytics, we examined the number of equity mandates awarded for U.S. Large-Cap Value by client type. Prism gives asset managers access to a range of previously unavailable market information: channel-level flows of assets and allocations; actual post negotiated fees by channel, investment type, and vehicle; and public and private (e.g., Corporate DB and Foundations & Endowments) mandates won/lost by manager. Over the last three years, active managers won over 1,300 mandates in this space, with Non-Profit clients accounting for 33%.
Chart 1: Active U.S. Large-Cap Value Equity Mandates Won by Client Type
Source: PRISM Analytics
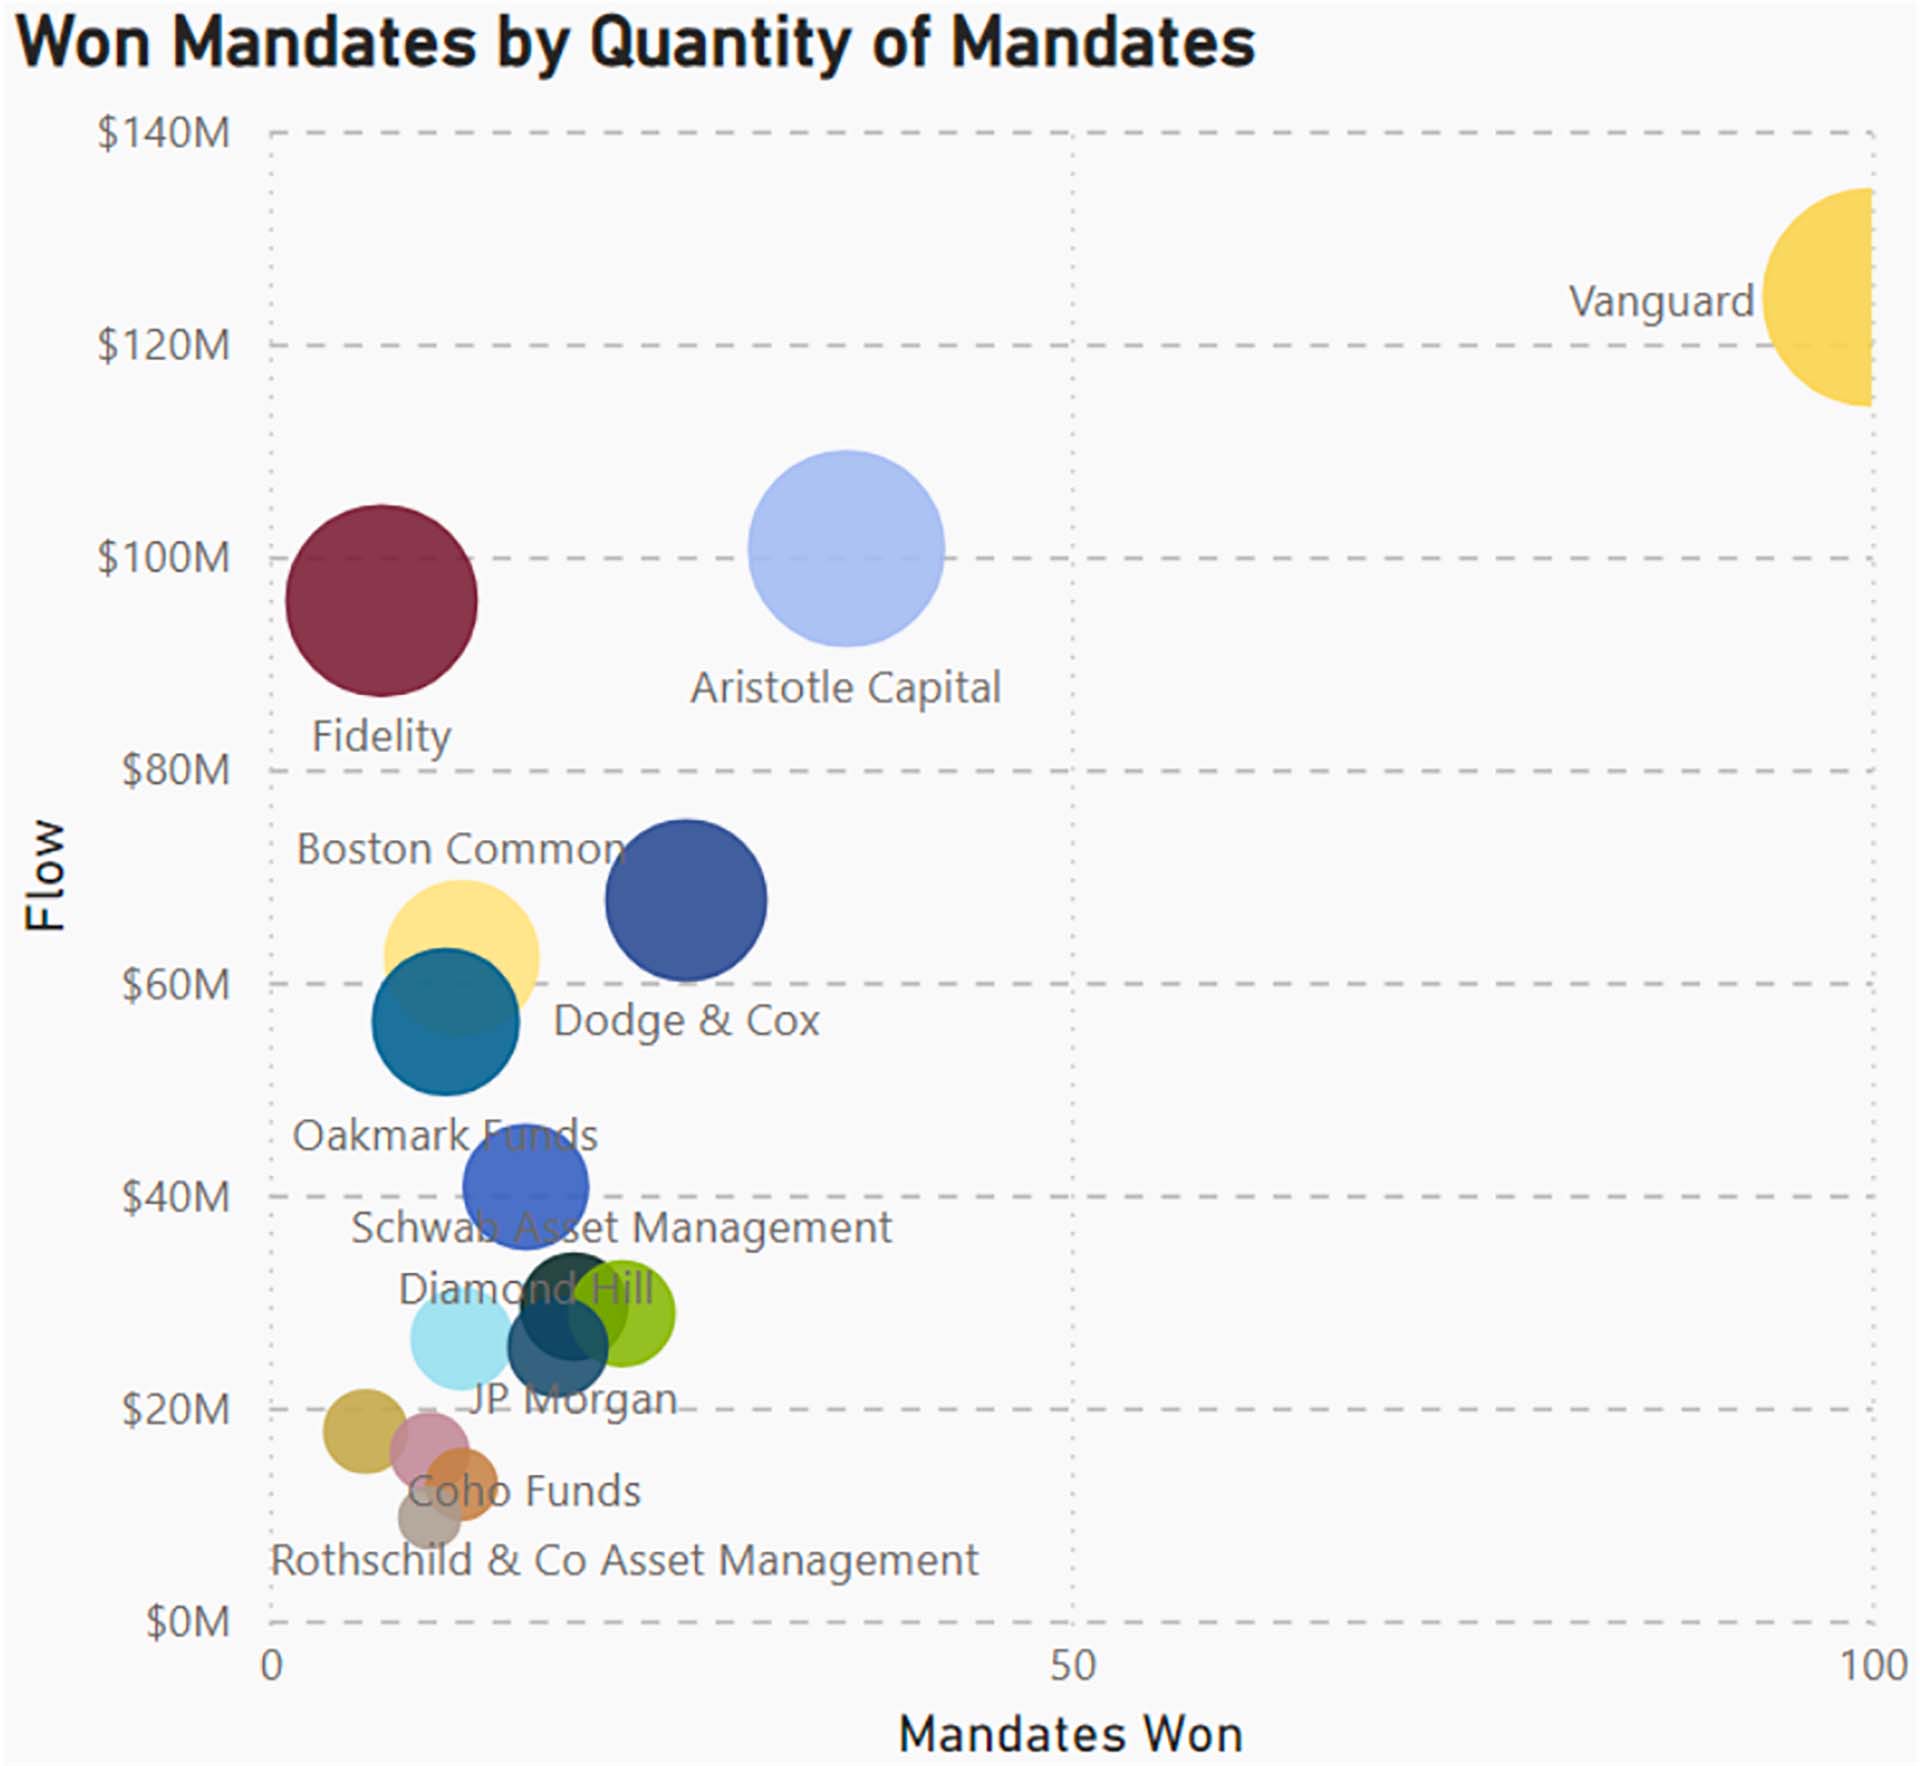
The top three winning managers of active U.S. Large-Cap value mandates within the Non Profit channel the last three years were Vanguard, Aristotle & Fidelity. While Vanguard had net cash flows of $124m, Aristotle won more consistently (76% of the quarters).
Chart 2: Active U.S. Large-Cap Value Equity Winner Non-Profit
Source: PRISM Analytics
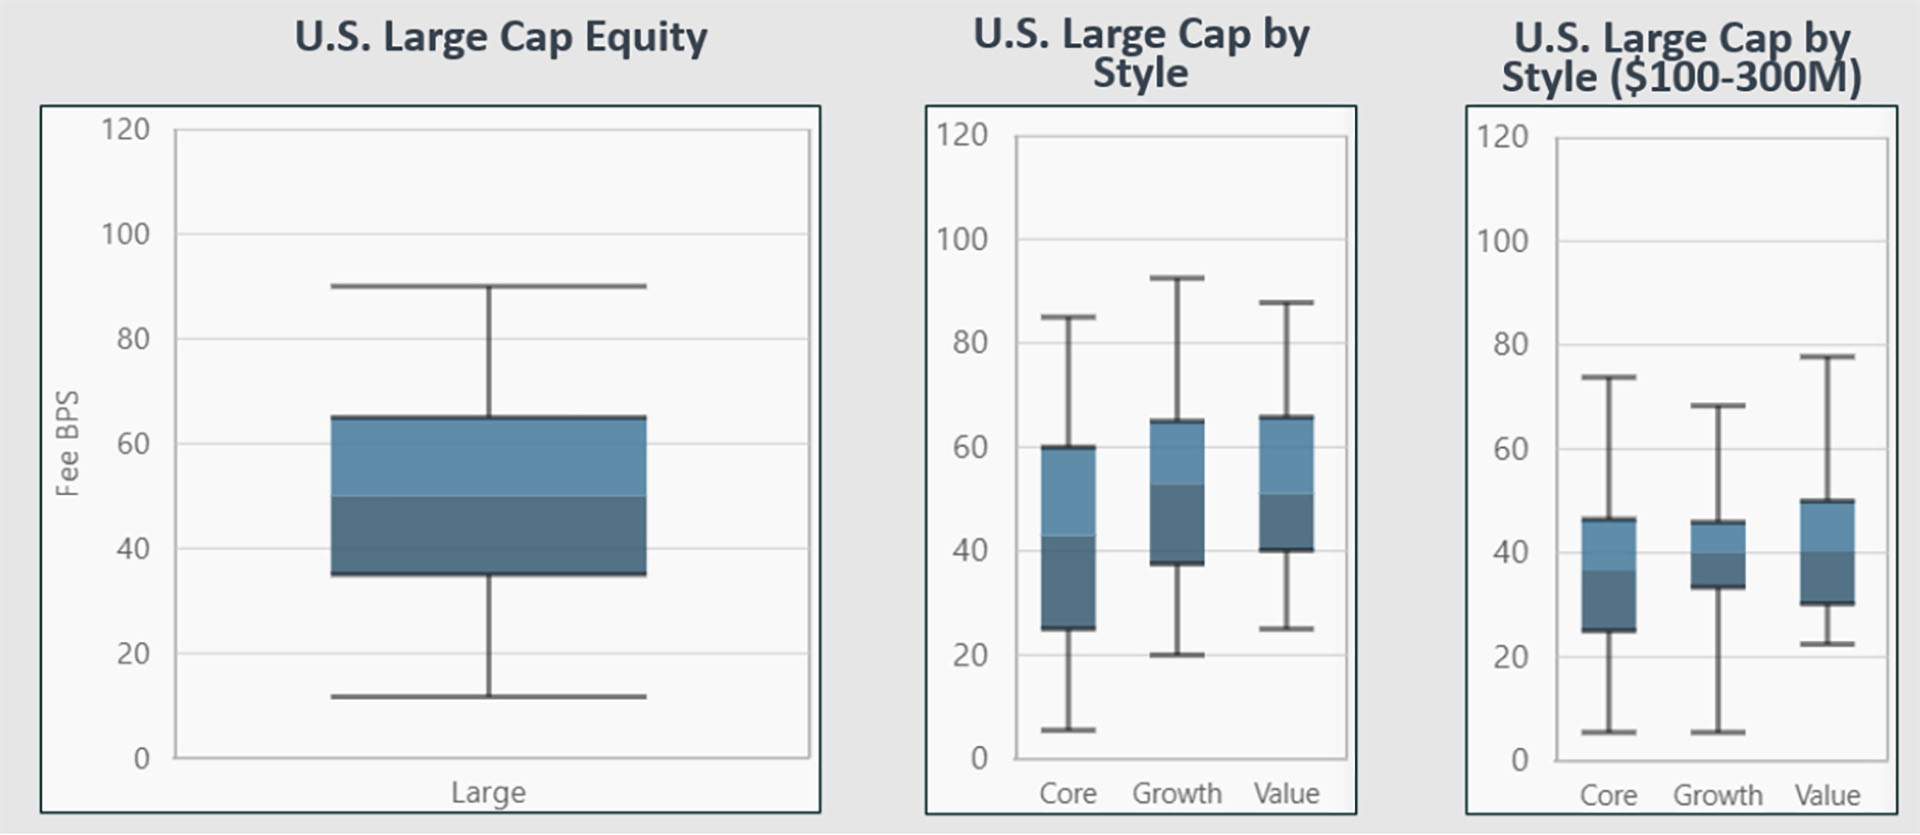
The median fee paid to active U.S. Large-Cap equity managers (all plan types and mandate sizes) is 50 basis points (bps), with a range from 12-90. The median within the Non-Profit space is slightly higher as 52.3 bps. Along style lines, there is a slight premium paid to growth (median 53 bps) compared to value (median 51 bps), though once we get to Large mandates above $100m there is parity by style (median’s 40bps).
Chart 3: Active U.S. Large-Cap Post-Negotiated Fee
Source: PRISM Analytics
Style Analytics Factor Analysis
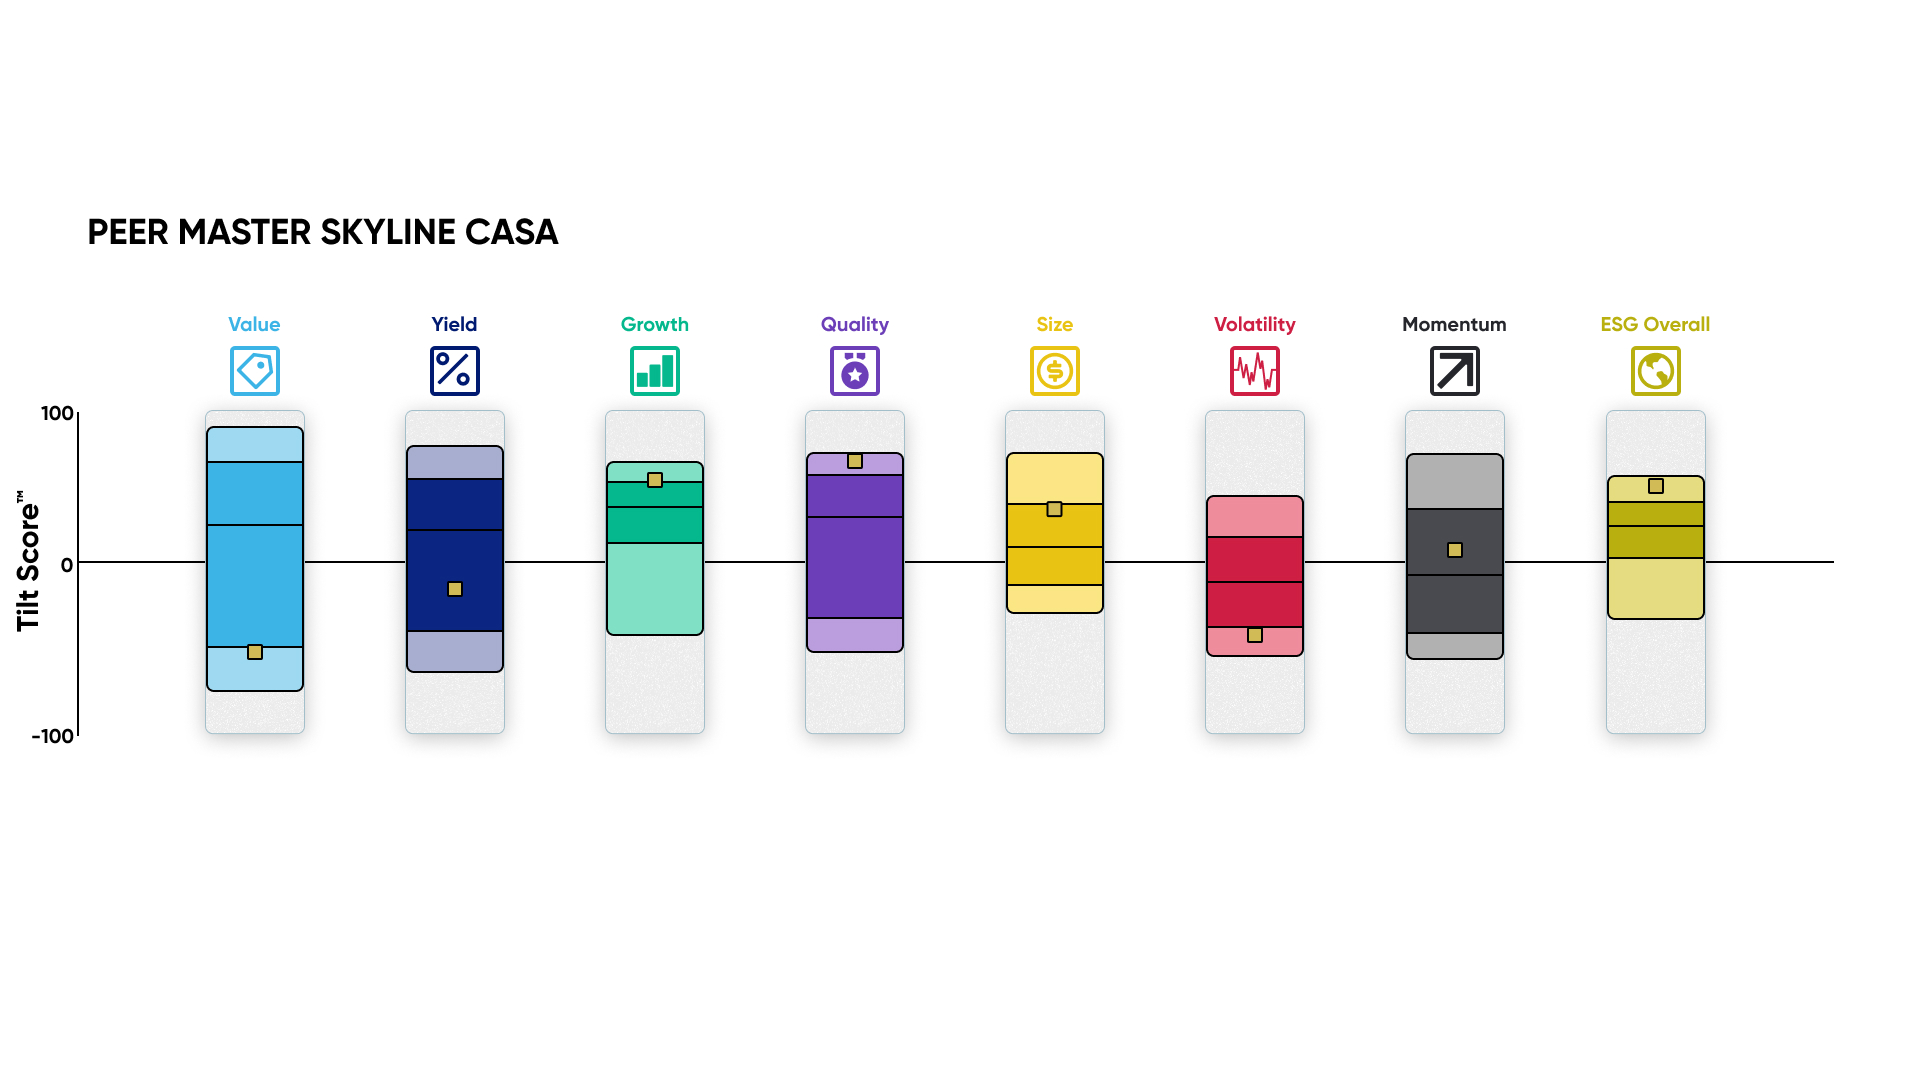
Using Style Analytics Master Skyline, we evaluated how Aristotle distinguishes itself from other Value managers compared to the Russell 1000 Value Index. Aristotle focuses on high-quality equities with a stable earnings and sales growth over five years, low debt/equity ratios, and a high net profit margin, consistently ranking in the top quartile among other Large-Cap Value managers.
Aristotle’s strategy emphasizes growth through strong earnings and dividend growth track records, outranking both the benchmark and other Value managers. While slightly more expensive based on sales-to-price and cash flow yield, Aristotle benefits from significant momentum exposure, delivering favorable annual returns compared to its peers. Aristotle also stands out by identifying companies that also have strong ESG exposure, as defined by MSCI, ranking in the top quartile amongst Value managers.
Chart 4: Active U.S. Large-Cap Value Equity Winner – Master Skyline (Country and Sector Adjusted).
Source: Style Analytics, a Confluence company
U.S. Small-Cap Value
The chart below examines the number of equity mandates awarded for active U.S. Small Cap Value by client type. Active managers won close to 900 mandates in this space the last three years, with Non-Profit clients accounting for 35%.
Chart 5: Active U.S. Small-Cap Value Equity Mandates by Client Type
Source: PRISM Analytics
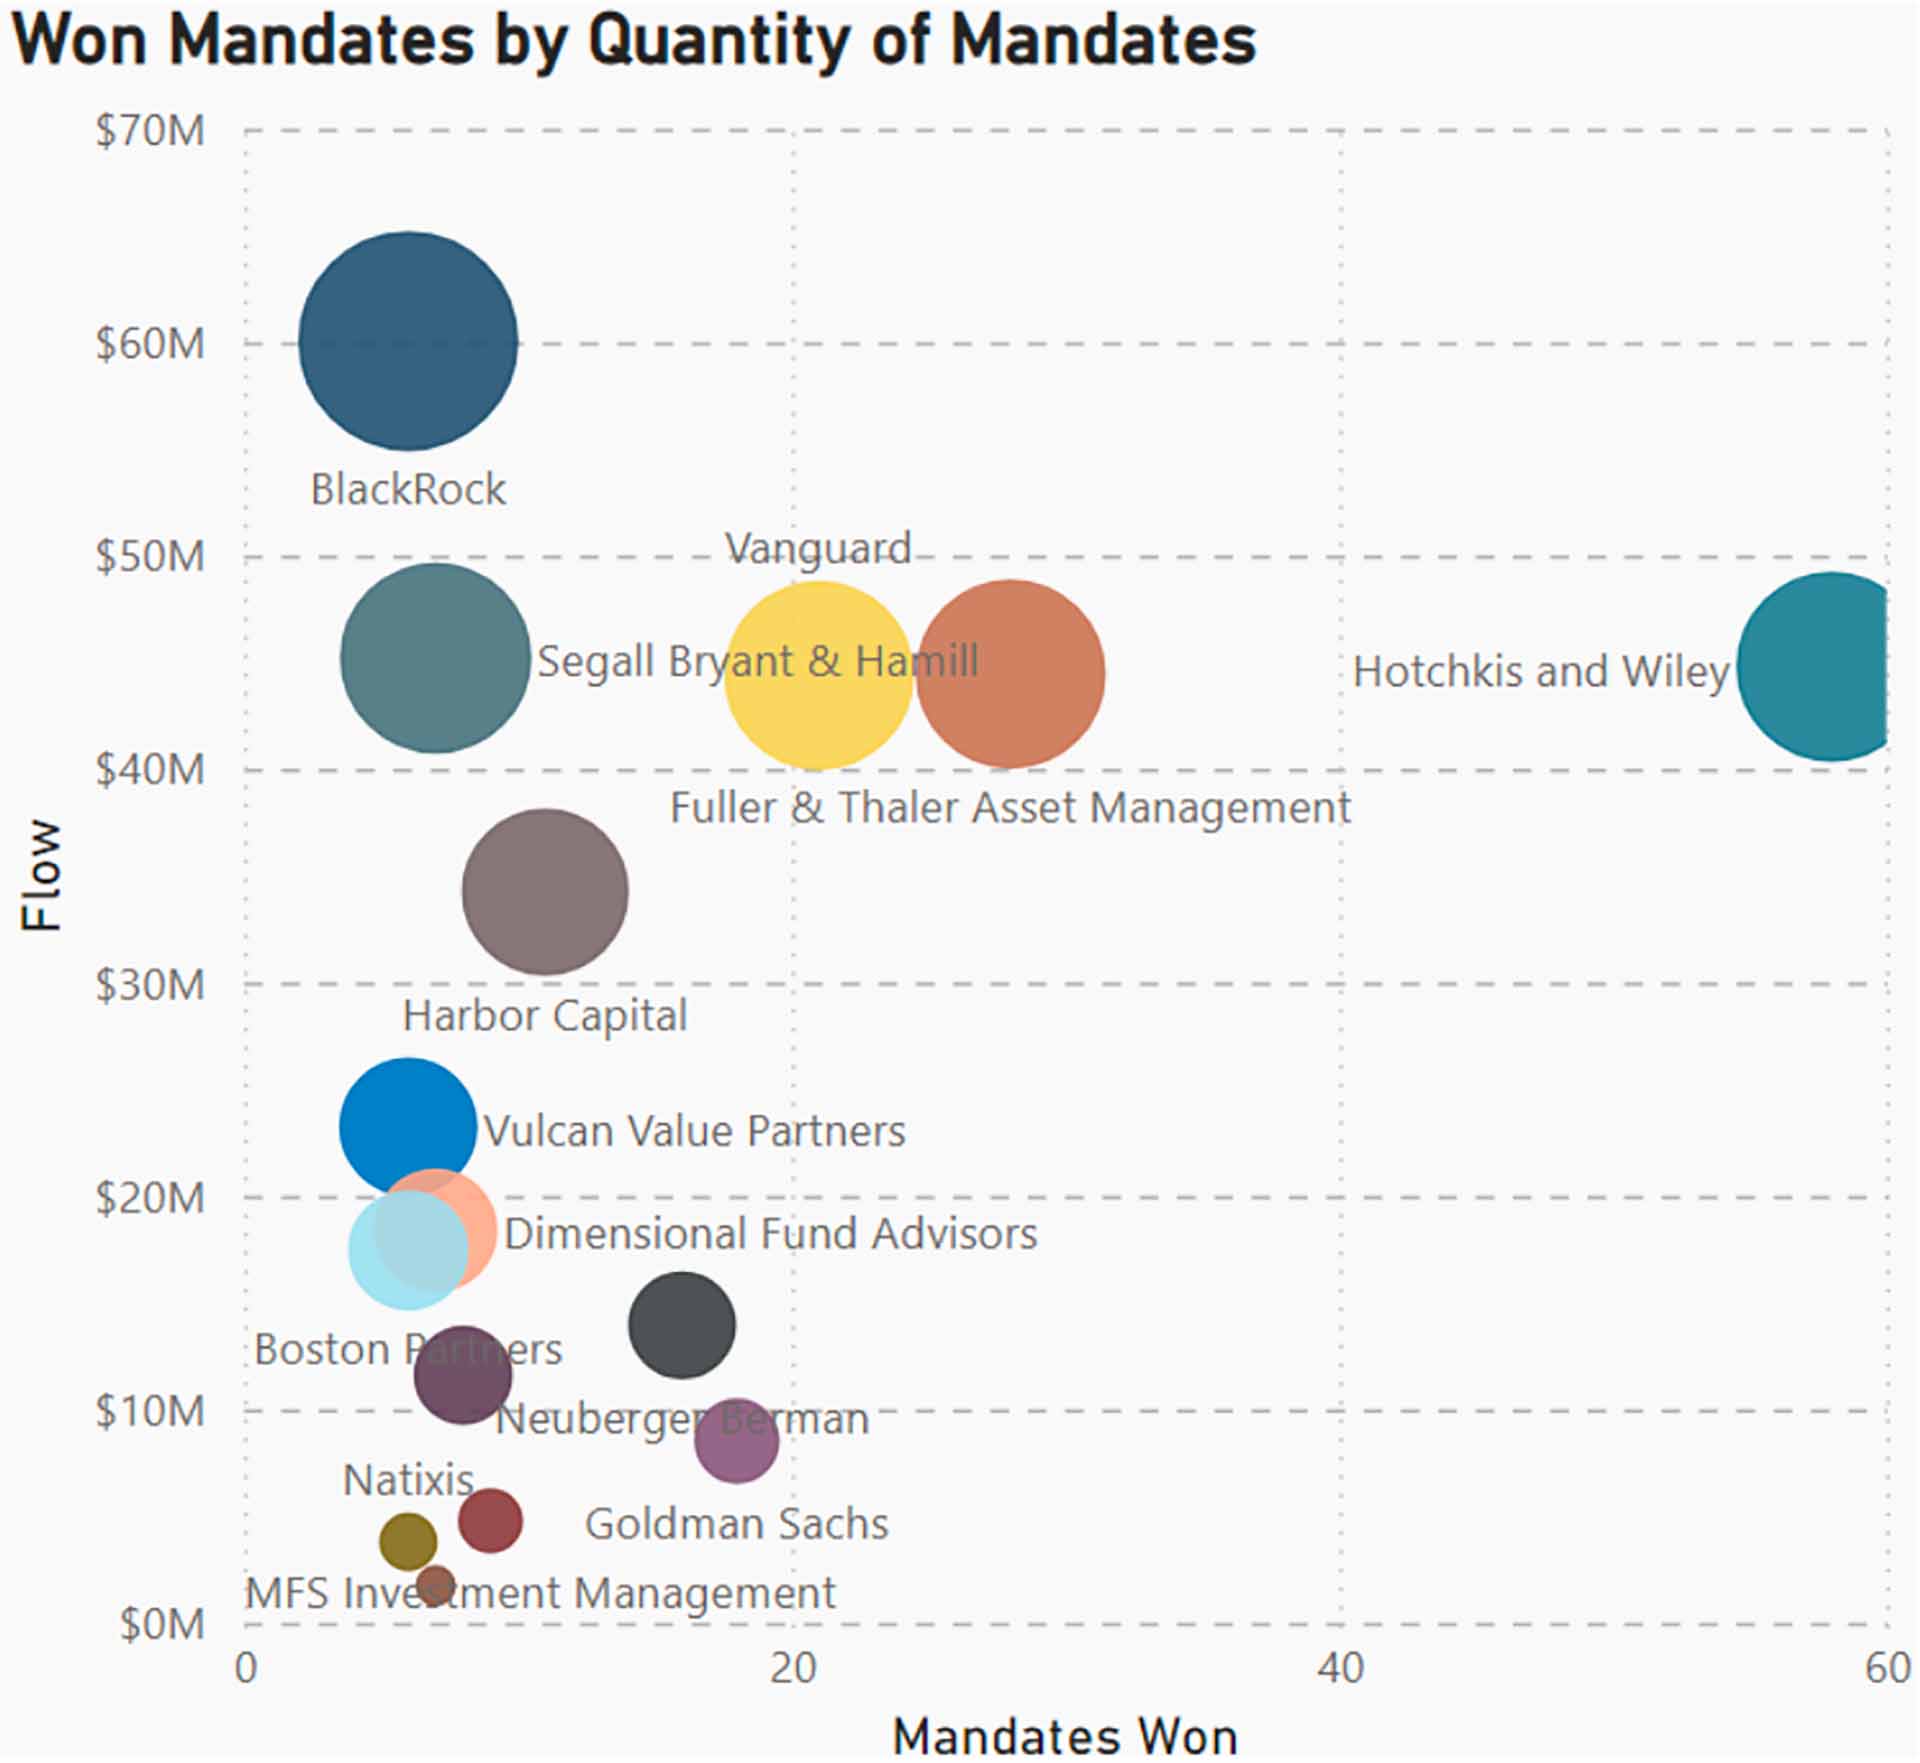
The top five winning managers of active U.S. Small-Cap value mandates within the Non Profit channel the last three years were BlackRock, Segall Bryant & Hamill, Vanguard, Fuller & Thaller, and Hotchkiss & Wiley. While BlackRock had net cash flows of $60m, Hotchkiss & Wiley won more mandates (58 vs. 6) and won more consistently (92% of the quarters).
Chart 6: Active U.S. Small-Cap Value Equity Winner Non-Profit.
Source: PRISM Analytics
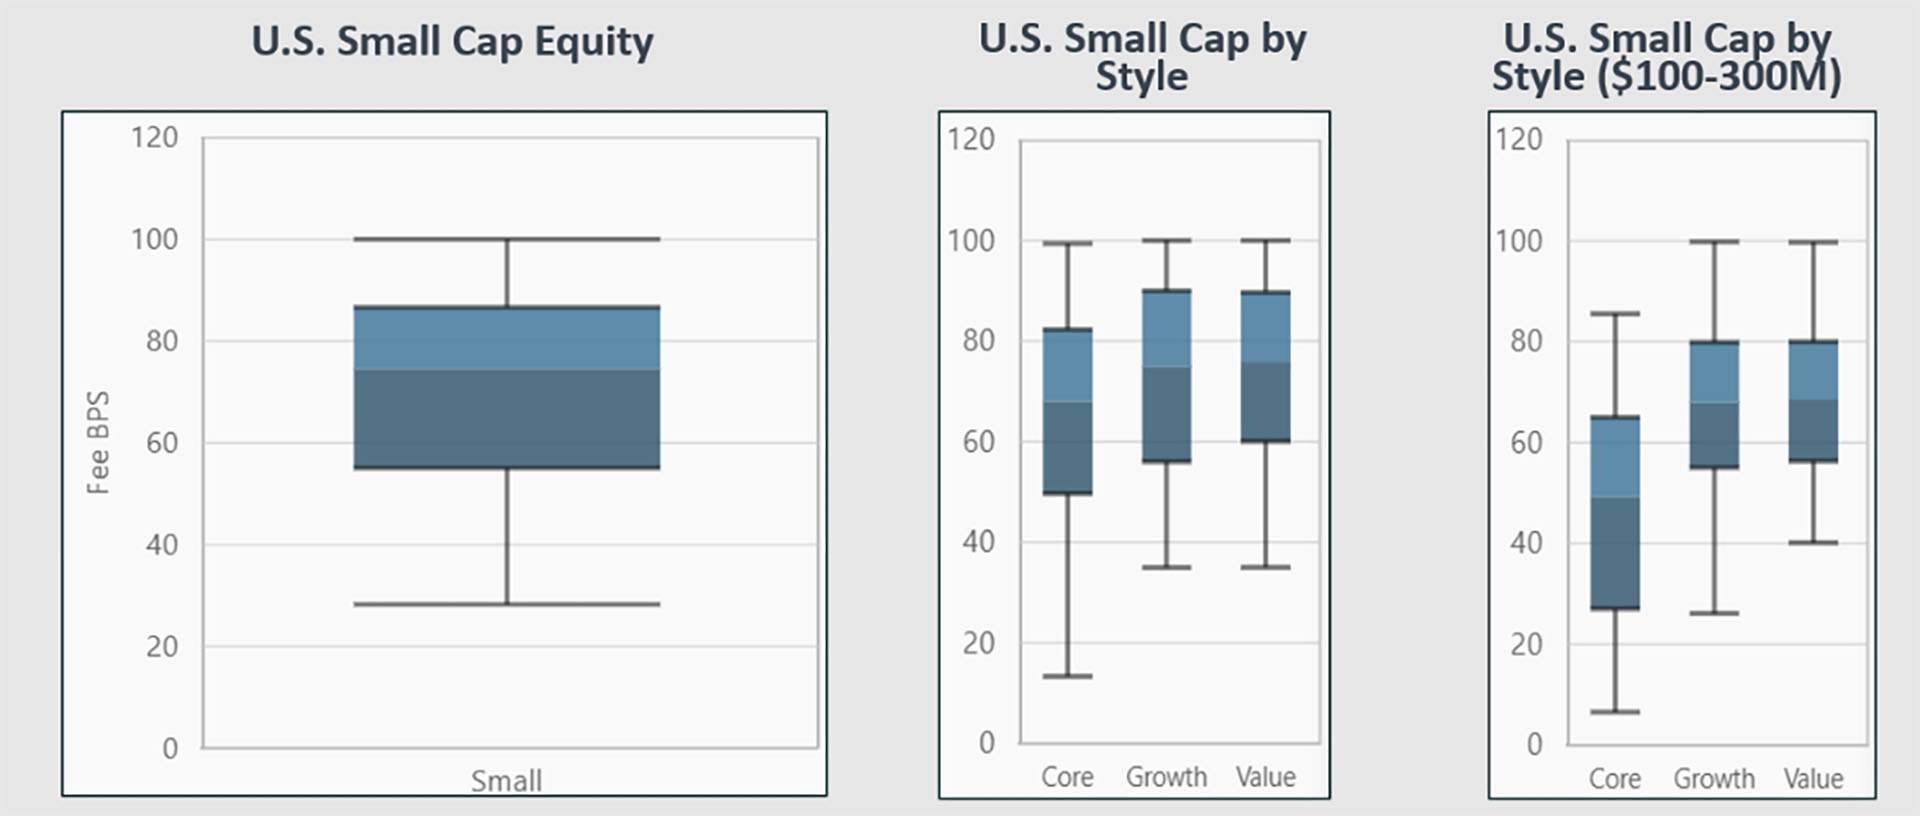
The median fee paid to active U.S. Small-Cap equity managers (all plan types and mandate sizes) was 74 bps, with a range from 29-100. The median within the Non-Profit space is slightly higher at 80 bps. Unlike the Large-Cap space, there is a slight premium to paid for value in Small-Cap (median 76 bps) compared to growth (median 75 bps). In fact, within the Large mandates above $100m there is a 7% premium for value (median 68.07bps) compared to growth (median 63.15bps).
Chart 7: Active U.S. Small-Cap equity post negotiated fee.
Source: PRISM Analytics
Style Analytics Factor Analysis
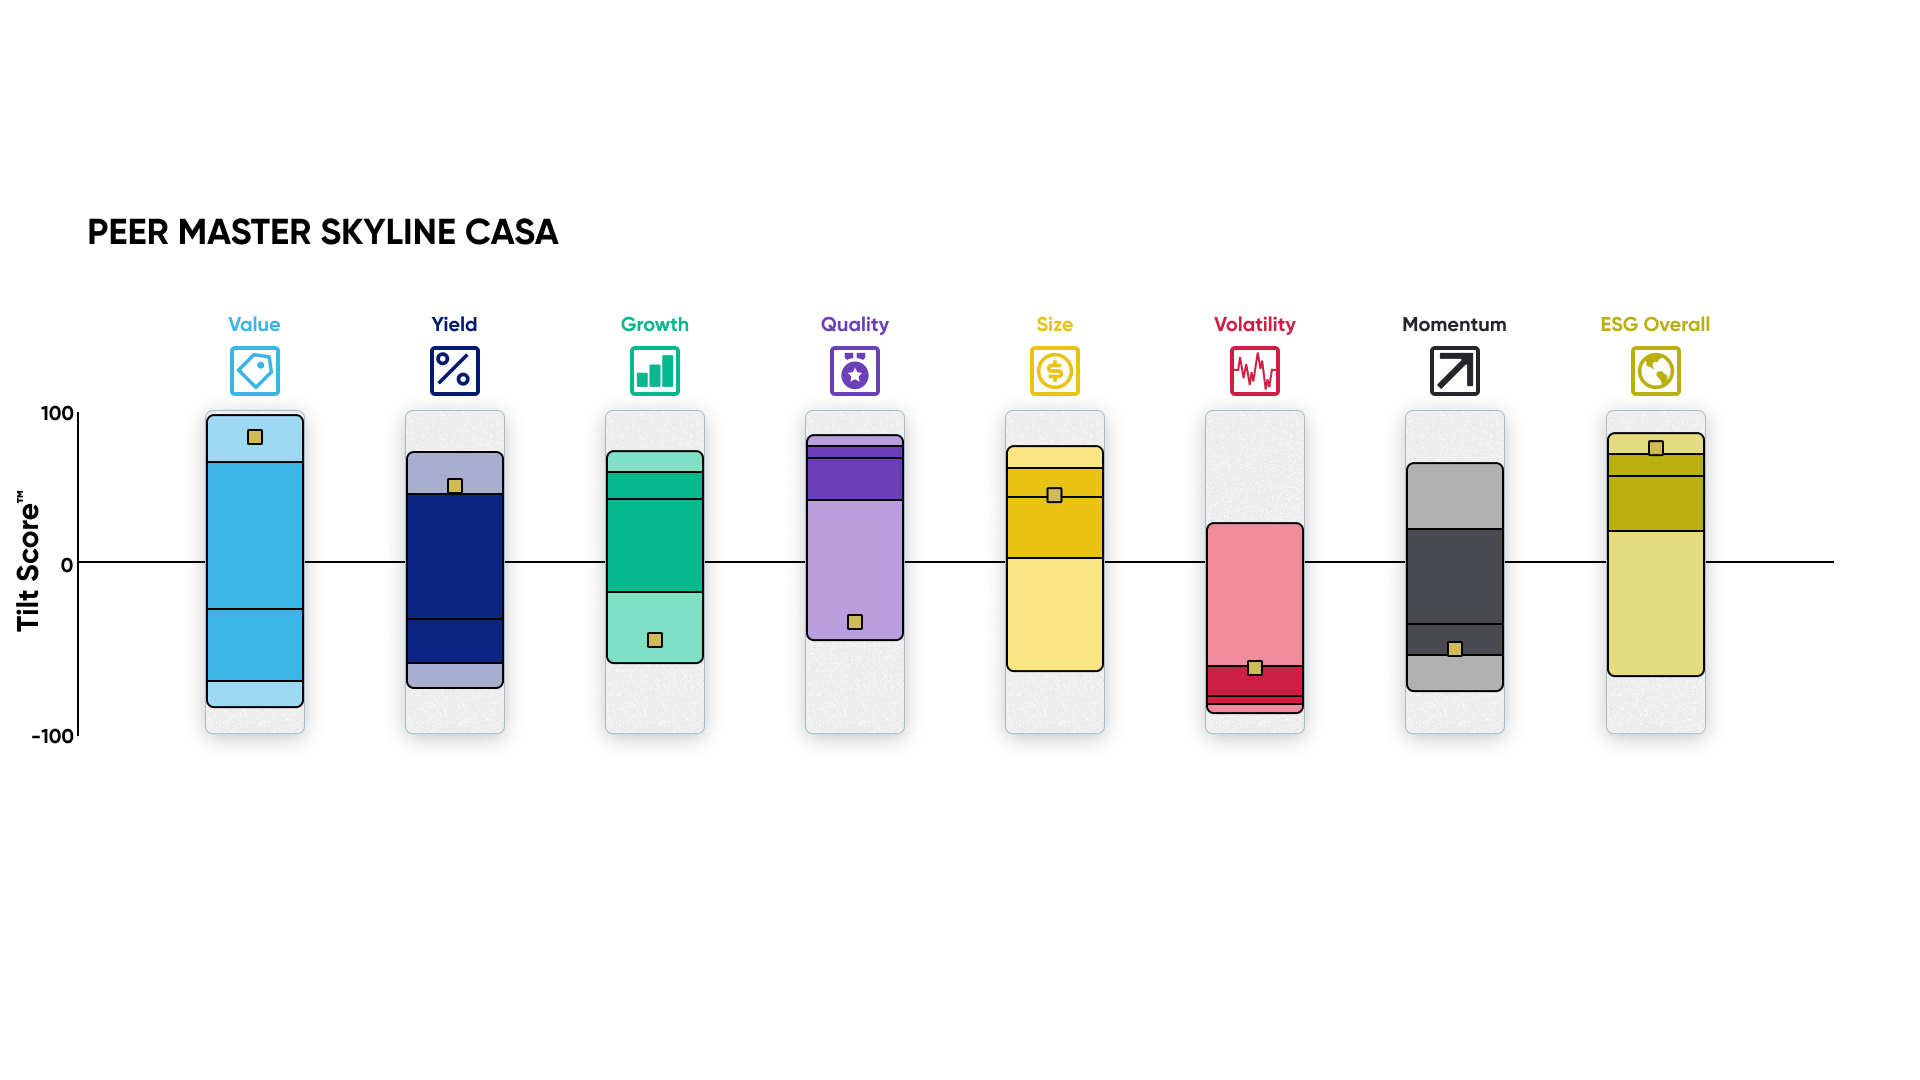
The Style Analytics Master Skyline below compares Hotchkiss & Wiley to other Small-Cap value managers and the Russell 2000 Value index. This portfolio is driven by Value and Yield factors, especially sales to price, earnings yield, and shareholder yield, placing them in the top quartile amongst Small-Cap value managers.
Unlike Aristotle, Hotchkiss & Wiley’s Small Cap value strategy shows bottom quartile Growth and Quality Factor tilts, possibly due to their focus on selecting very favorably priced companies. Like Aristotle, they excel in finding companies with strong ESG exposure and have top quartile long-term performance amongst other Small-Cap value managers, ranking in the top ten over three years and top quartile over five years.
Chart 8: Active U.S. Small-Cap Value Equity Winner – Master Skyline.
Source: Style Analytics, a Confluence company
Read more about Non-Profit Plans here: “Report: Q1 2024 Non-Profit Plans & Active U.S. Growth Equity Analysis.”
Disclaimer
The information contained in this communication is for informational purposes only. Investment Metrics, a Confluence company, is not providing legal, financial, accounting, compliance or other similar services or advice through this communication. Recipients of this communication are responsible for understanding the regulatory and legal requirements applicable to their business.
In this article:
About Confluence
Confluence is a global leader in enterprise data and software solutions for regulatory, analytics, and investor communications. Our best-of-breed solutions make it easy and fast to create, share, and operationalize mission-critical reporting and actionable insights essential to the investment management industry. Trusted for over 30 years by the largest asset service providers, asset managers, asset owners, and investment consultants worldwide, our global team of regulatory and analytics experts delivers forward-looking innovations and market-leading solutions, adding efficiency, speed, and accuracy to everything we do. Headquartered in Pittsburgh, PA, with 800+ employees across North America, the United Kingdom, Europe, South Africa, and Australia, Confluence services over 1,000 clients in more than 40 countries. For more information, visit www.confluence.com

