Portfolio Reporting
Increase accuracy, efficiency & insight with top-tier portfolio reporting
Learn howRevolution
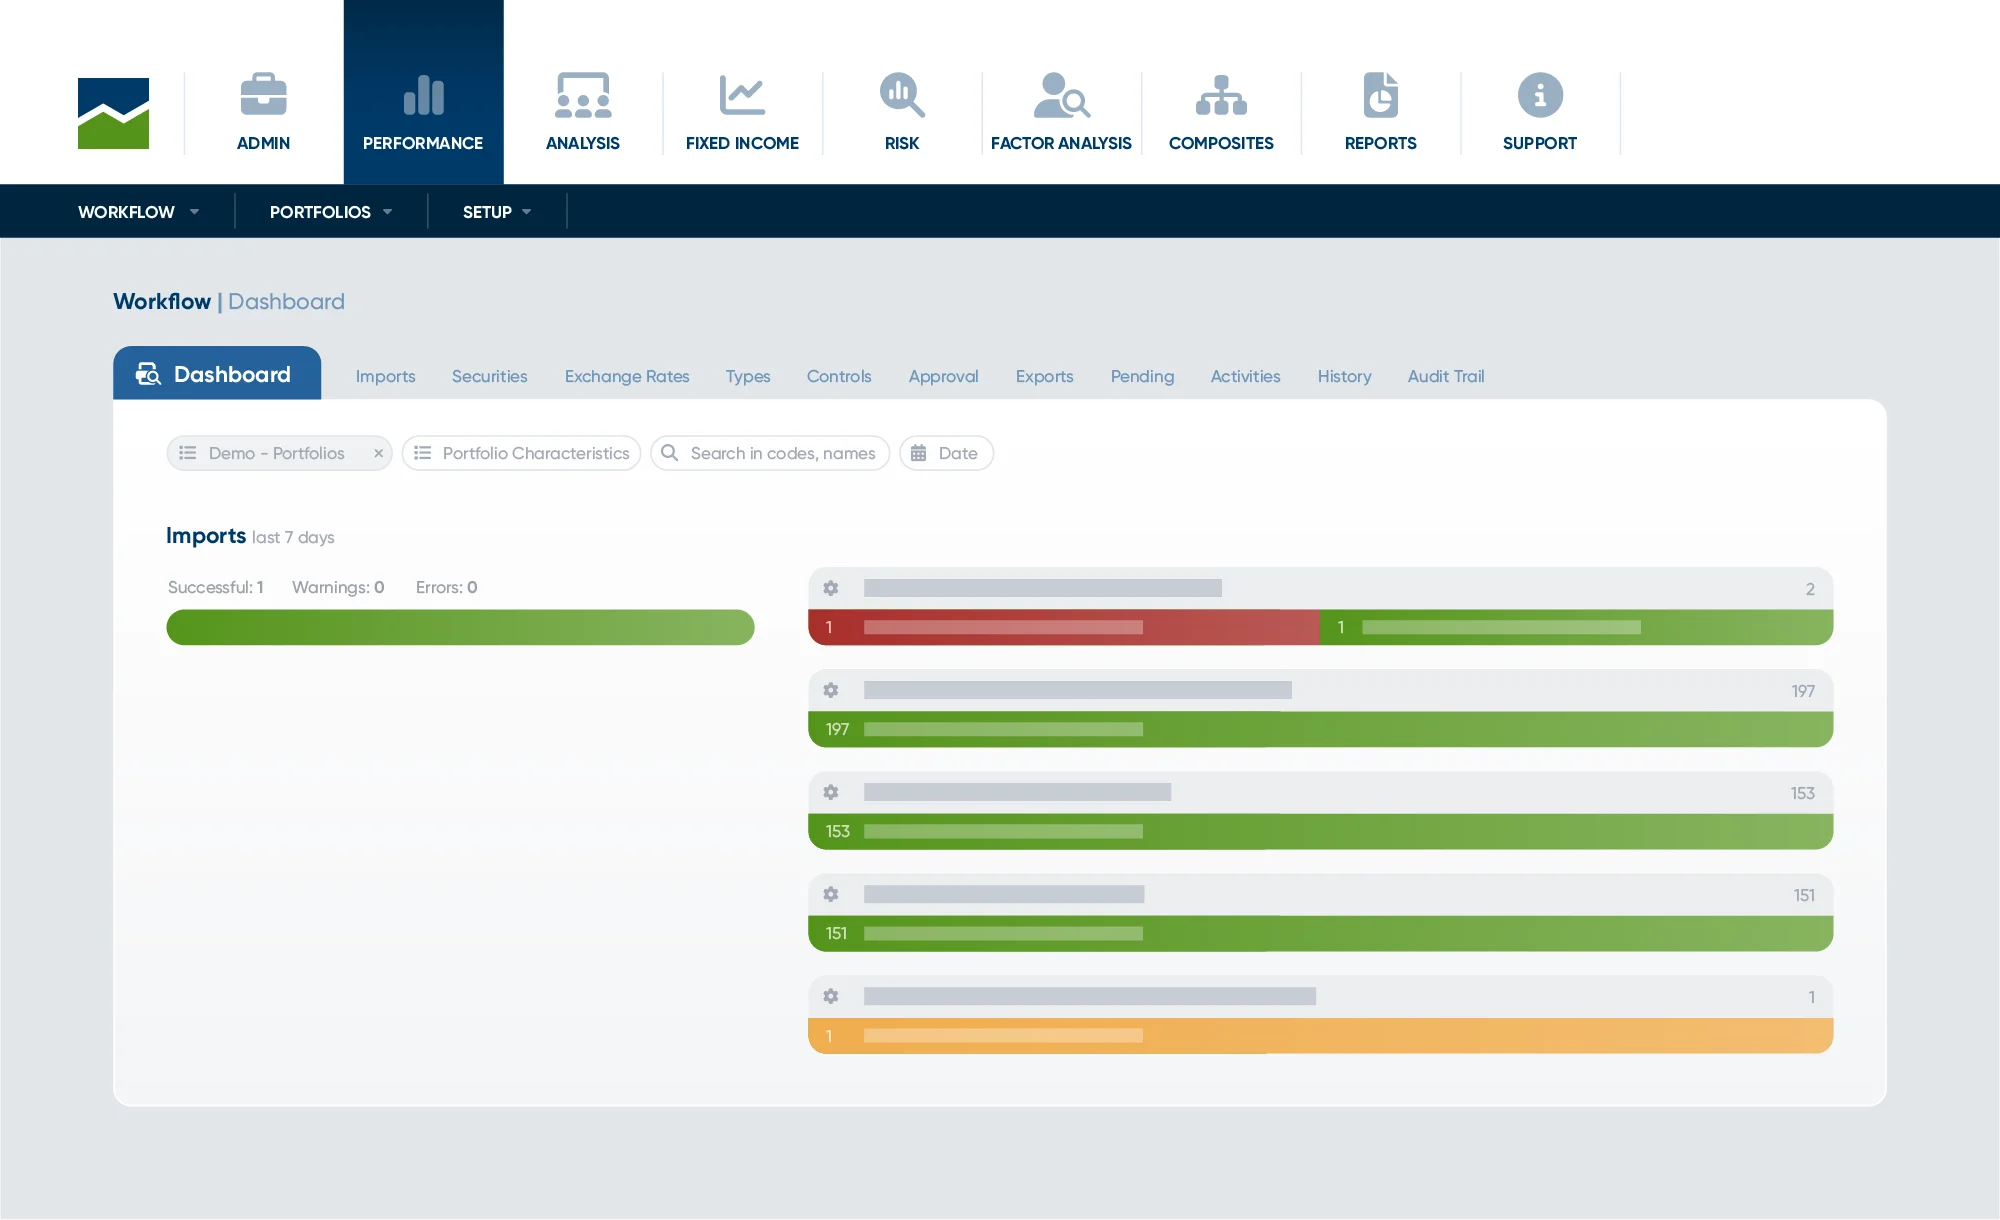
With intelligent data management and controlled automated workflows, this flexible, intuitive platform elevates the quality of portfolio and composites performance along with GIPS compliance and accelerates your ability to simplify operational and regulatory obligations.
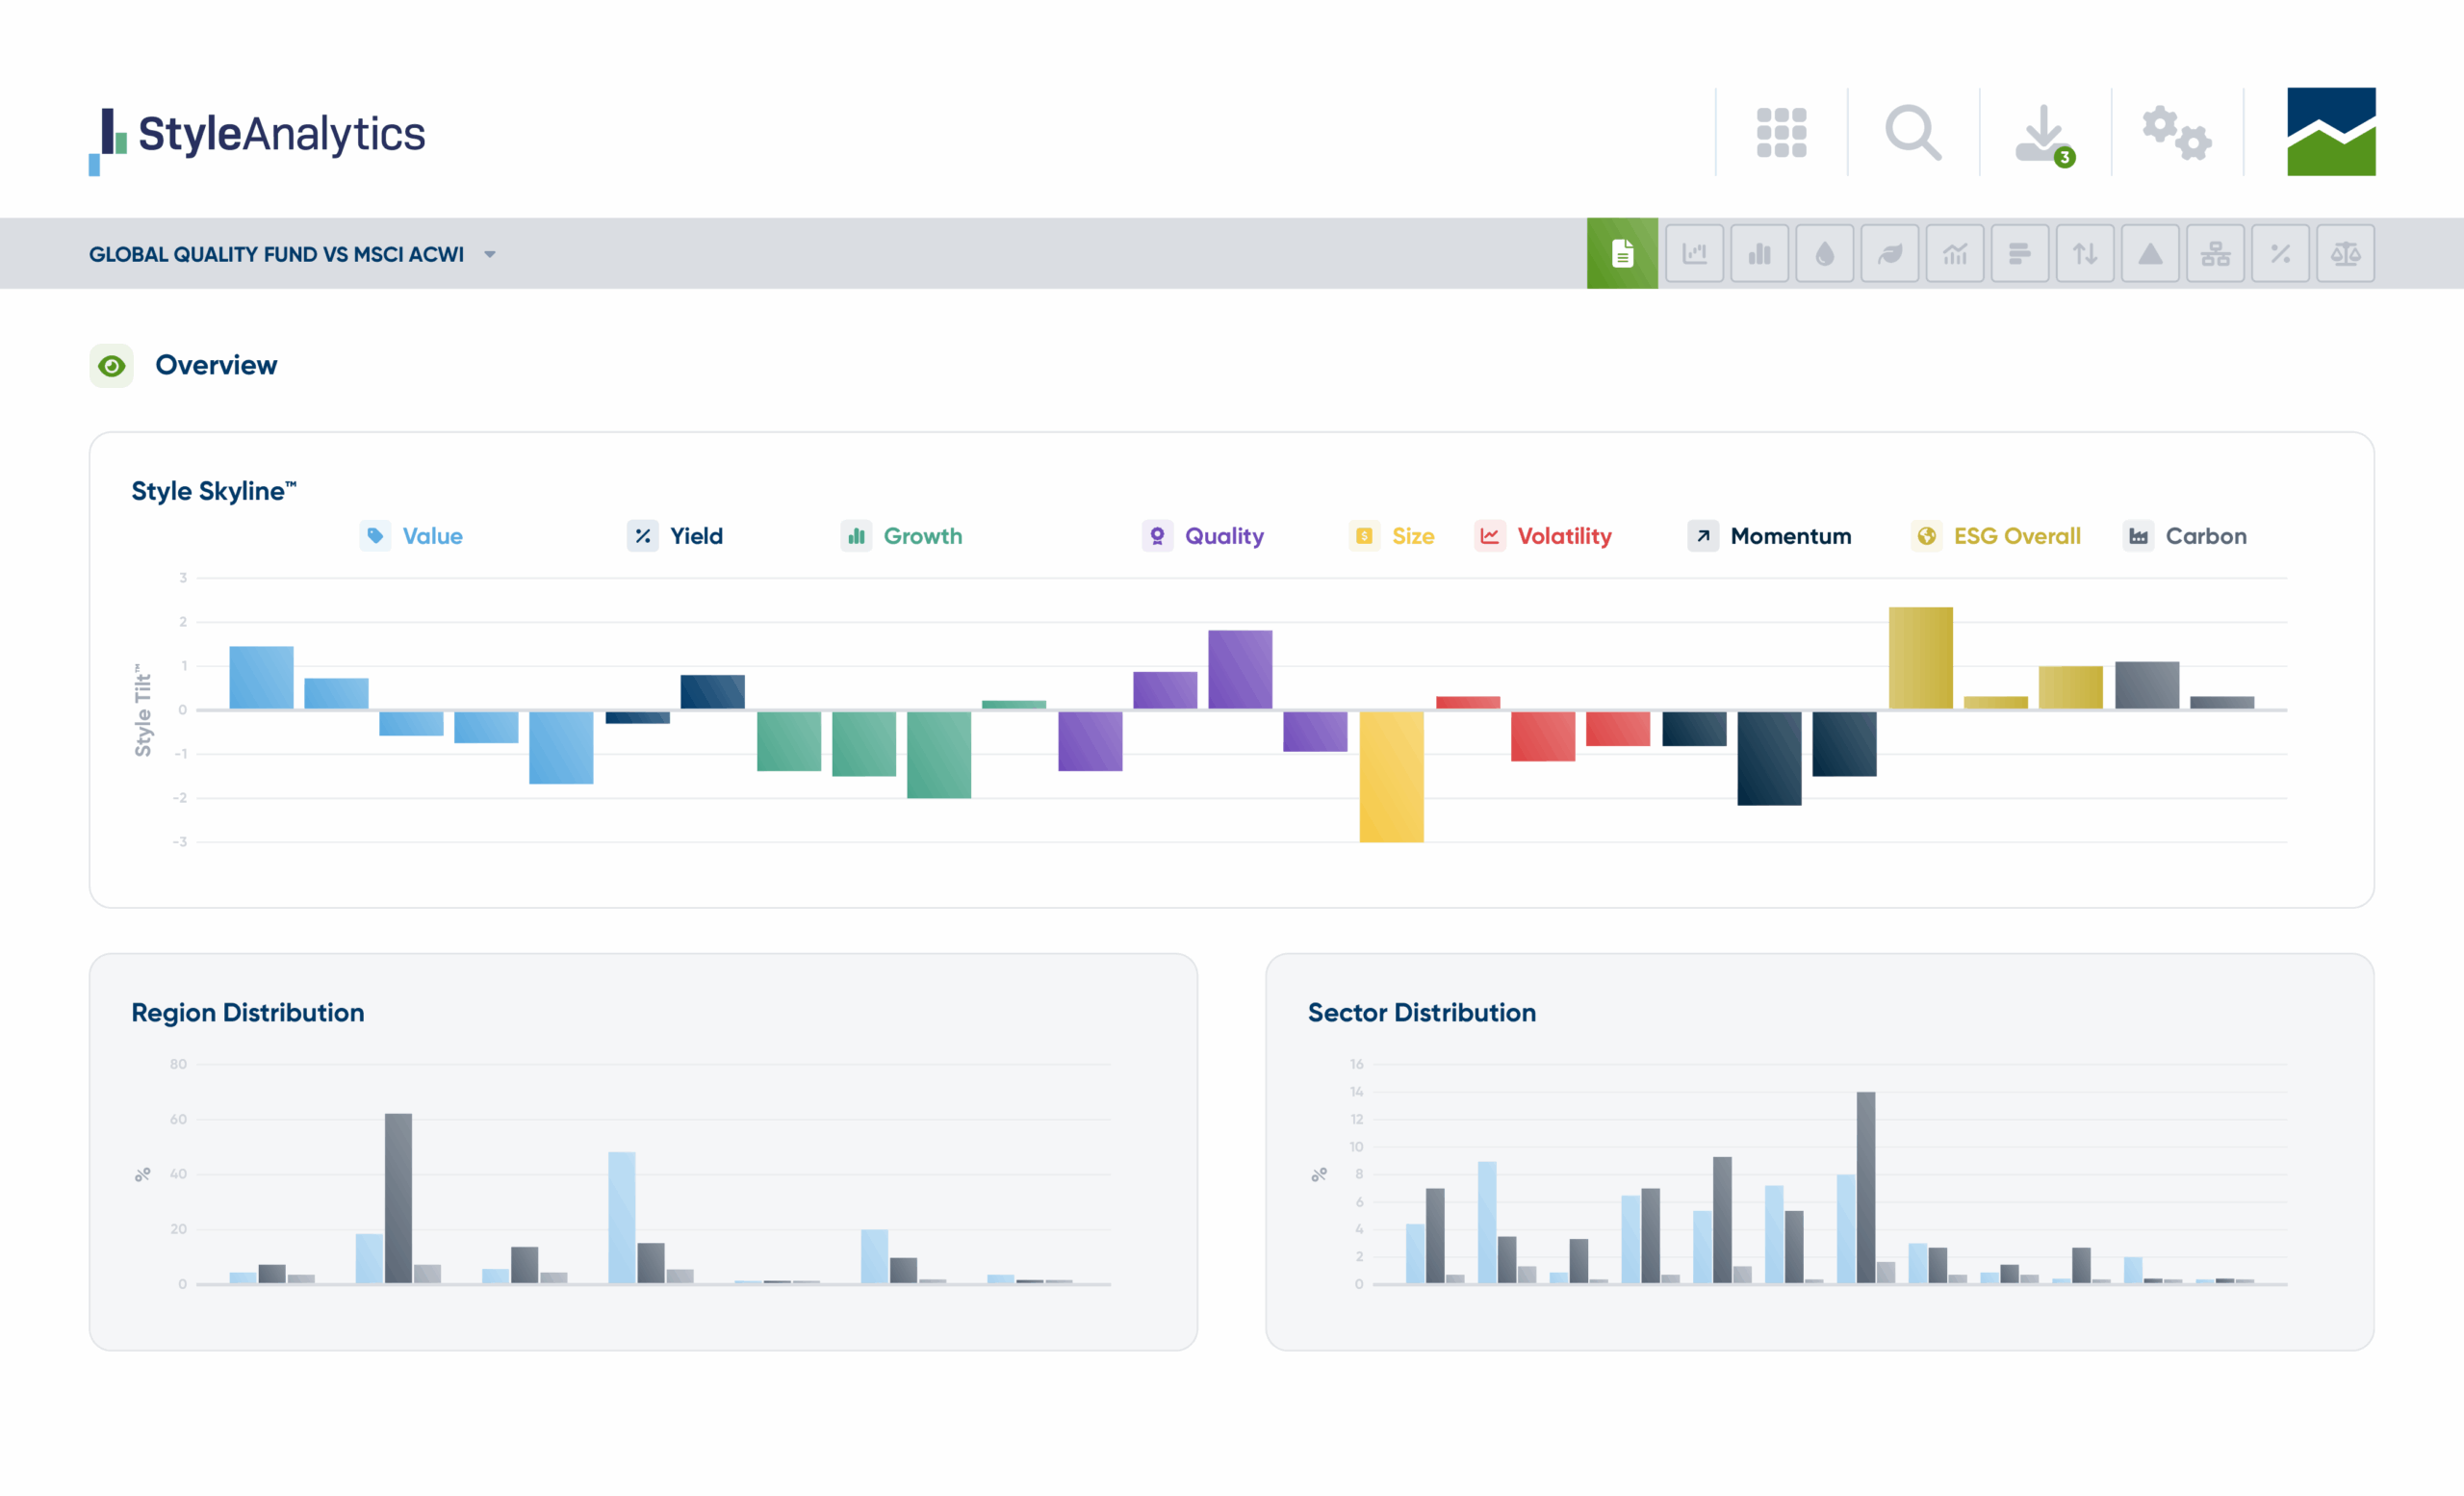
Style Analytics®
Our leading Style Skyline® is used by fund buyers and fund sellers to enrich portfolio reporting to communicate the style, ESG, and macro positions of equity portfolios.
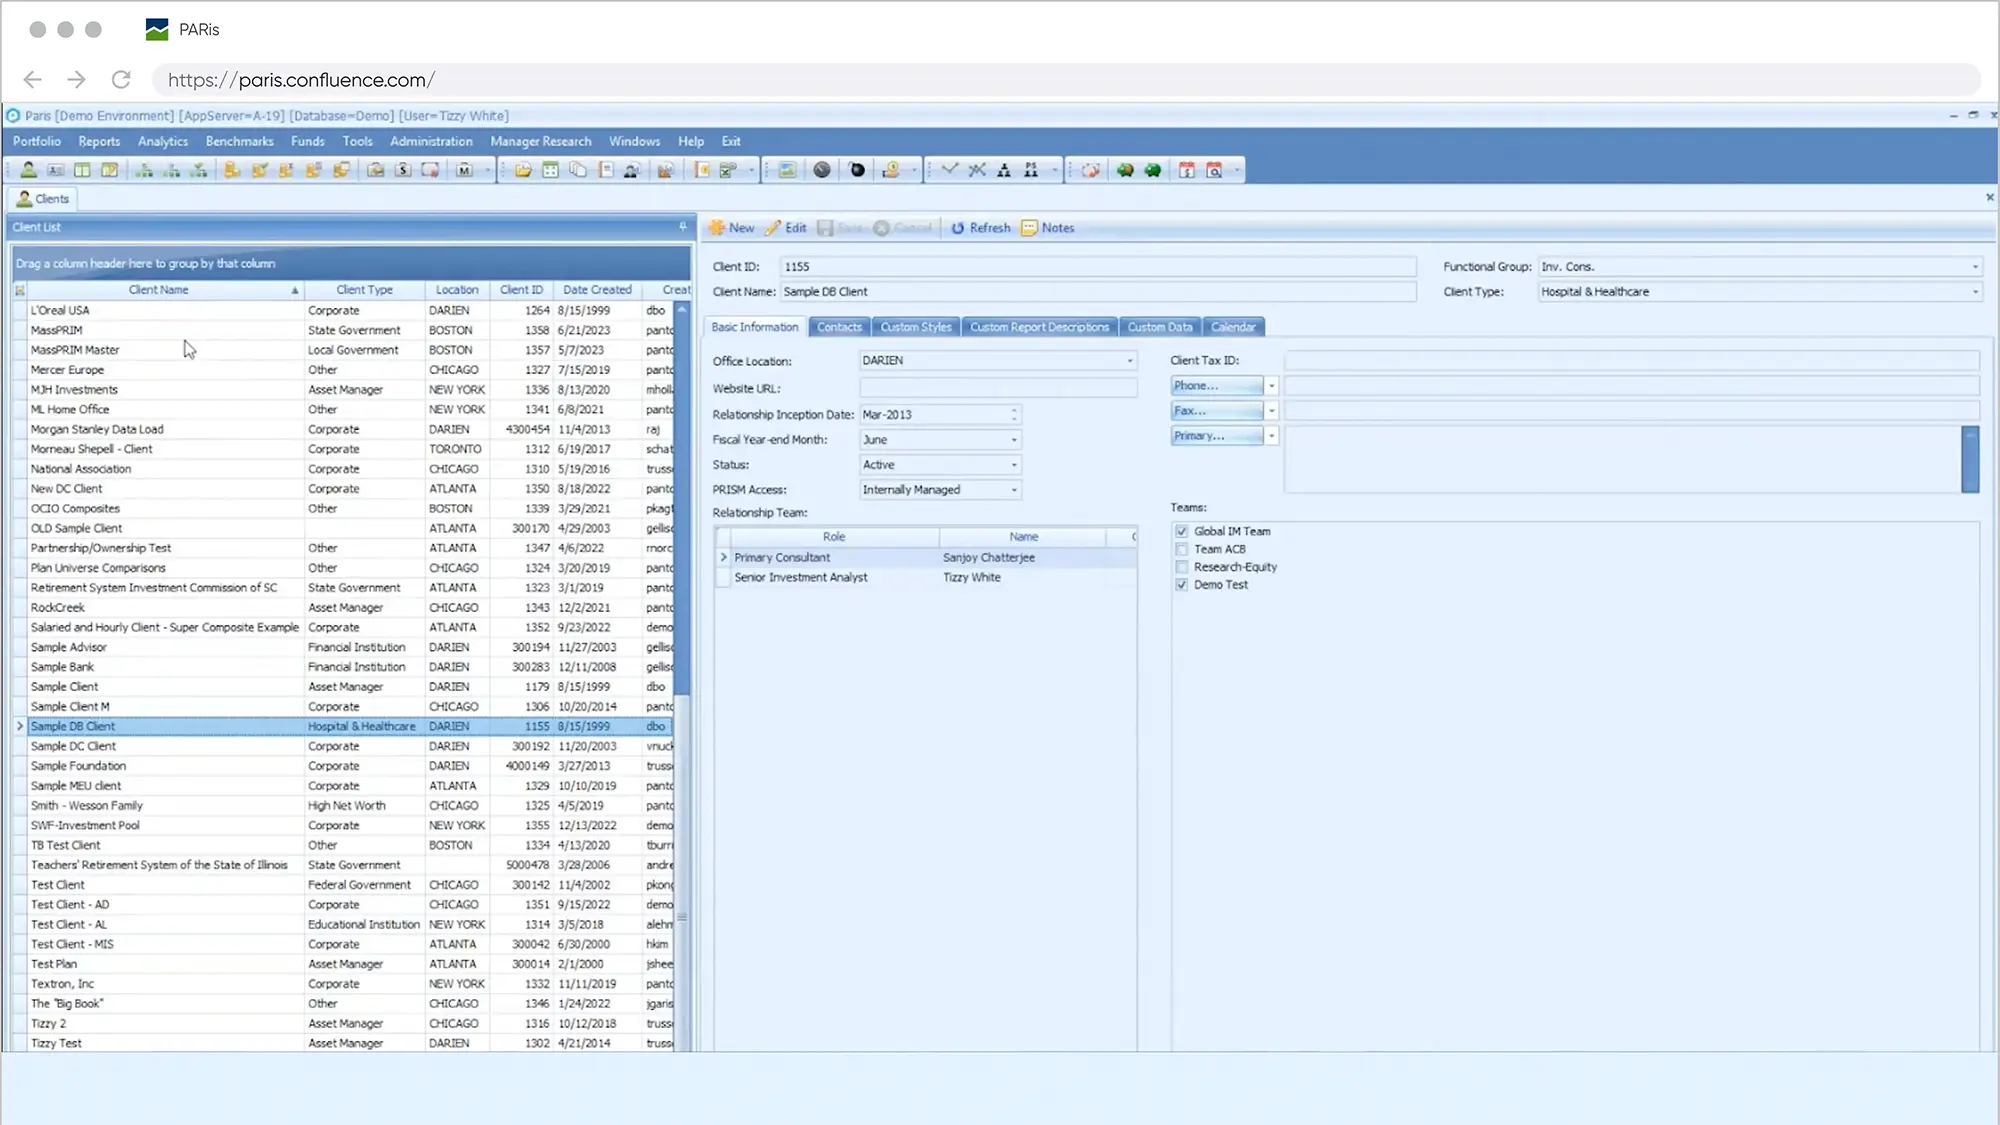
Portfolio Analytics & Reporting (PARis)
Automate data aggregation and streamline institutional plan analysis. With performance, attribution and peer benchmarking on a single platform, our straight-through reporting delivers a new level of efficiency.
Equip your team with the tools that accelerate and enrich performance measurement, risk analytics and in-depth factor analysis. Confluence sets the standard for client reporting with powerful, institutional portfolio reporting software solutions that make it easy to be right.
Streamline processes
Achieve greater efficiencies with automated workflows and easy-to-use analytical tools.
Increase accuracy
Automate, aggregate, improve and enrich data management. Eliminate error-prone manual processes.
Expand insight
Utilize powerful analytics and visualization tools to fuel portfolio reporting, benchmark against peers, and enrich decision-making.
Customized solutions for every segment
Asset Service Providers
Simplify processes and elevate service delivery with comprehensive portfolio reporting software.
Asset Managers
Assess portfolio reporting obligations and inform investment decisions with cutting-edge reporting tools.
Asset Owners
Achieve greater portfolio transparency and control with powerful client reporting solutions.
Investment Consultants
Utilize solutions relied on by 16 of the top 20 investment consultants, advising on over 90% of AUA.
Related content

Stablecoins: Bridging volatility and stability in the digital asset space
What are Stablecoins? Stablecoins are a specialized type of cryptocurrency designed to maintain a stable value by being pegged to a less volatile reference asset, usually a flat currency like the U.S. dollar (USD), short-term treasuries, or even commodities like gold. Unlike traditional cryptocurrencies that often experience dramatic price fluctuations, stablecoins aim to maintain a […]
Sep 16, 2025
4 min readPower up your portfolio reporting
Save time and effort, reduce errors and enrich your analytics and reporting
Request a demo.