Q1 2024
Non-Profit Plans & Active U.S. Growth Equity Analysis
Executive Summary
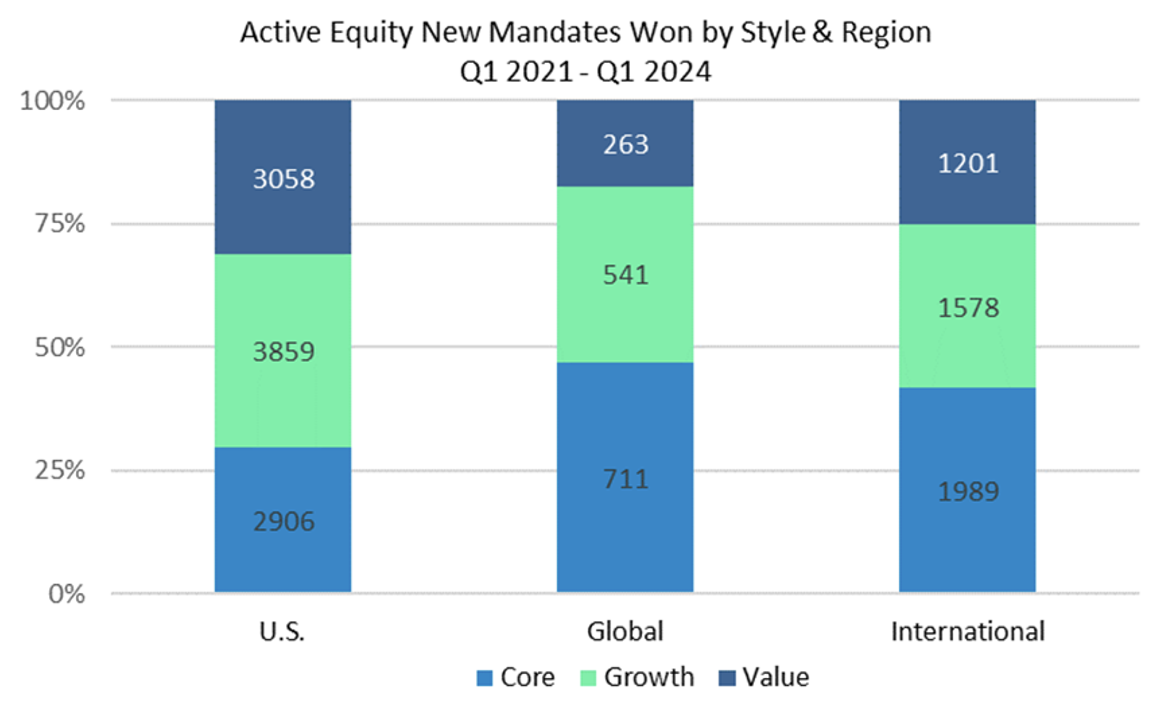
Highlights of key trends in institutional hiring activity, incorporating analysis from Confluence’s Prism & Style Analytics platforms. The focus is on the equity part of the analysis within the U.S. region as it was responsible for 67% of actively managed new mandates in the last three years (compared to 23% for non-U.S. and 10% for Global). Within active U.S. equity, we concentrated on the managers winning new mandates within Large & Small-Cap growth from Non-Profit clients, the factors that differentiated their products, and the post-negotiated fees paid.
Chart 1: Active Equity New Mandates by Style & Region
Source: PRISM Analytics
Highlights
- Highlights of key trends in institutional hiring activity, incorporating analysis from Confluence’s Prism & Style Analytics platforms. The focus is on the equity part of the analysis within the U.S. region as it was responsible for 67% of actively managed new mandates in the last three years (compared to 23% for non-U.S. and 10% for Global). Within active U.S. equity, we concentrated on the managers winning new mandates within large & Small-Cap growth from Non-Profit clients, the factors that differentiated their products, and the post-negotiated fees paid.
U.S. Large-Cap Growth
We used Prism Analytics to examine the number of equity mandates awarded for U.S. Large-Cap Growth by client type. Prism gives asset managers access to a range of previously unavailable market information: channel level flows of assets and allocations; actual post-negotiated fees by channel, investment type, and vehicle; and public and private (e.g., Corporate DB and Foundations & Endowments) mandates won/lost by manager. Over the last three years active managers won over 1,700 mandates in this space, with Non-Profit clients accounting for 28%.
Chart 2: Active U.S. Large-Cap Growth Equity Mandates Won by Client Type
Source: PRISM Analytics
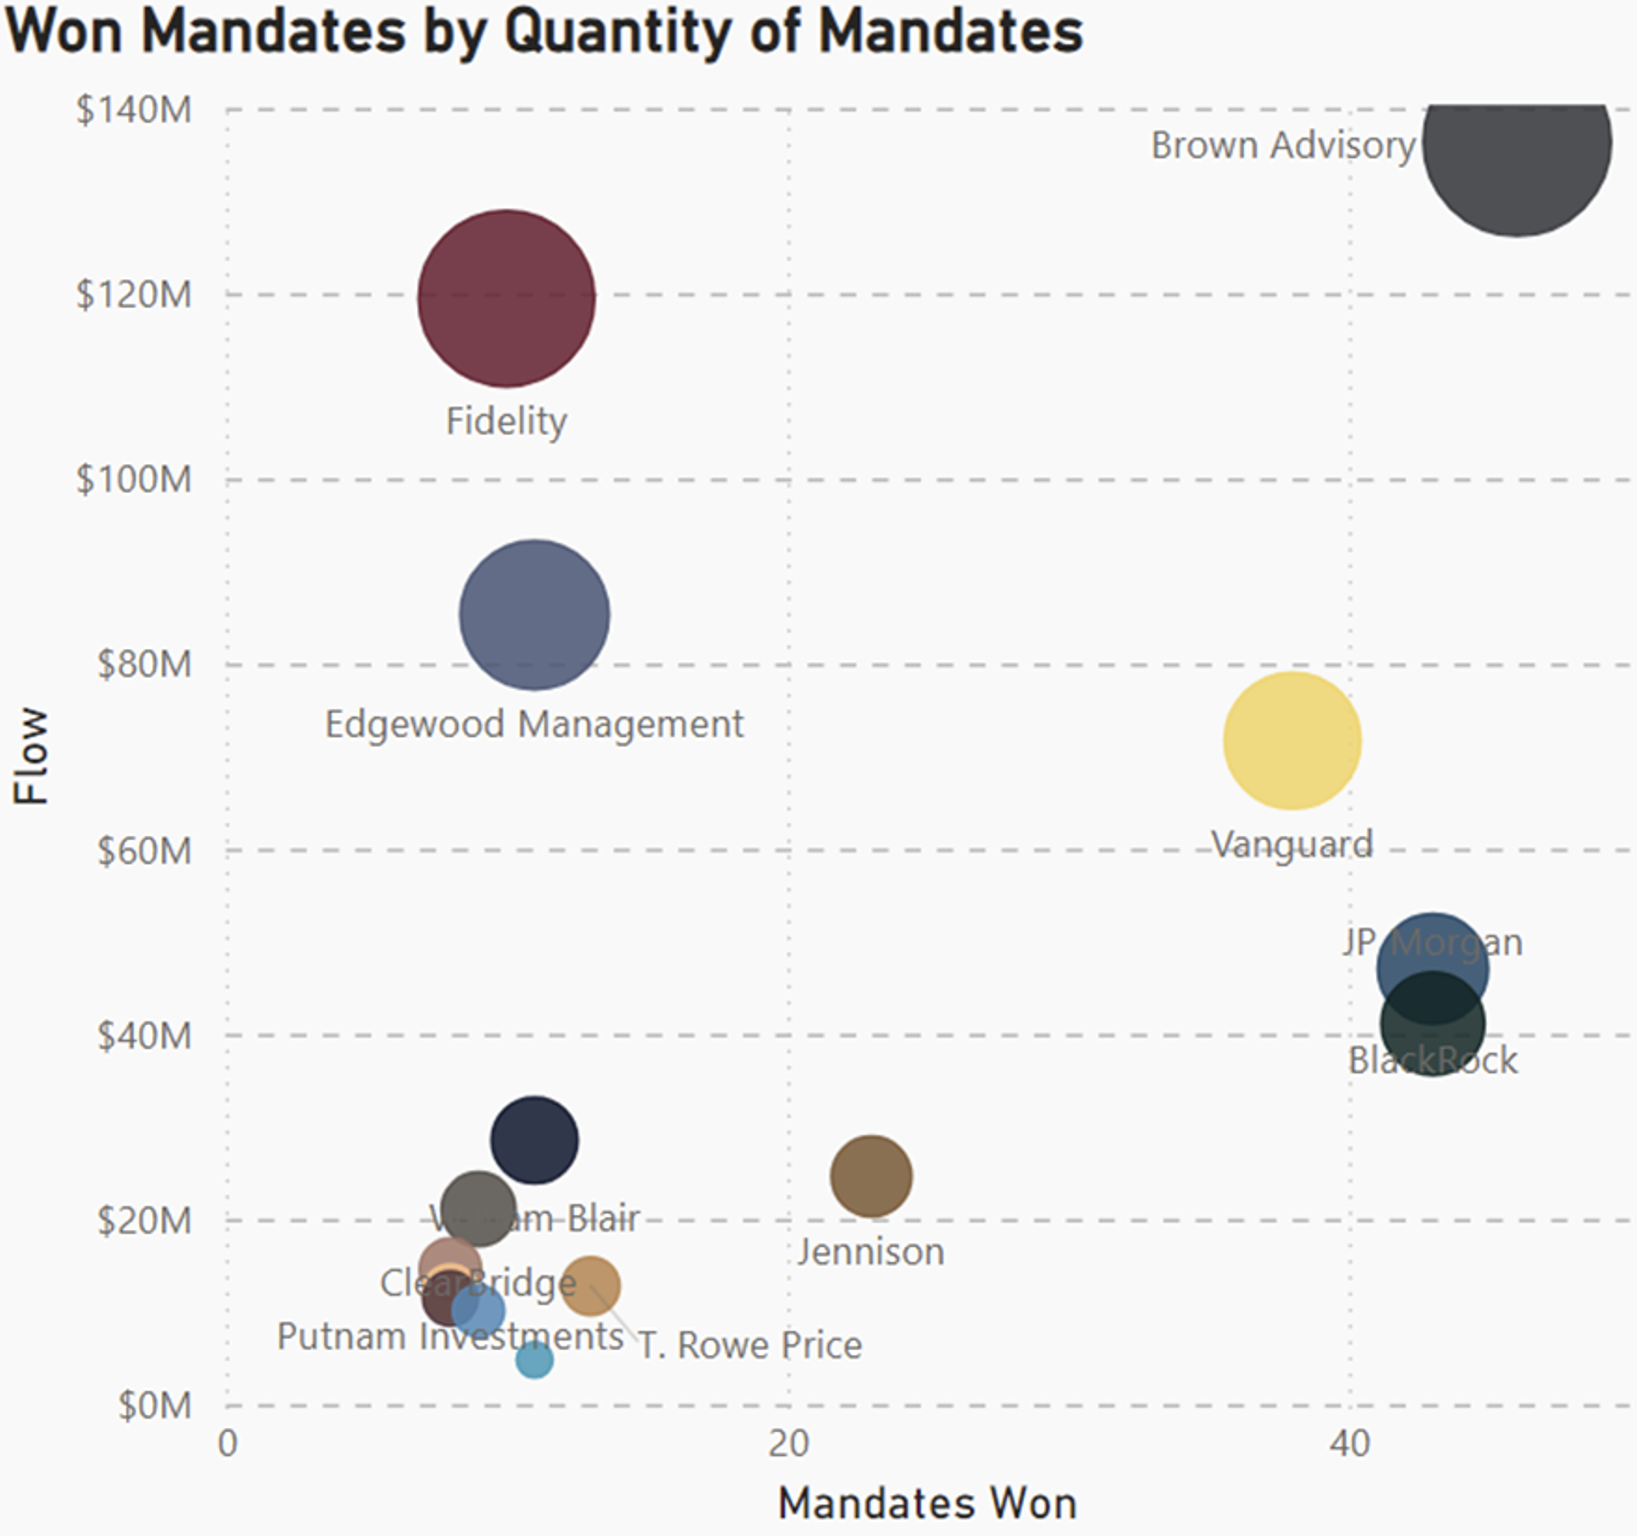
Brown Advisory, Fidelity, and Edgewood were the top three winning managers of active U.S. Large-Cap growth mandates within the Non-Profit channel in the last three years. Brown Advisory, which manages over #30 billion in concentrated Large-Cap growth portfolios, won forty-six new mandates with a net cash flow of $136m.
Chart 3: Active U.S. Large-Cap Growth Equity Winner Non-Profit
Source: PRISM Analytics
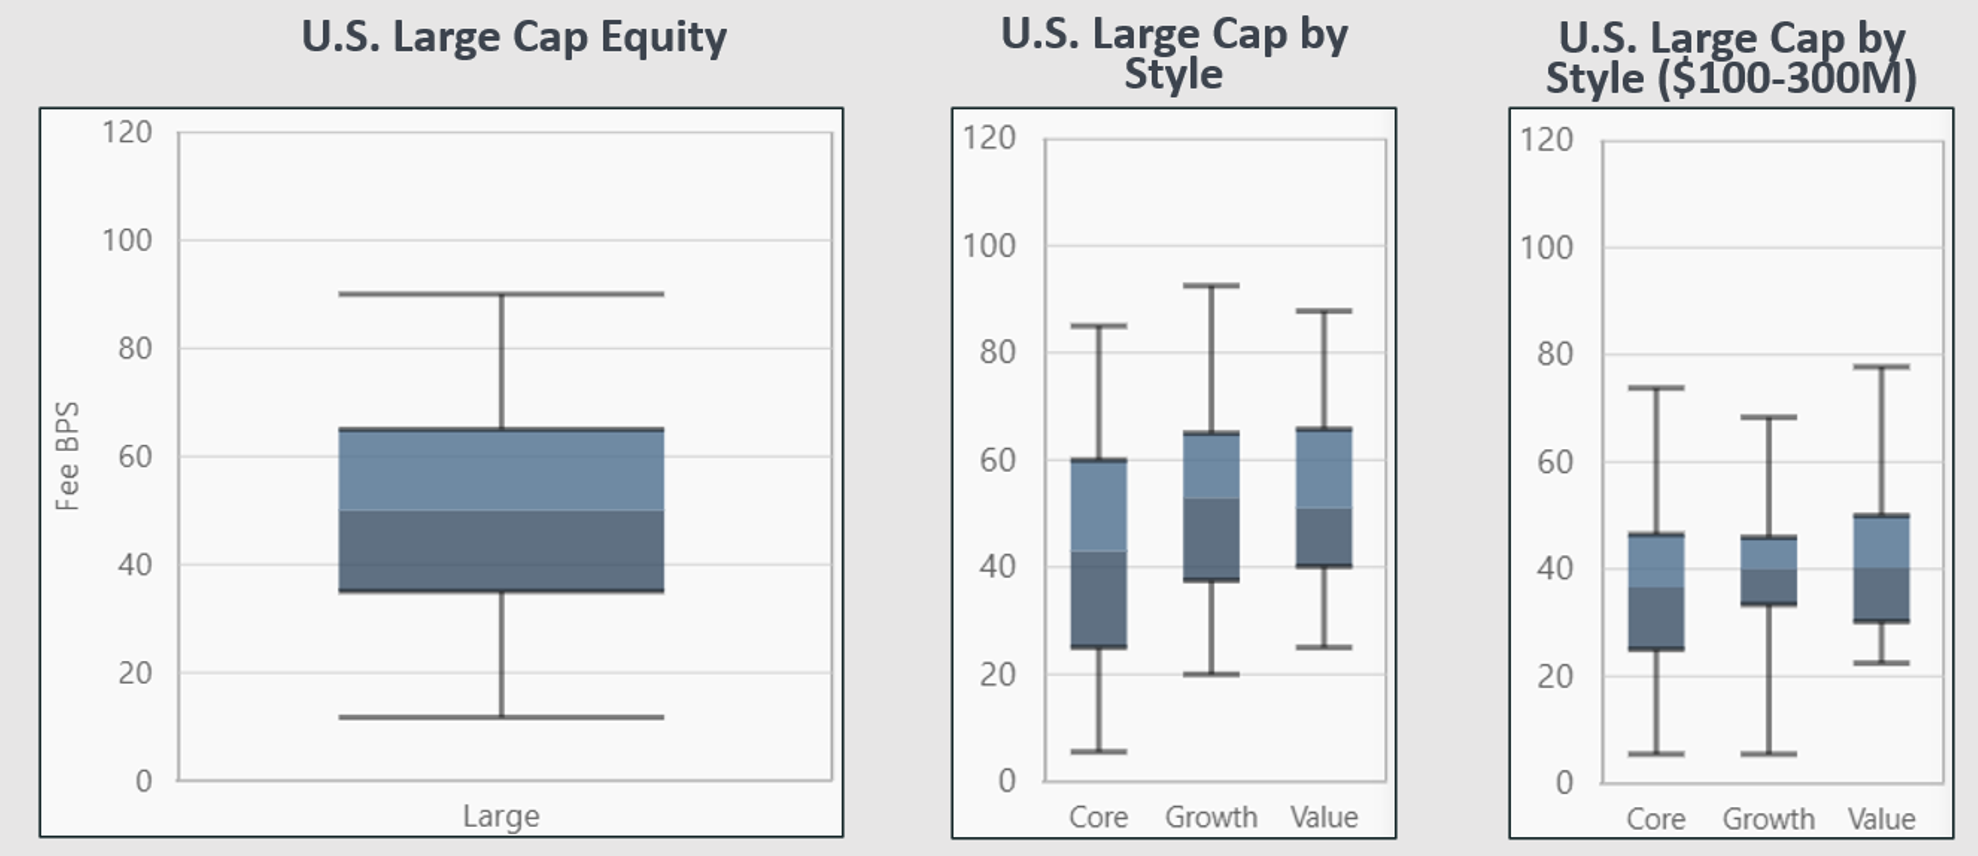
The median fee paid to active U.S. Large-Cap equity managers (all plan types and mandate sizes) is 50 basis points, with a range from 12-90. The median within the Non-Profit space is slightly higher at 55 basis points. Along style lines, there is a slight premium paid to growth (median 53 bps) compared to value (median 51 bps), though once we get to large mandates above $100m there is parity by style (median’s 40bps).
Chart 4: Active U.S. Large-Cap Post Negotiated Fee
Source: PRISM Analytics
Style Analytics Factor Analysis
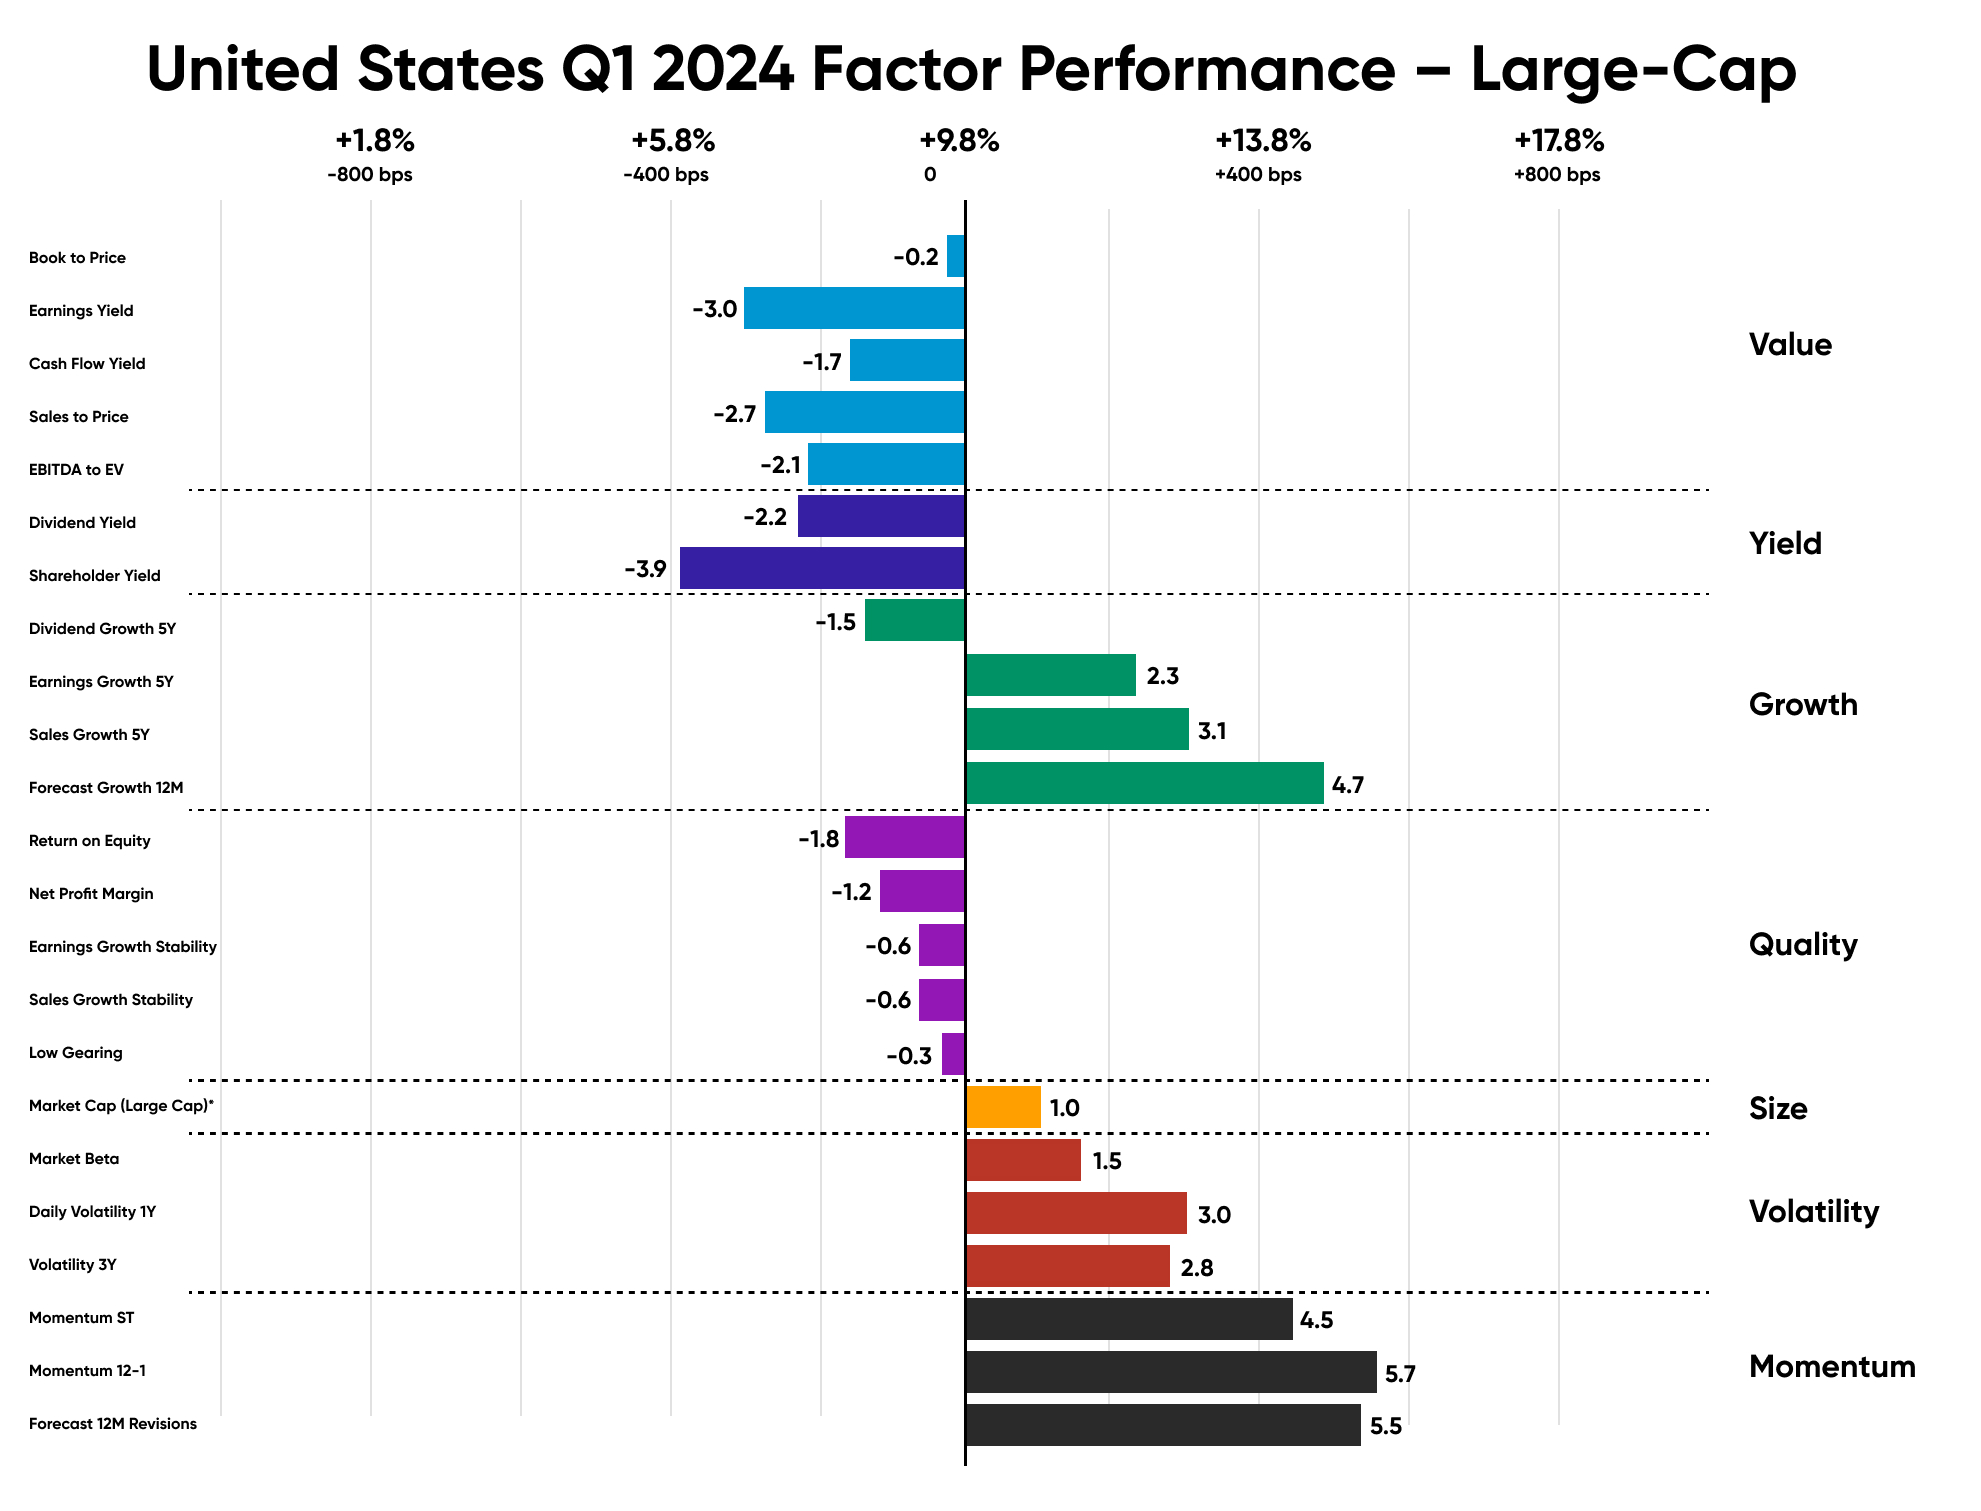
In the US, Growth significantly outperformed the market in the first quarter of 2024, supported by stocks with strong momentum. Stocks that excelled in Q4 continued their strong performance, driven by tech giants Nvidia and Meta, which delivered returns of 82% and 27%, respectively.
The renewed risk-on sentiment from Q4 persisted into early 2024, favoring more volatile equities, which outperformed by 300 bps at the expense of defensive Value and Yield strategies, which lagged the market by up to 390 bps.
Chart 5: United States Q1 2024 Factor Performance – Large-Cap.
Source: Style Analytics
Style Analytics Factor Analysis
Using Style Analytics Peer Insights, we evaluated how Brown Advisory fundamentally distinguishes itself from other Growth managers relative to the Russell 1000 Growth benchmark. Their Large-Cap Sustainable Growth portfolio closely aligns with the factors that outperformed in the US market, particularly Growth and Volatility, measured by five-year sales growth and one-year daily volatility, respectively.
The Style Skyline™ indicates that their Large-Cap Sustainable Growth portfolio focuses on smaller companies compared to the benchmark, with a robust five-year asset growth history and slightly higher one-year daily volatility than both the benchmark and the Large-Cap Growth peer group. Additionally, the portfolio maintains an outlier exposure to ESG metrics, as defined by MSCI.
Within Growth, the fund sets itself apart by focusing on stocks with strong asset growth, earnings growth, sales growth, and capital expenditure over five years. It also maintains an above-median exposure to companies with promising forecasted growth in the coming year, as IBES estimates indicate.
Chart 6: United States Q1 2024 Factor Performance – Large-Cap Growth.
Source: Style Analytics
U.S. Small-Cap Growth
The chart below examines the number of equity mandates awarded for active U.S. Small-Cap Growth by client type. Active managers won over 1,000 mandates in this space in the last three years, with Non-Profit clients accounting for 29%.
Chart 7: Active U.S. Small-Cap Growth Equity Mandates by Client Type
Source: PRISM Analytics
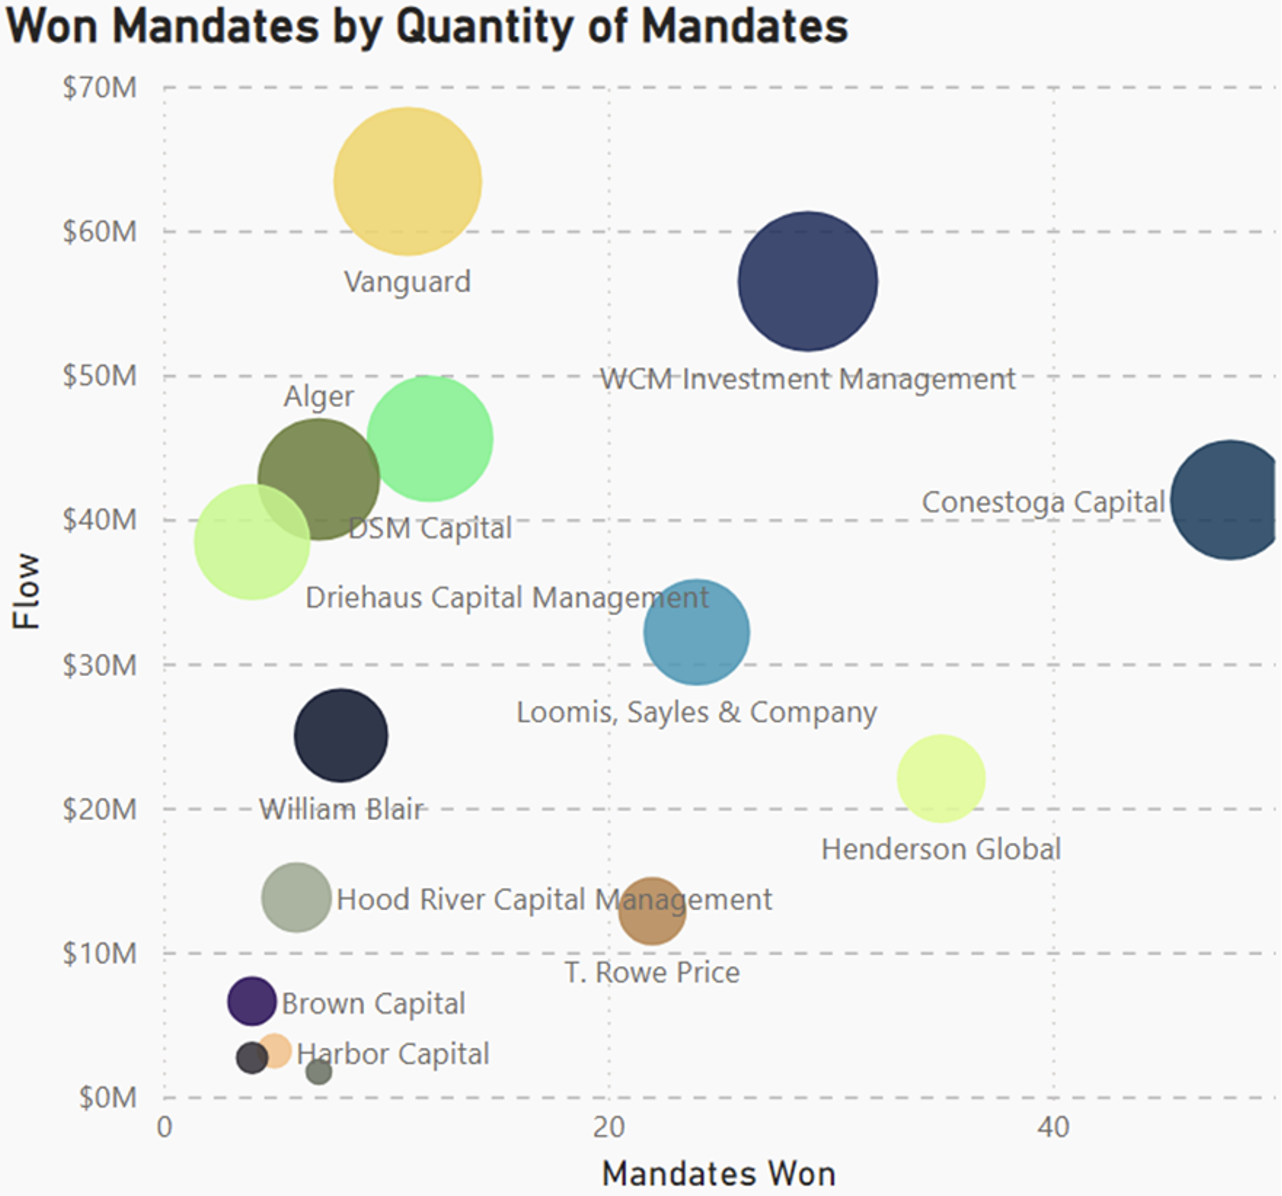
The top five winning managers of active U.S. Small-Cap growth mandates within the Non-Profit channel in the last three years were Vanguard, WCM, DSM, Alger, and Conestoga. While Vanguard had over $63m net cash flows, most of the assets were won in a single quarter. Conestoga Capital won more consistently (92% of the quarters) and won more mandates (48 vs 11) for $41m in net cash flows.
Chart 8: Active U.S. Large-Cap Growth Equity Winner Non-Profit.
Source: PRISM Analytics
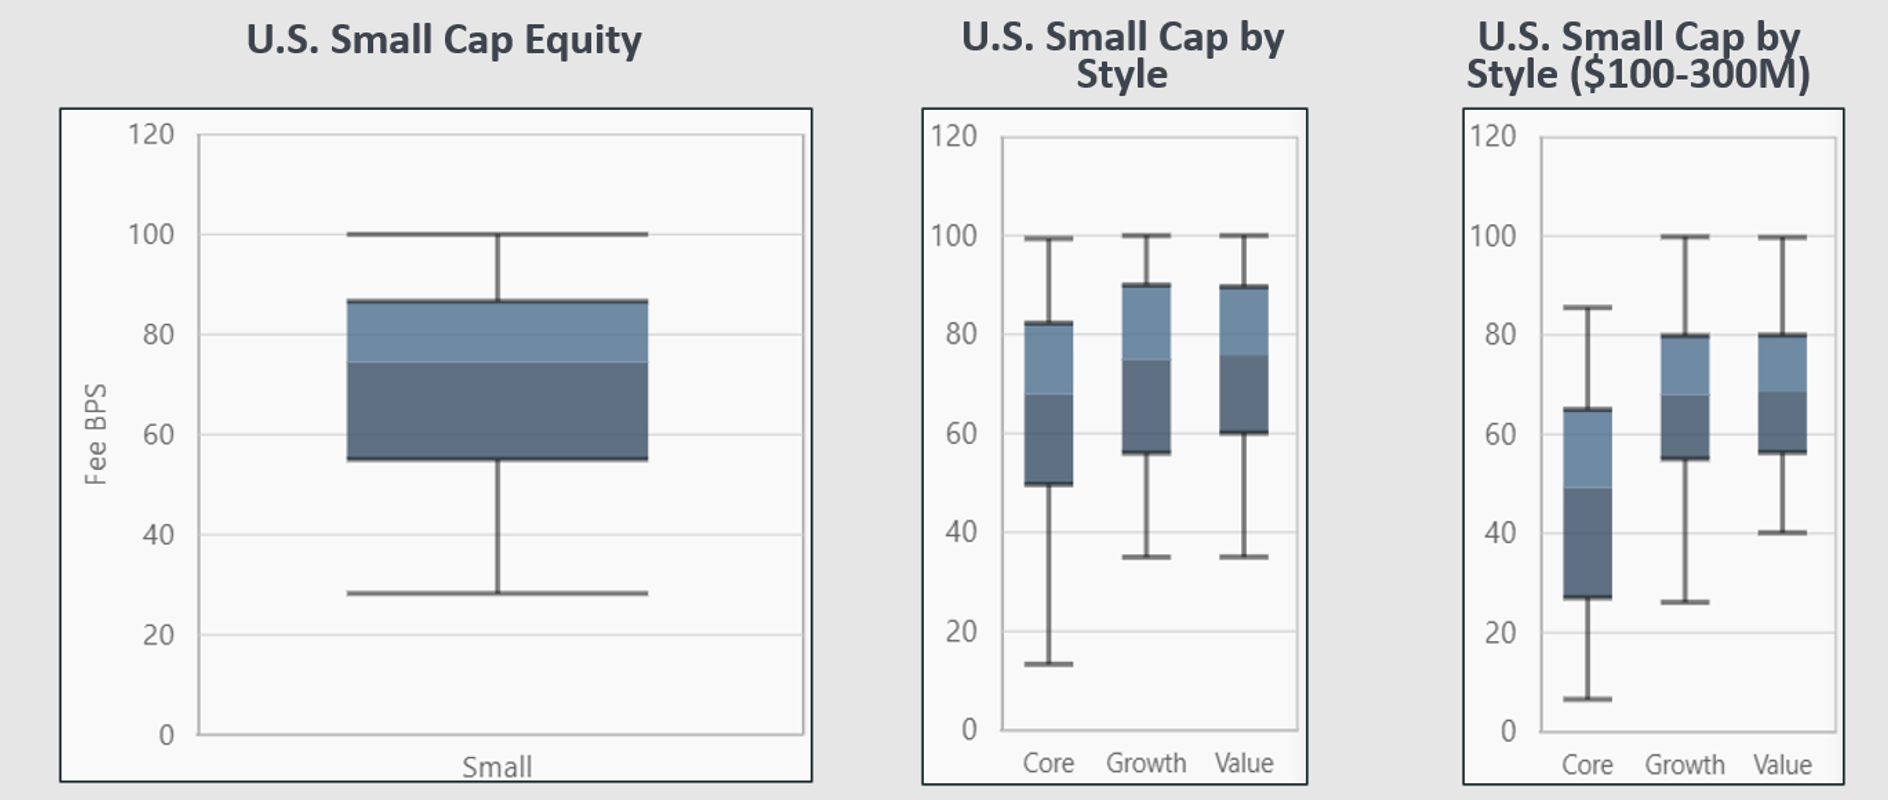
The median fee paid to active U.S. Small-Cap equity managers (all plan types & mandate sizes) was 74 basis points, with a range from 29-100. The median within the Non-Profit space is slightly higher at 79.5 basis points. Unlike the Large-Cap space, there is no premium to pay for growth in Small-Cap (median 75 bps) compared to the value (median 76 bps). In fact, within the large mandates above $100m, there is a 7% discount for growth (median 63.15bps) compared to value (median 68.07bps).
Chart 9: Active U.S. Small-Cap equity post negotiated fee.
Source: PRISM Analytics
Style Analytics Factor Analysis
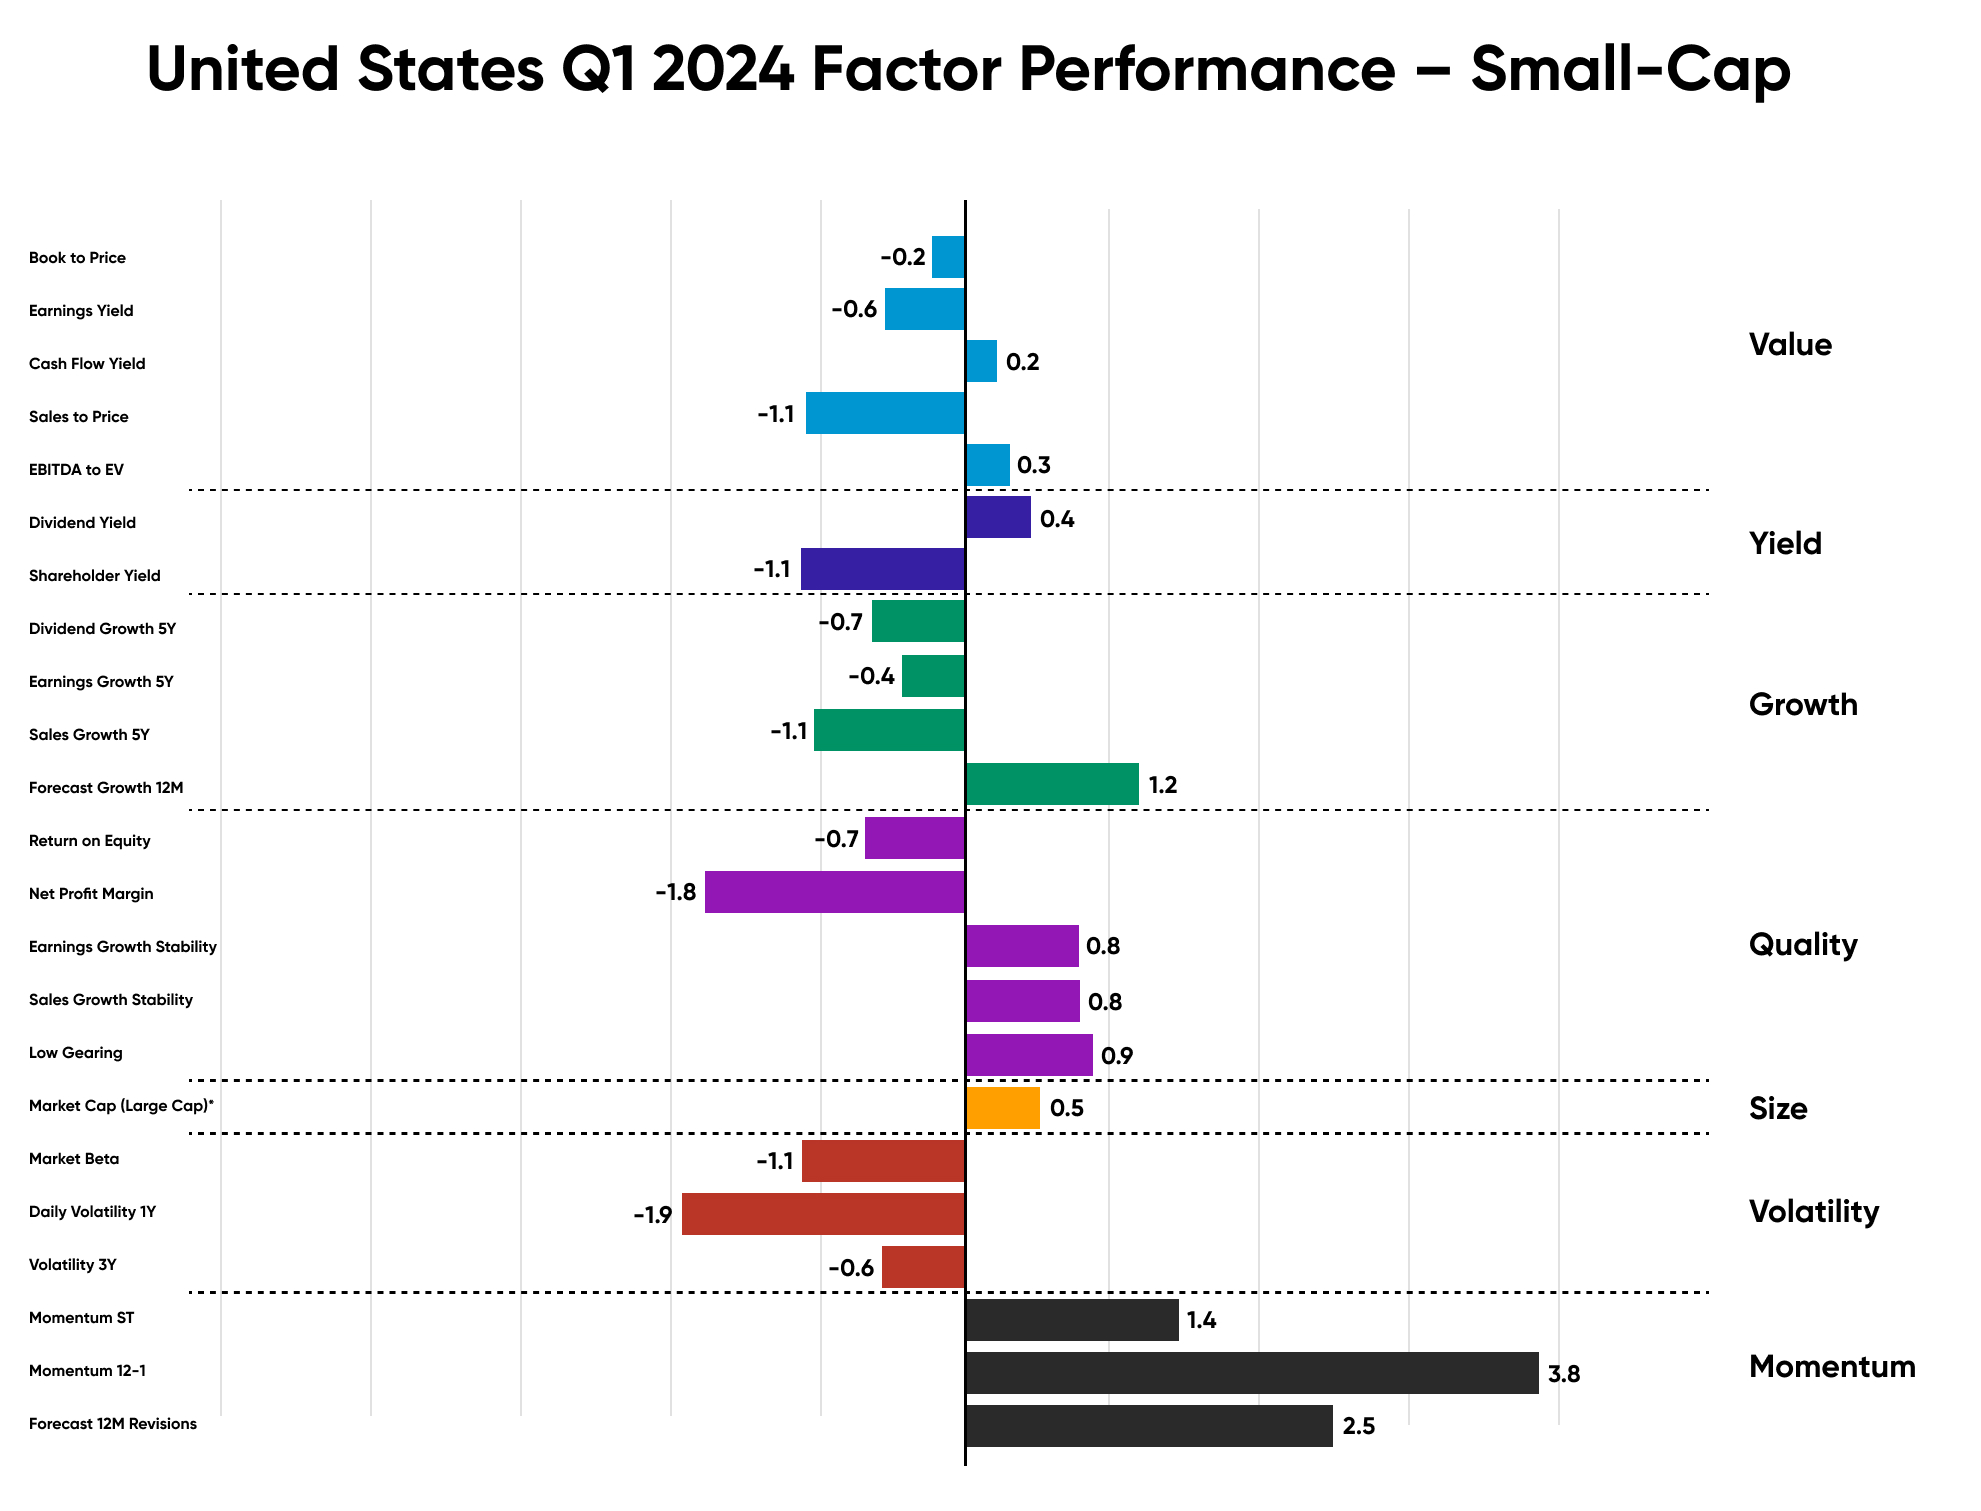
In the US Small-Cap equities market, a distinct trend diverged from that of Large-Caps. Although previous outperformers continued to do well, as captured by the 380 bps outperformance of Momentum 12-1, stocks with strong historical earnings and sales growth, as well as volatile stocks, lagged behind by up to 190 bps relative to US Small-Caps.
In Q1, US Small-Caps prioritized stability over volatility and growth, contrasting with Large-Cap trends. Value and Yield showed neutrality, with no notable over/underperformance. Although growth metrics lagged the market, stocks with promising forecasted annual earnings growth did outperform by 120 bps. However, stocks emphasizing stability-based Quality subfactors like earnings growth stability, sales growth stability, and low gearing delivered 80bps of outperformance, contrasted with the underperformance observed in volatile Small-Cap companies.
Chart 10: United States Q1 2024 Factor Performance – Small-Cap.
Source: Style Analytics, a Confluence company
Style Analytics Factor Analysis
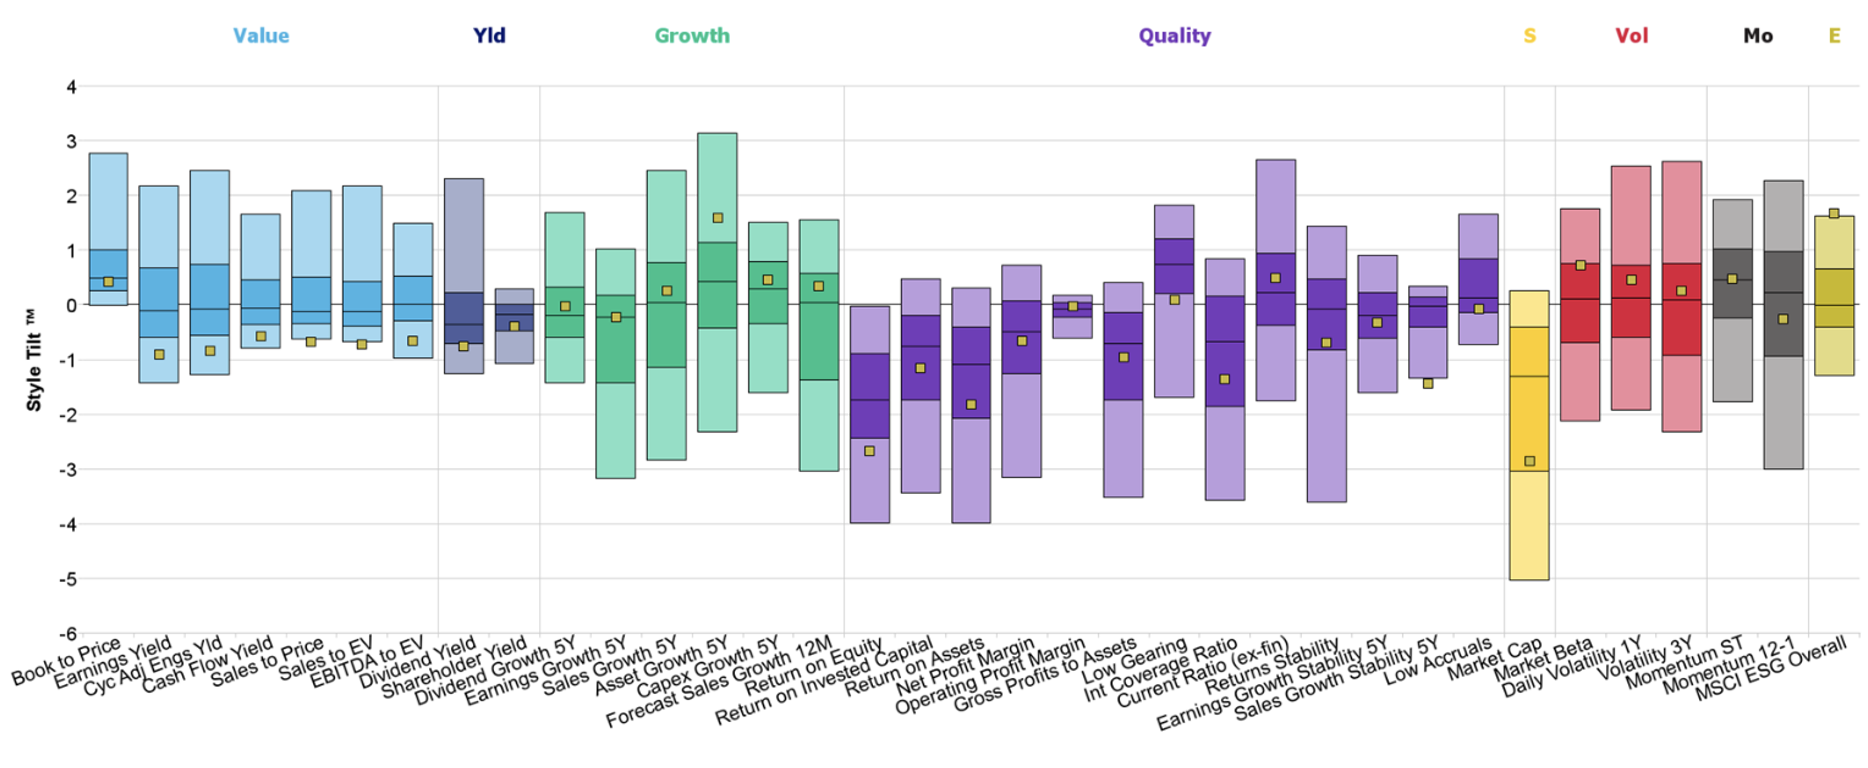
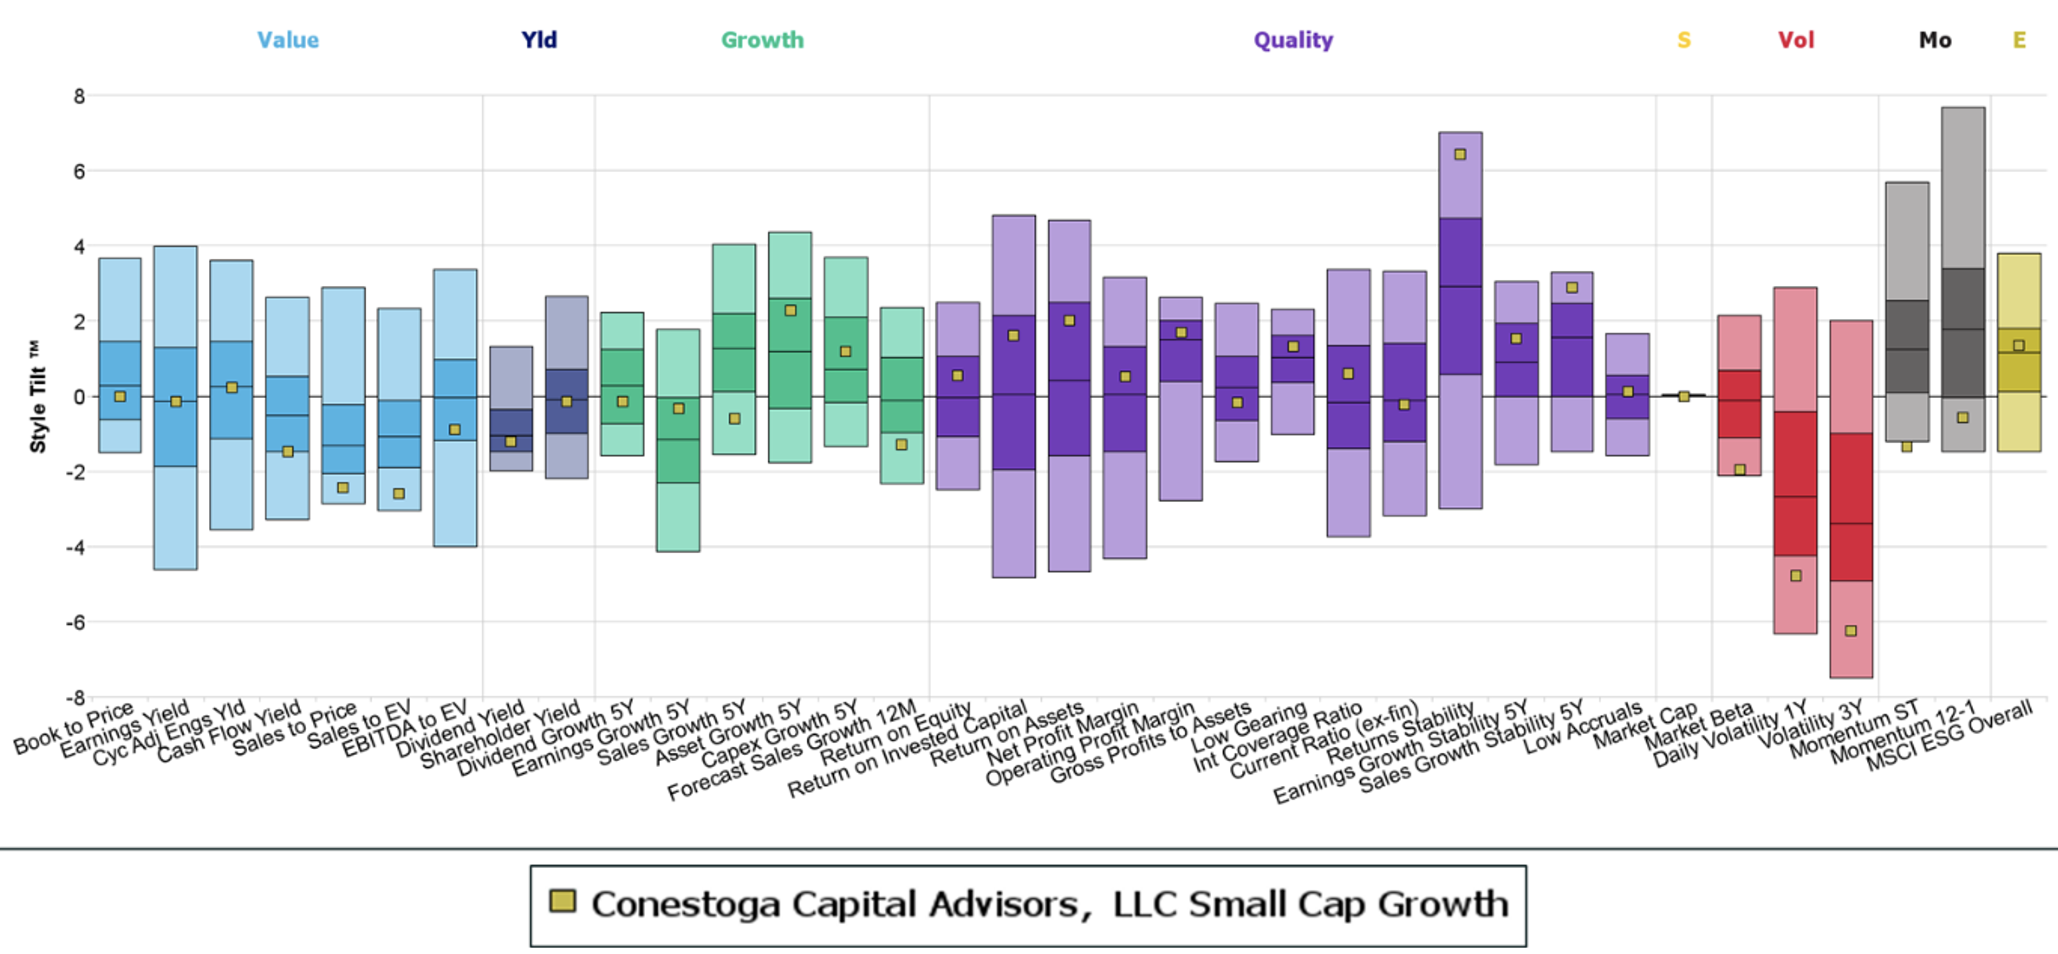
Conestoga Capital Advisors led this quarter with 48 mandates and $41 million in net inflows. Using Style Analytics Peer Insights, we assessed how Conestoga’s Small-Cap Growth fund’s factor exposures aligned with the aforementioned performance trends, distinguishing it from other managers in the category.
Conestoga focuses on high-quality growth companies, emphasizing high asset and capital expenditure growth over five years, along with lower volatility and a high return on assets. They rank in the top quartile of the US Small-Cap Growth peer group for stable returns and the bottom quartile for volatility subfactors. Additionally, their fund exhibits top-quartile exposure to five-year sales growth stability, a subfactor that outperformed by 80bps in Q1.
Chart 11: Active U.S. Small-Cap Growth Equity Winner – Style.
Source: Style Analytics, a Confluence company
Disclaimer
The information contained in this communication is for informational purposes only. Investment Metrics, a Confluence company, is not providing legal, financial, accounting, compliance or other similar services or advice through this communication. Recipients of this communication are responsible for understanding the regulatory and legal requirements applicable to their business.
In this article:
About Confluence
Confluence is a global leader in enterprise data and software solutions for regulatory, analytics, and investor communications. Our best-of-breed solutions make it easy and fast to create, share, and operationalize mission-critical reporting and actionable insights essential to the investment management industry. Trusted for over 30 years by the largest asset service providers, asset managers, asset owners, and investment consultants worldwide, our global team of regulatory and analytics experts delivers forward-looking innovations and market-leading solutions, adding efficiency, speed, and accuracy to everything we do. Headquartered in Pittsburgh, PA, with 800+ employees across North America, the United Kingdom, Europe, South Africa, and Australia, Confluence services over 1,000 clients in more than 40 countries. For more information, visit www.confluence.com
