The market activity in the fixed income sector has been very interesting over the past month.
The media has been very keen to declare that the 30 year bull market in bonds is over, that the Fed’s Quantitative easing program is over and that the markets are undergoing a profound change.
The fixed income market which is directly valued by interest rates, inflation and credit ratings among other things has been most noticeably affected by the recent statements by Dr. Bernanke of the US Federal reserve. On June 20th, the Chairman’s speech seemed to suggest that the Fed would be ending its policy of low interest rates (sustained by huge purchases of treasuries and encouraging stimulus spending). The reaction was immediate and it was not just the US market, as all global markets fell noticeably.
The market’s expectation that interest rates were going to rise, put downward pressure on prices and the free fall was on. Of course, the last thing the Fed wants is for markets to misinterpret its intentions and so on July 10th, the minutes from the Fed’s meeting clarified that until the US economy was in growth mode and the Fed would continue with its current policies. The markets responded very well to this news and a recent positive jobs report also added to the recent positive market movements.
I thought it would be interesting to look at what StatPro Revolution would have told us about this period of volatility in the markets, so, I logged on and took a look at a North American Fixed Income fund.
This fund is made up of Canadian, Mexican and US government and corporate bonds. These are plain vanilla bonds for the most part. The fund does not have a currency overlay strategy (via forwards), derivatives or any other complicated investment strategy. The fund is set up to classify the holdings by country and then maturity. I’ve put in a custom time period of June 17th (the Monday prior to the Fed’s first announcement) to July 11th. There was no trading in the fund during this time period. Note: StatPro Revolution calculates its analysis based on the previous day’s prices.
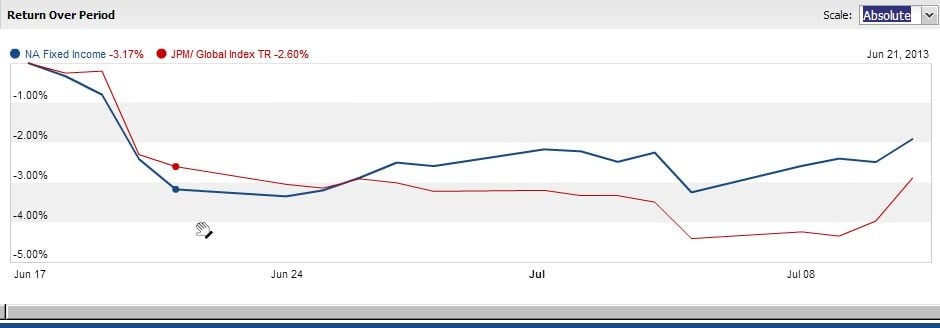
The first chart to look at is the Table 1 line graph, which clearly shows that in the days after the bad news from the Fed, the portfolio saw a very sudden drop. It is important to note that these vanilla bond portfolios are supposed to be fairly stable with not a lot of price movement, but to see that the value of the fund is dropping by 100s of basis points is cause for concern. And, for the analysis period, we saw a total drop of -3.17 for the fund (see the blue line). Clearly, we need to do a deeper dive into the analysis to determine what caused this drop.
Table 1: click to enlarge
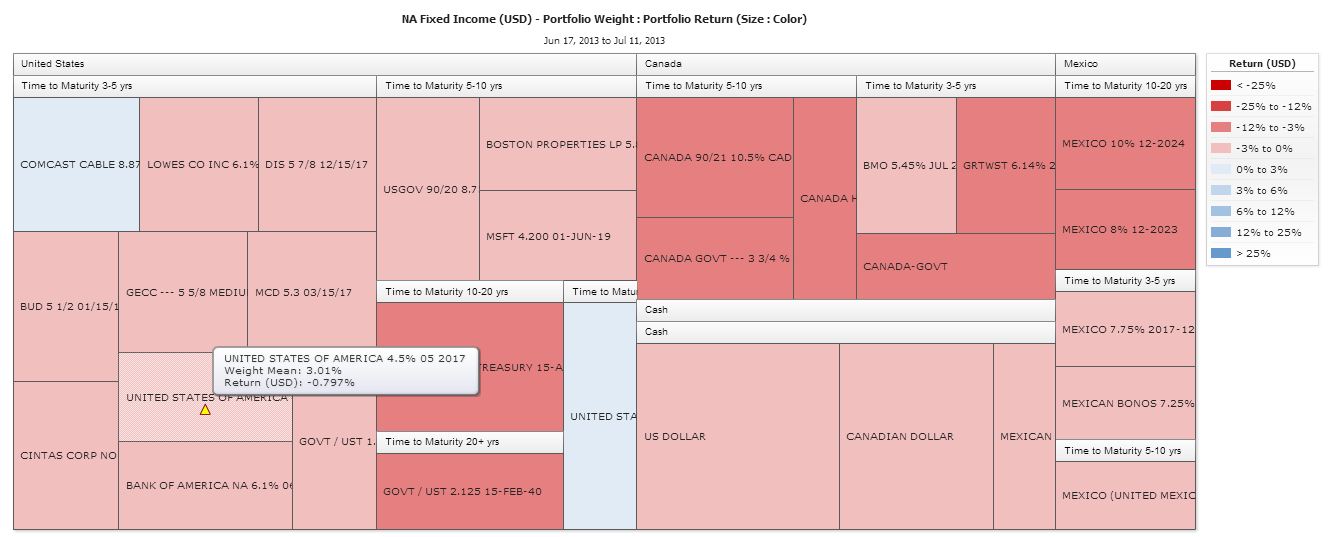
So, the next chart to look at in StatPro Revolution is a performance heat map. I chose this chart since I really wanted to see if a particular position or weight caused the drop. Table 2 shows the weight (i.e the size of the rectangle) and the return (i.e. the color) of each position in the fund. As we see a serious amount of red in this chart and the size of the positions fairly uniform (i.e. there is not one monster position that brought down the performance), it is safe to assume that not country or duration (time to maturity) was spared in this time series. Therefore, we can move forward in the analysis to see exactly why these bonds all reacted so poorly.
Table 2: click to enlarge
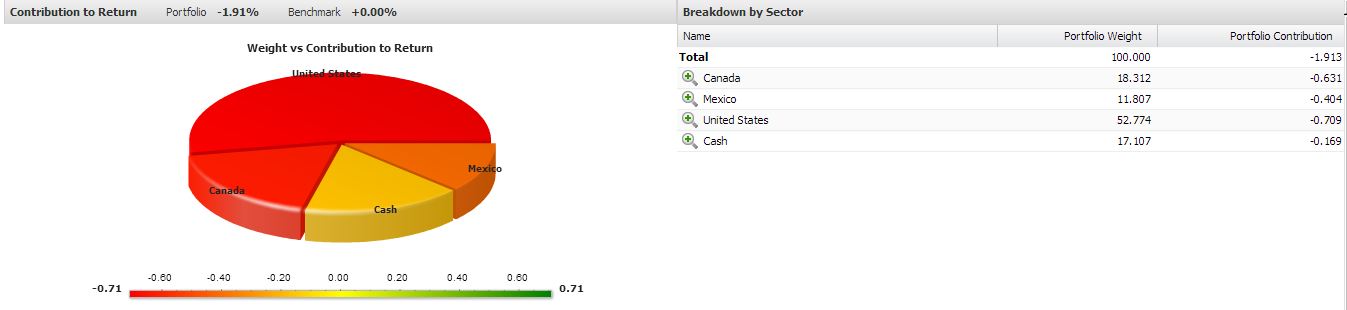
I then navigated over to the contribution analysis, as I wanted to see if a particular country had a more significant impact on the negative results. Table 3 shows that each country contributed to the negative results and so we can assume that there is a decent amount of correlation between the three countries. This is not a surprise as Canada is the top trading partner with the US market and Mexico is not far behind.
Table 3: click to enlarge
The last two charts that I am going to look at are from the results of the yield curve attribution analysis. StatPro Revolution has an excellent capability to perform yield curve decomposition which allows the user to see exactly how the changes in the yield curve (i.e. shift, slope and curvature changes) affects the performance of the bonds in the fund. Basically, I want to see if the fund responded to the changes in interest rate outlook, caused by the Fed announcements, in a predictable way. In this case, the expectation is that the higher interest rates sent prices down.
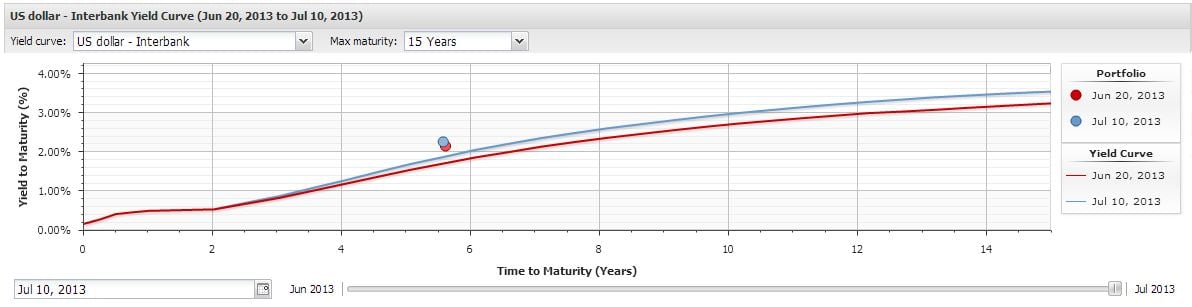
In StatPro Revolution, a user is able to select a yield curve to use as a reference for their analysis. In Table 4 we can see that there are two line graphs plotted. The red line shows the US Dollar Interbank rate curve on June 20th and the blue line shows the same curve for July 11th. A chart technician would notice that the curves are of the same shape but there is a noticeable shift upward, towards the long end of the curve. This is best described as a parallel shift. So, now that we know the general movement of the curve, let’s use StatPro Revolution’s ability to break down exactly how the fund was impacted by the shift. One other point is that the fixed income market typically does not see such big movement in a curve over the course of 15 trading days. This is why the reaction was so severe in the markets and we had the across the board decline in prices.
Table 4: click to enlarge
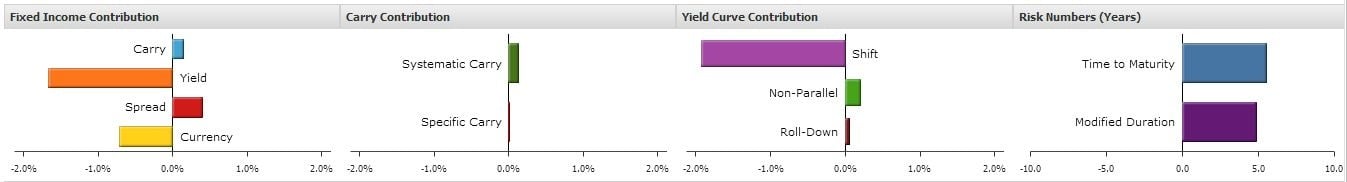
In Table 5, we see a series of horizontal bar charts. The first horizontal bar chart shows that indeed the effect of the yield curve movement was the main culprit (see the orange bar series), along with currency impact in the resulting losses in the fund during this period. There was a slight positive return from the carry contribution (i.e. coupons accruing) but this is to be expected. The third horizontal bar chart is showing that the parallel shift of the yield curve was the main aggressor in causing the poor fund performance.
Table 5: click to enlarge
Finally, the impacts of the announcements from the Fed in the past month are evident in the poor fund performance that we see in our North American Fixed Income fund. StatPro Revolution has the functionality to allow a user to drill down and see exactly how the positions in the fund contributed to, or influenced the performance of the fund. StatPro Revolution is a powerful tool and it is easy to see how it would be immensely beneficial to the stakeholders (i.e. portfolio managers, compliance officers, risk managers, client facing employees and investment committees) involved in managing a similar fund. I really do not envy the asset managers who had to explain their fund’s performance during this period without such an easy to use tool. Or even worse, imagine the institutional investor who has to wait until the end of the month for a performance report about how their fund manager rode out the stormy markets. StatPro Revolution provides accurate, timely and in depth analysis…all at the click of a mouse.