This January release of StatPro Revolution brings with it some great functionality and insightful new dashboards. Here’s what’s new:
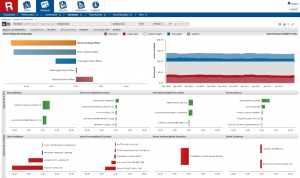
Stock-level equity attribution: Users now have a choice between existing top-down equity attribution or the recently introduced bottom-up, stock-level attribution. This insightful new dashboard will analyze your stock picking performance, and identify top and bottom 5 drivers for each of the stock-level attribution effects (exclusions, additions, over- and underweighting with respect to the benchmark).
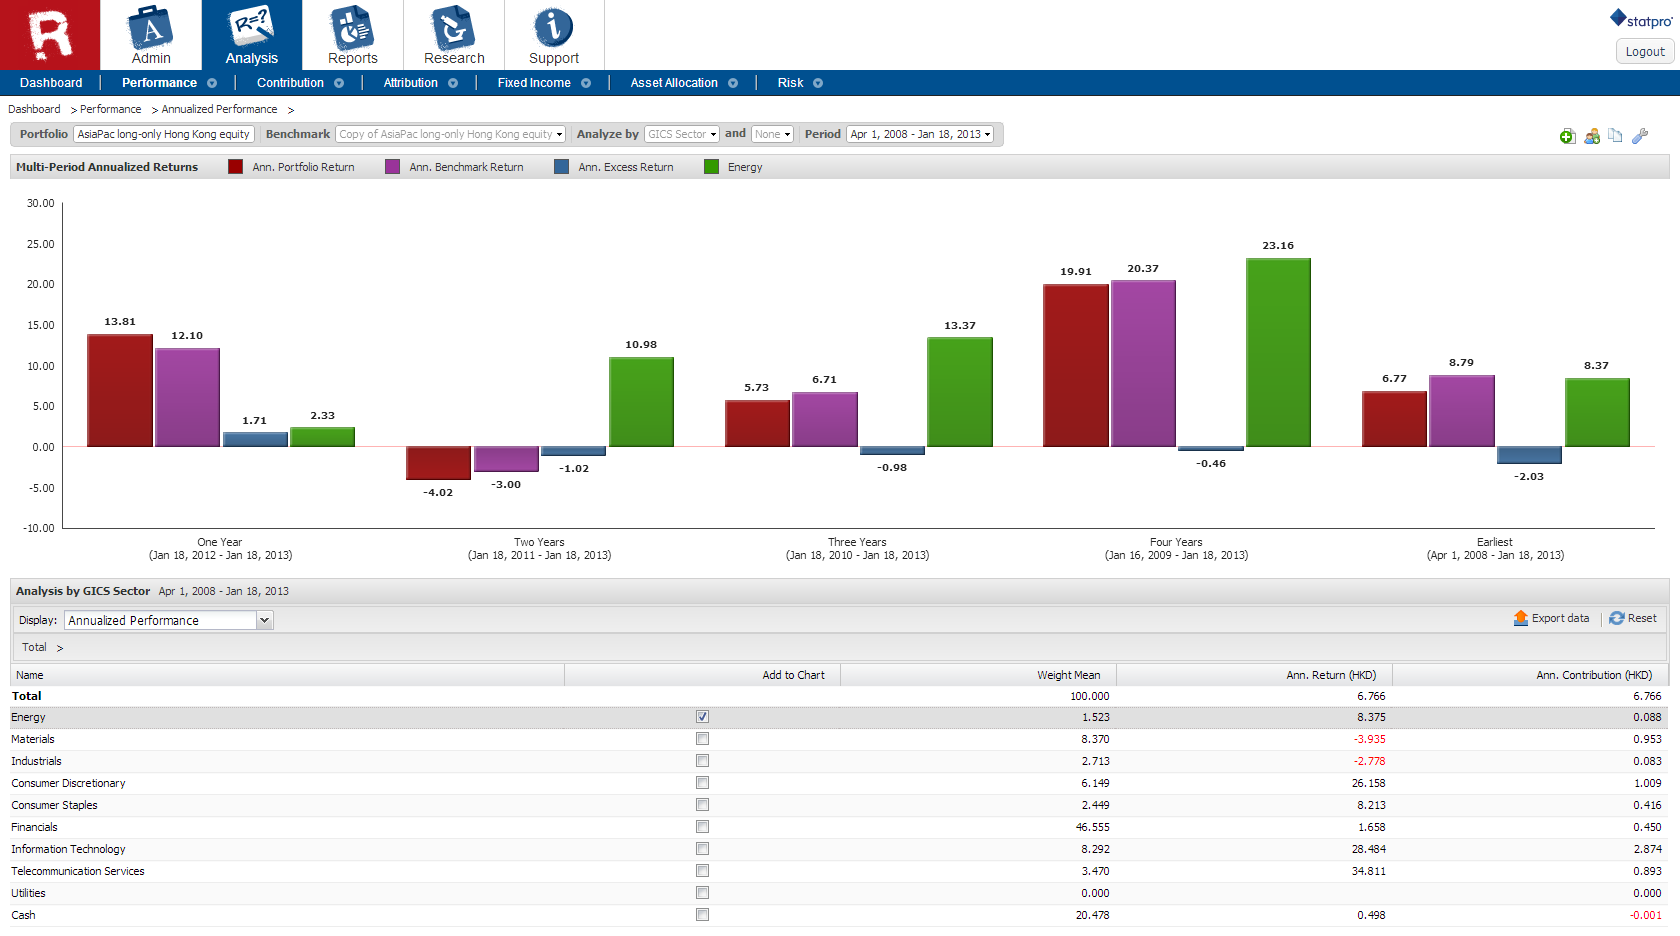
Annualized performance: You can now see annualized performance (both absolute and relative) for multiple time frames for portfolios with more than one year of history. The annualized graph lets you visualize annualized performance of selected portfolio segments, while the data table shows you detailed numbers for all segments. Annualized performance numbers can additionally be broken down into local and portfolio currency.
Read: New Insights for Asset Managers: How Technology Can Drive the Most Effective Middle Offices
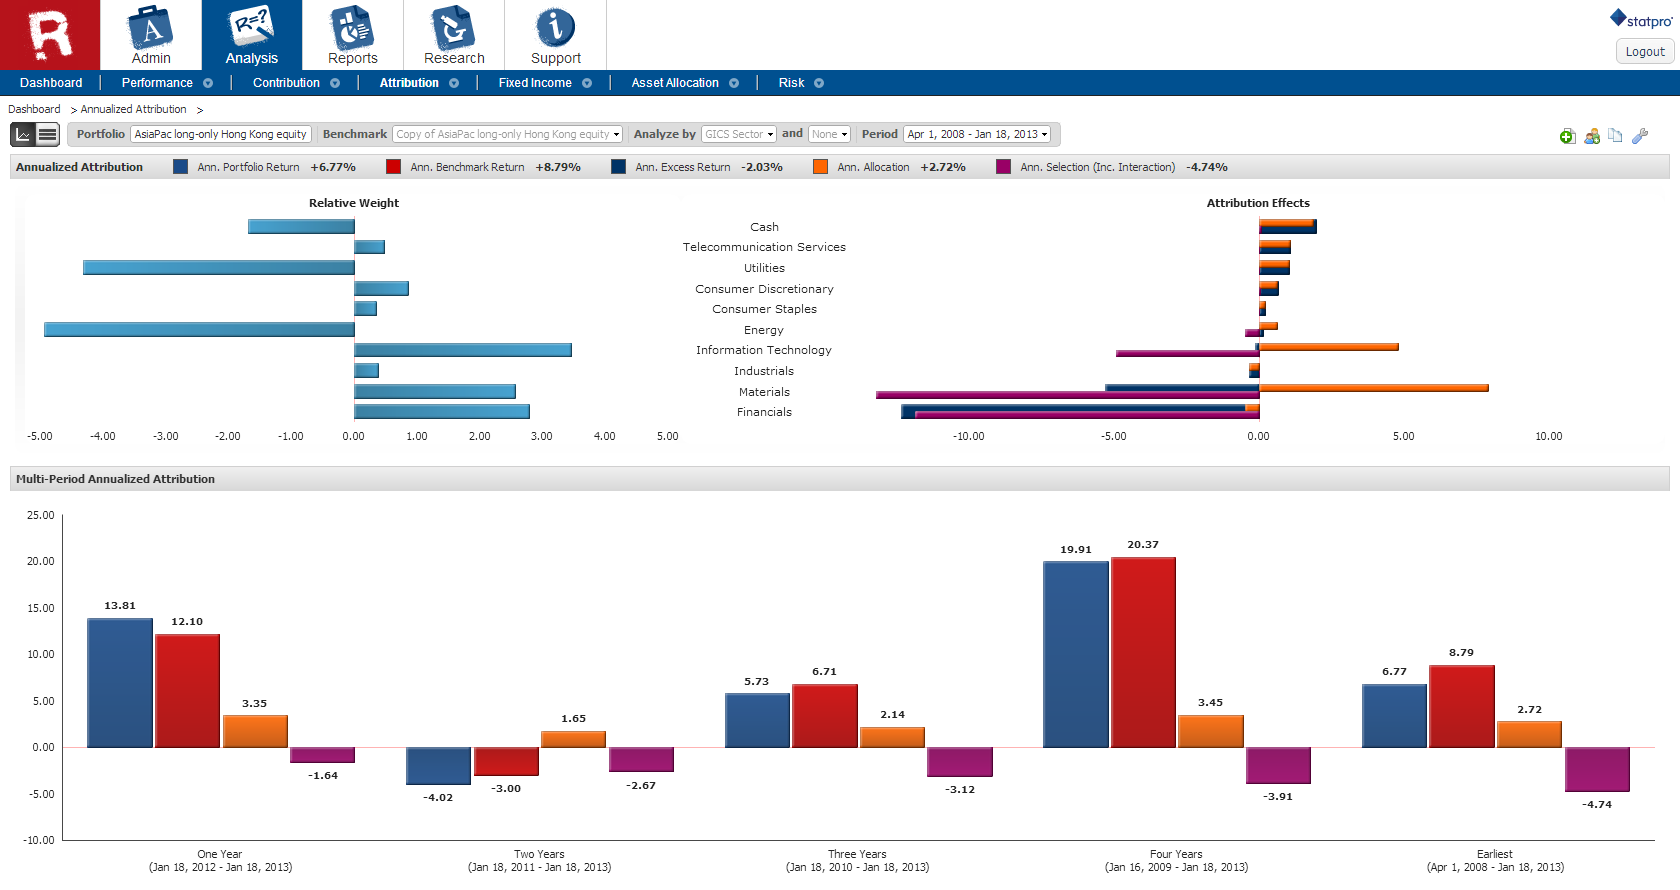
Annualized attribution: For portfolios with more than one year of history you can now see your top-down equity attribution annualized in a new dedicated dashboard. Portfolio contribution, benchmark return, allocation and selection can now be annualized for multiple time frames, with both arithmetic and geometric calculation models available.
Multi-portfolio analysis: The latest enhancements to the visual portfolio picker allow you to use it across analysis dashboards meaning you can see performance measures for multiple portfolios at the same time.
Log in now to see these new features.


