Q2 2024
Factor Performance Analysis
Quality Takes Forefront
by:
Market Background
The overall global economic activity remains relatively resilient, supported by declining inflation rates and growing private sector confidence. Despite these positive signs, rising geopolitical tensions are expected to impact economic dynamics, depending on the outcomes of global events.
Oil prices slightly increased to $86.76/barrel from the last quarter after dropping to $84/barrel in May. Bitcoin hit all-time highs in Q2, even as the market began decreasing expectations rate cut since the beginning of 2024. Finally, gold closed the quarter out at $2,382/TOz, after reaching a record high of $2,426/TOz in May.
Factor Summary
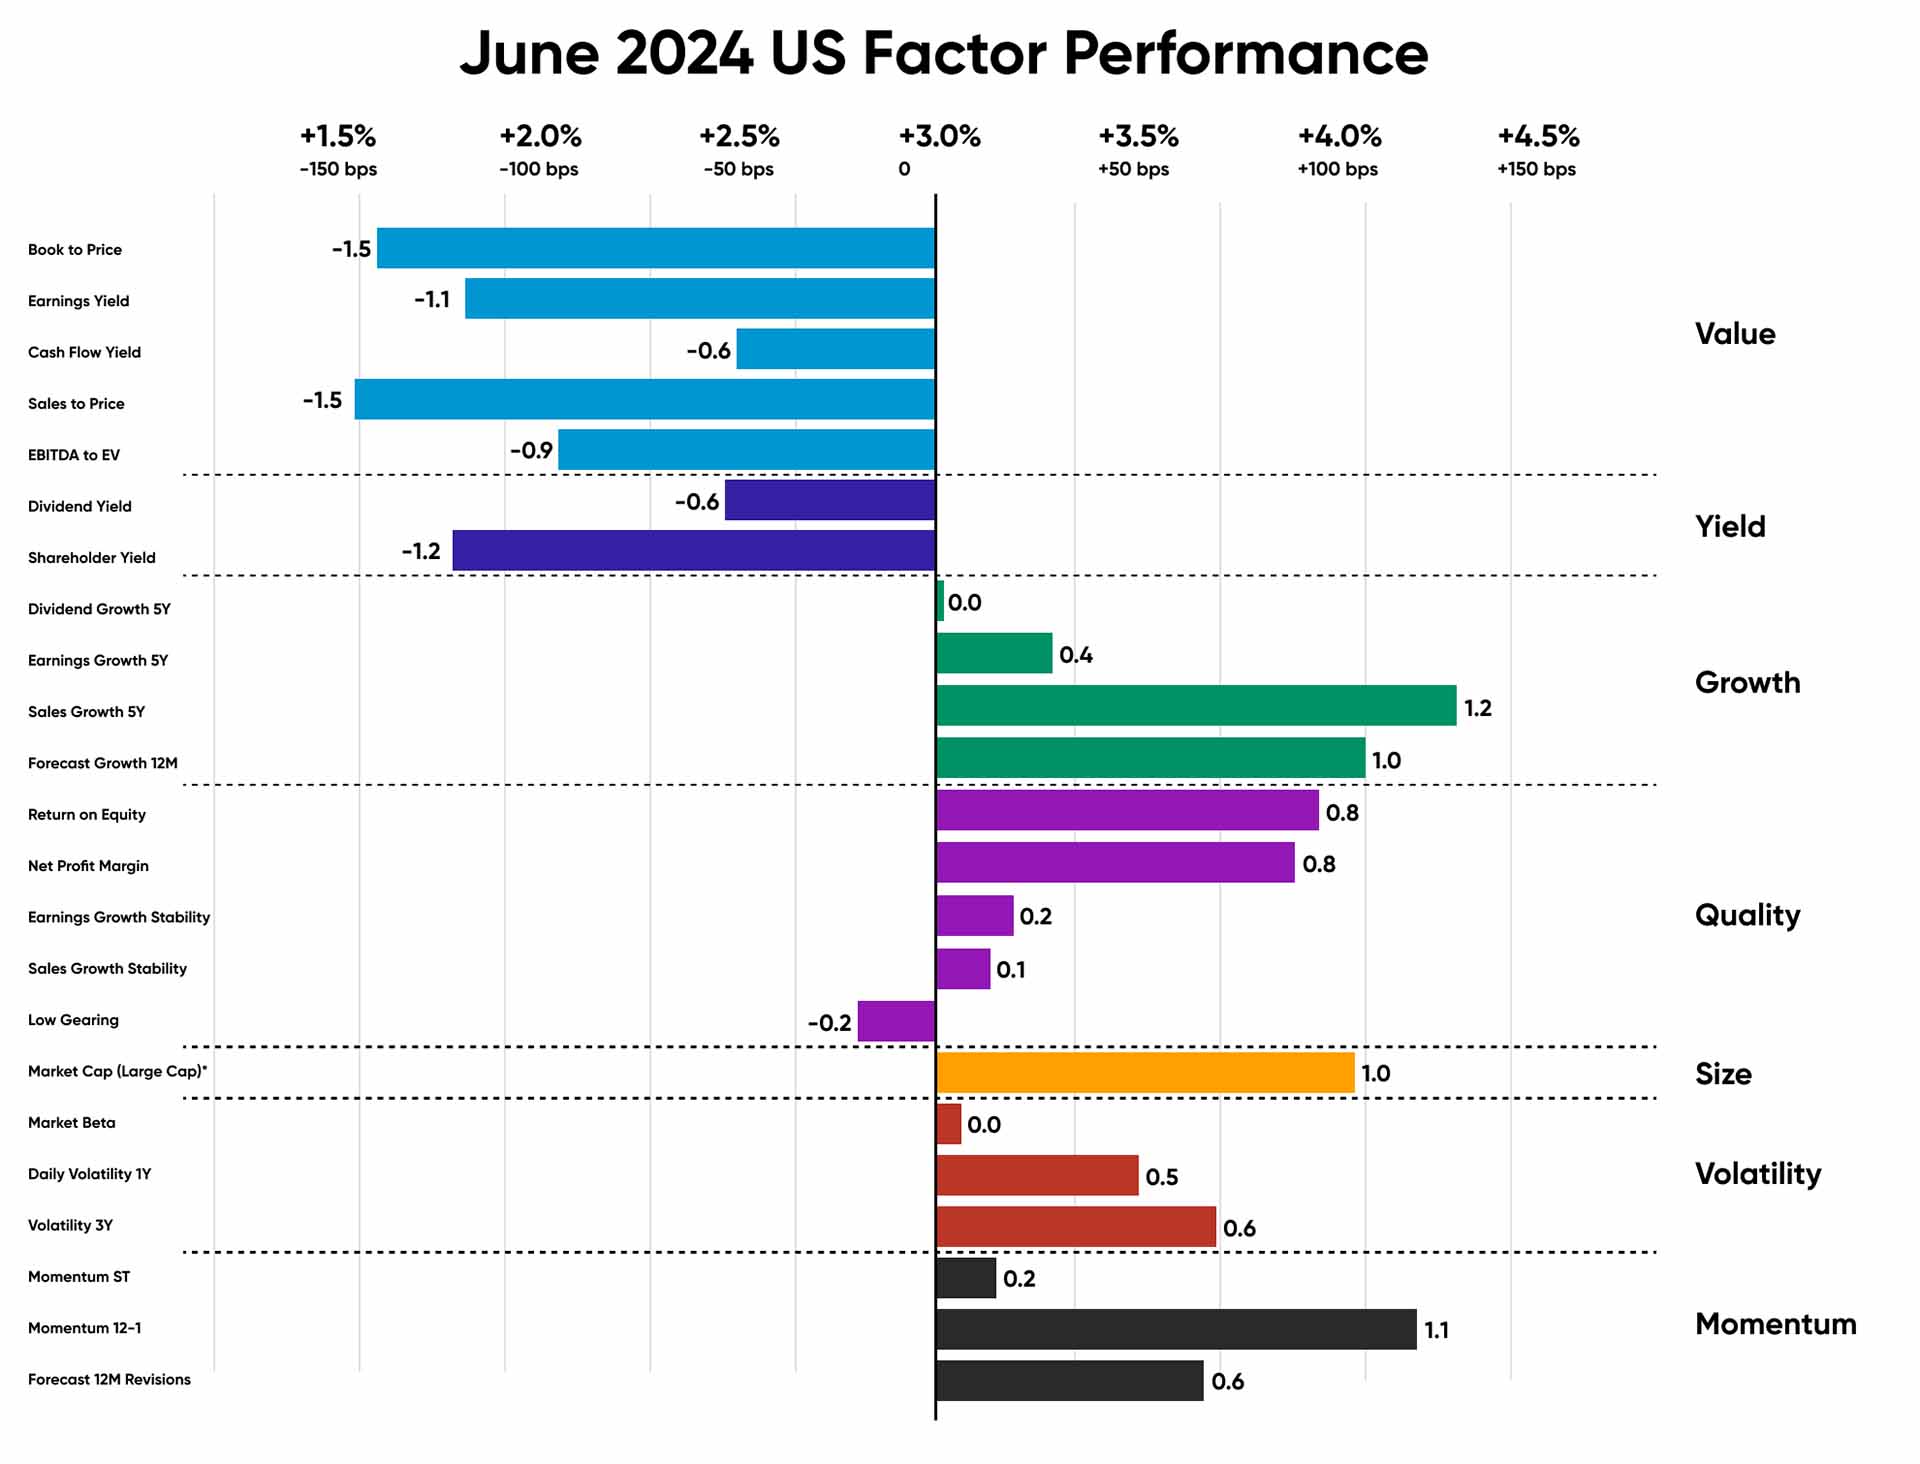
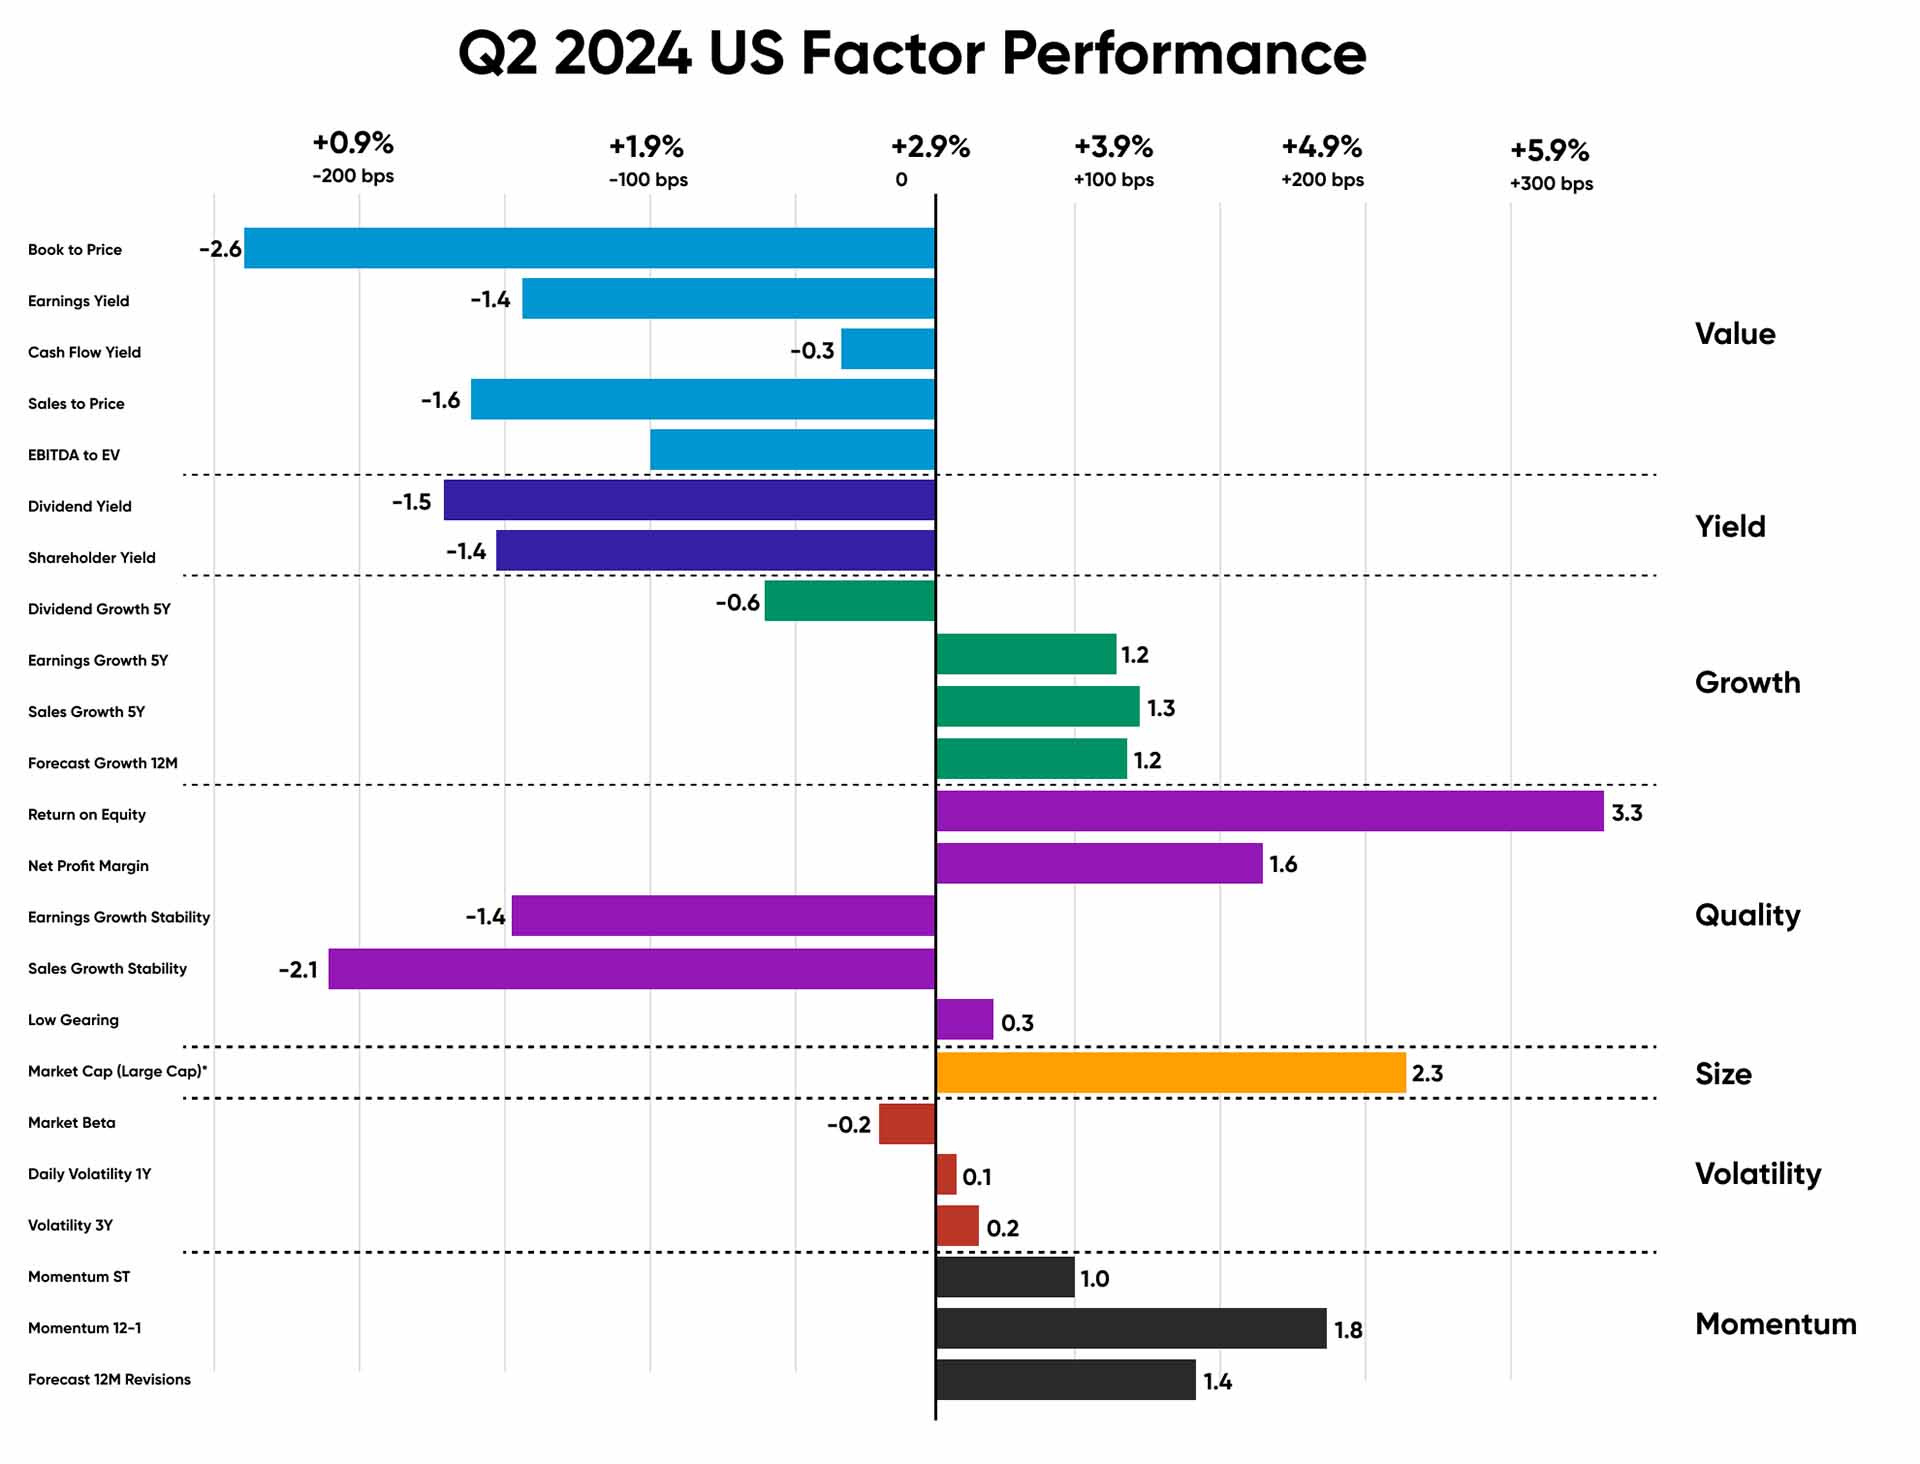
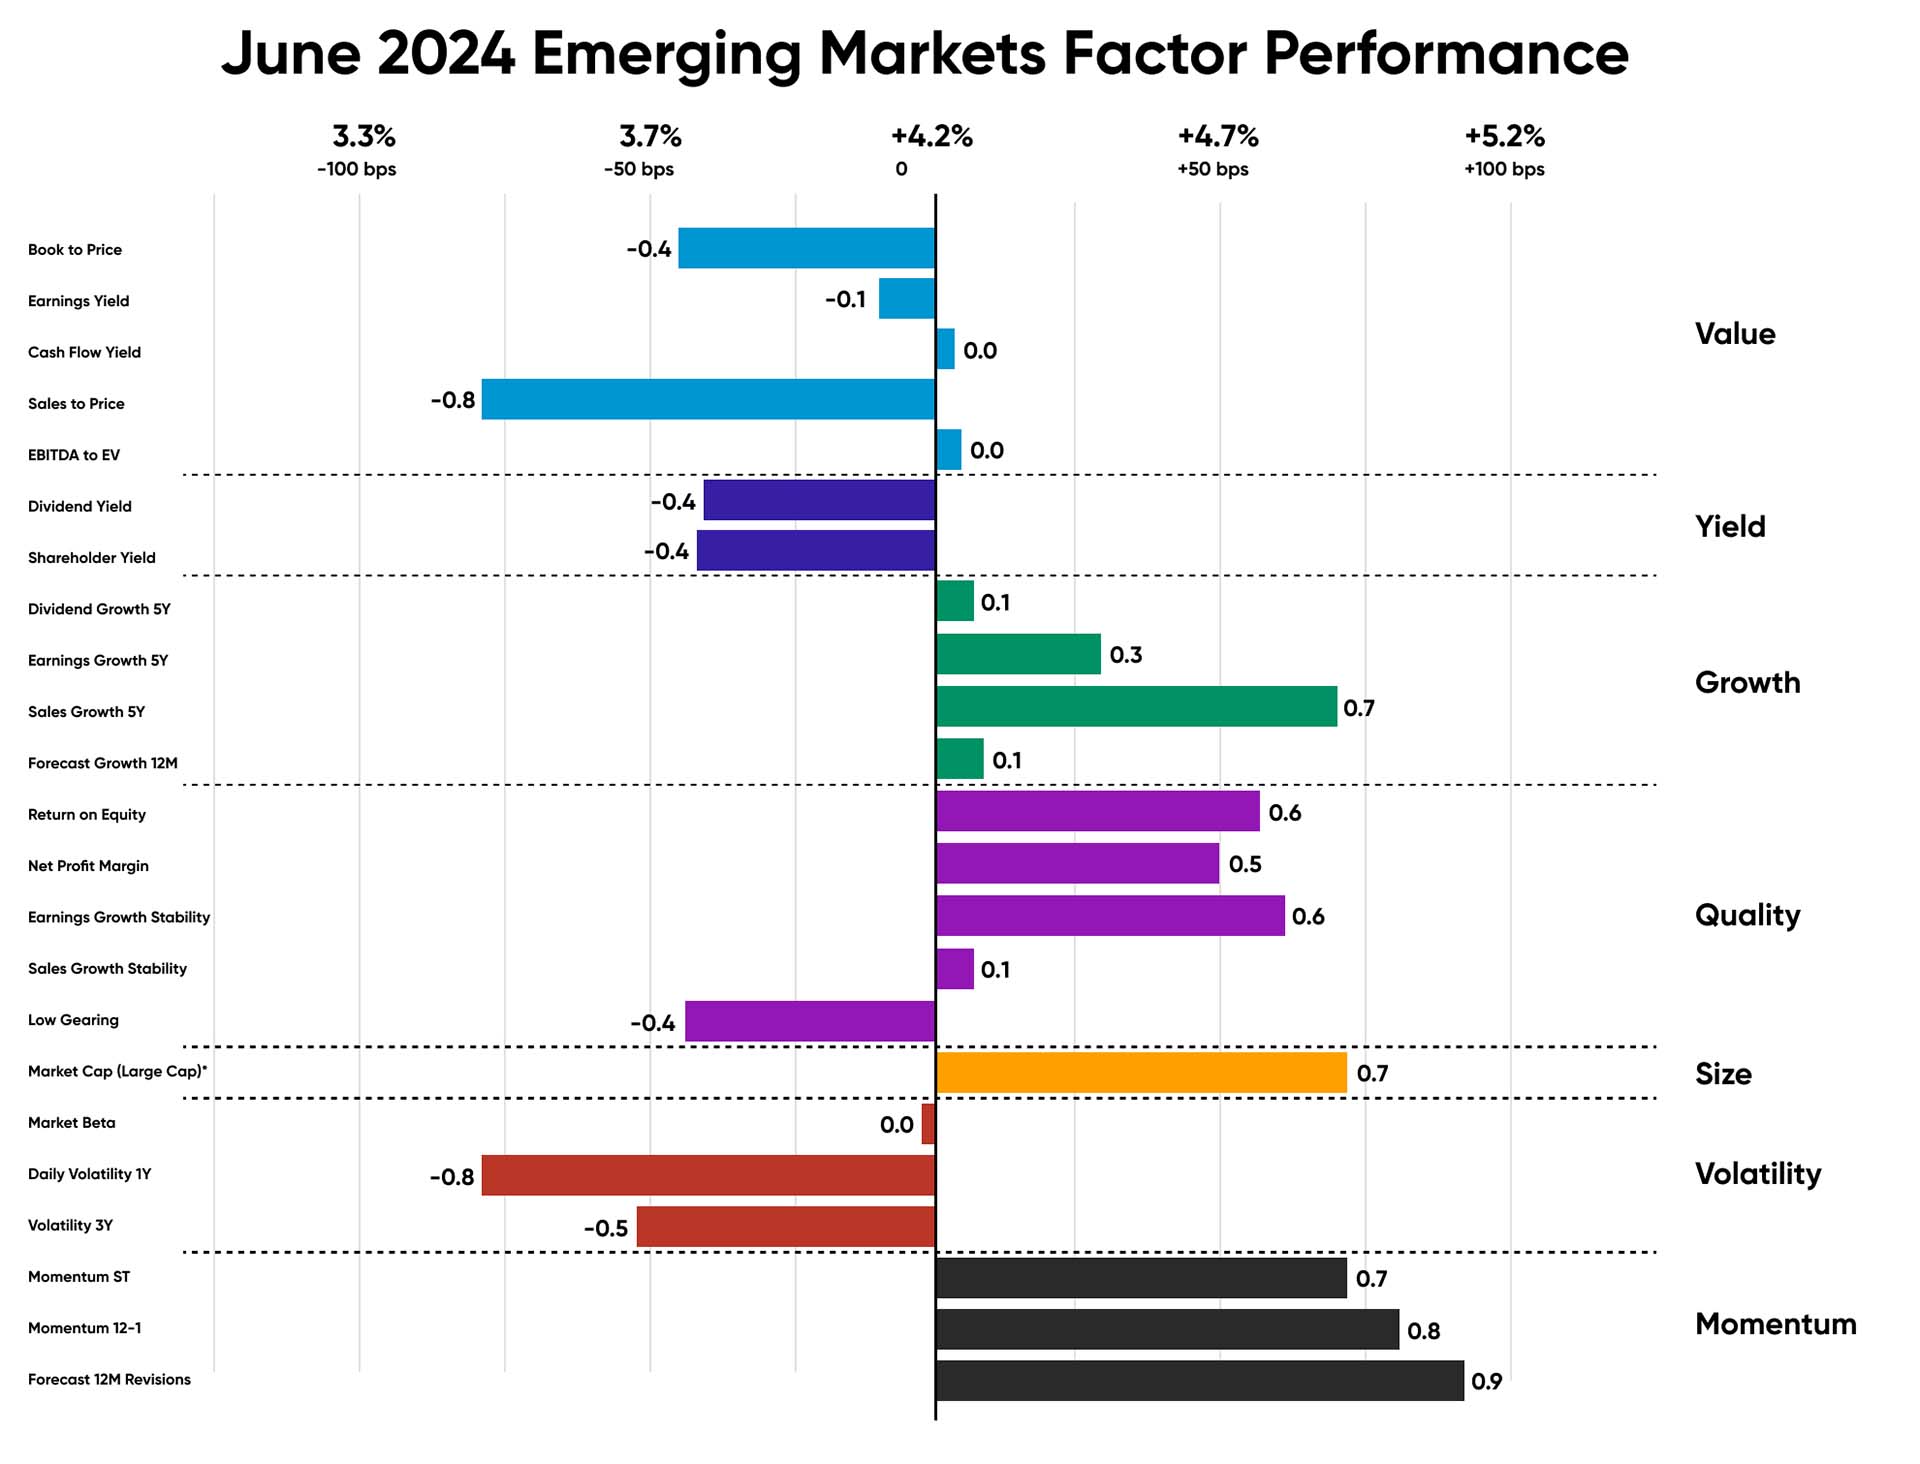
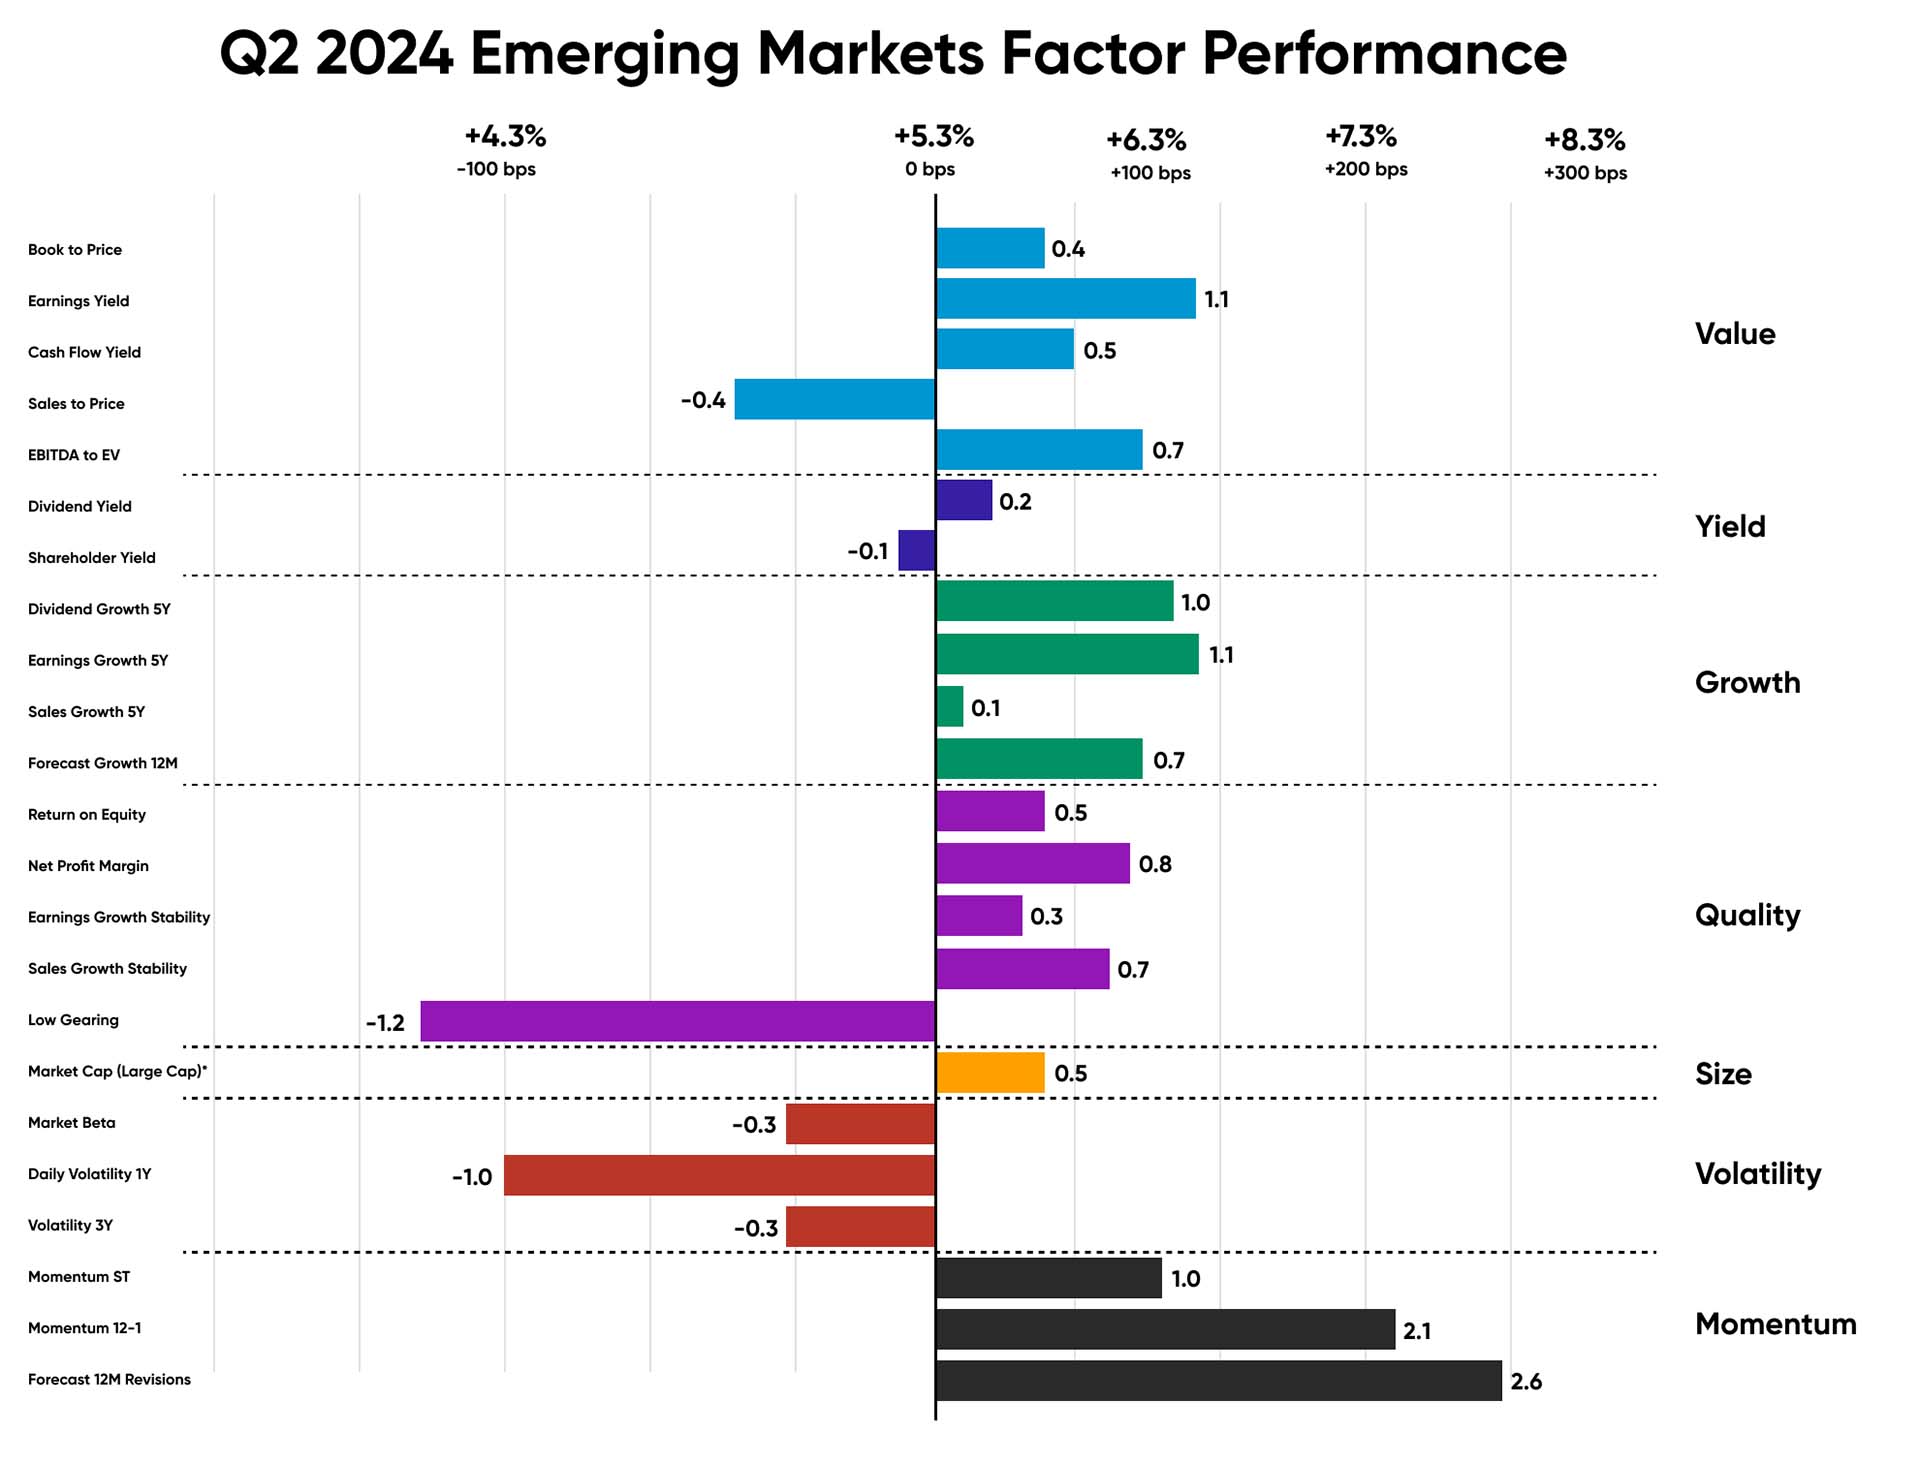
Figures 1 & 2: Regional relative factor performance (country and sector adjusted) for June ‘24 and Q2 ‘24. The arithmetic average of the subfactors’ relative market return for each factor category and region.
Source: Confluence
US Equities
The annual inflation rate in the United States was 3.3% for the 12 months ending in May, down from the previous rate of 3.4%. Gasoline and used car prices likely decreased, shelter costs moderated, while food prices probably increased slightly. Meanwhile, core inflation is expected to remain steady at 3.4%
Quality, exemplified by the return on equity subfactor, led the US market in Q2, driving nearly 330bps of relative performance, with an additional 80bps surge observed in June alone. Growth and Momentum stocks continued their market outperformance, with the “Momentum 12-1” subfactor surpassing market performance by almost 110bps during the quarter.
Source: Confluence
Source: Confluence
European Equities
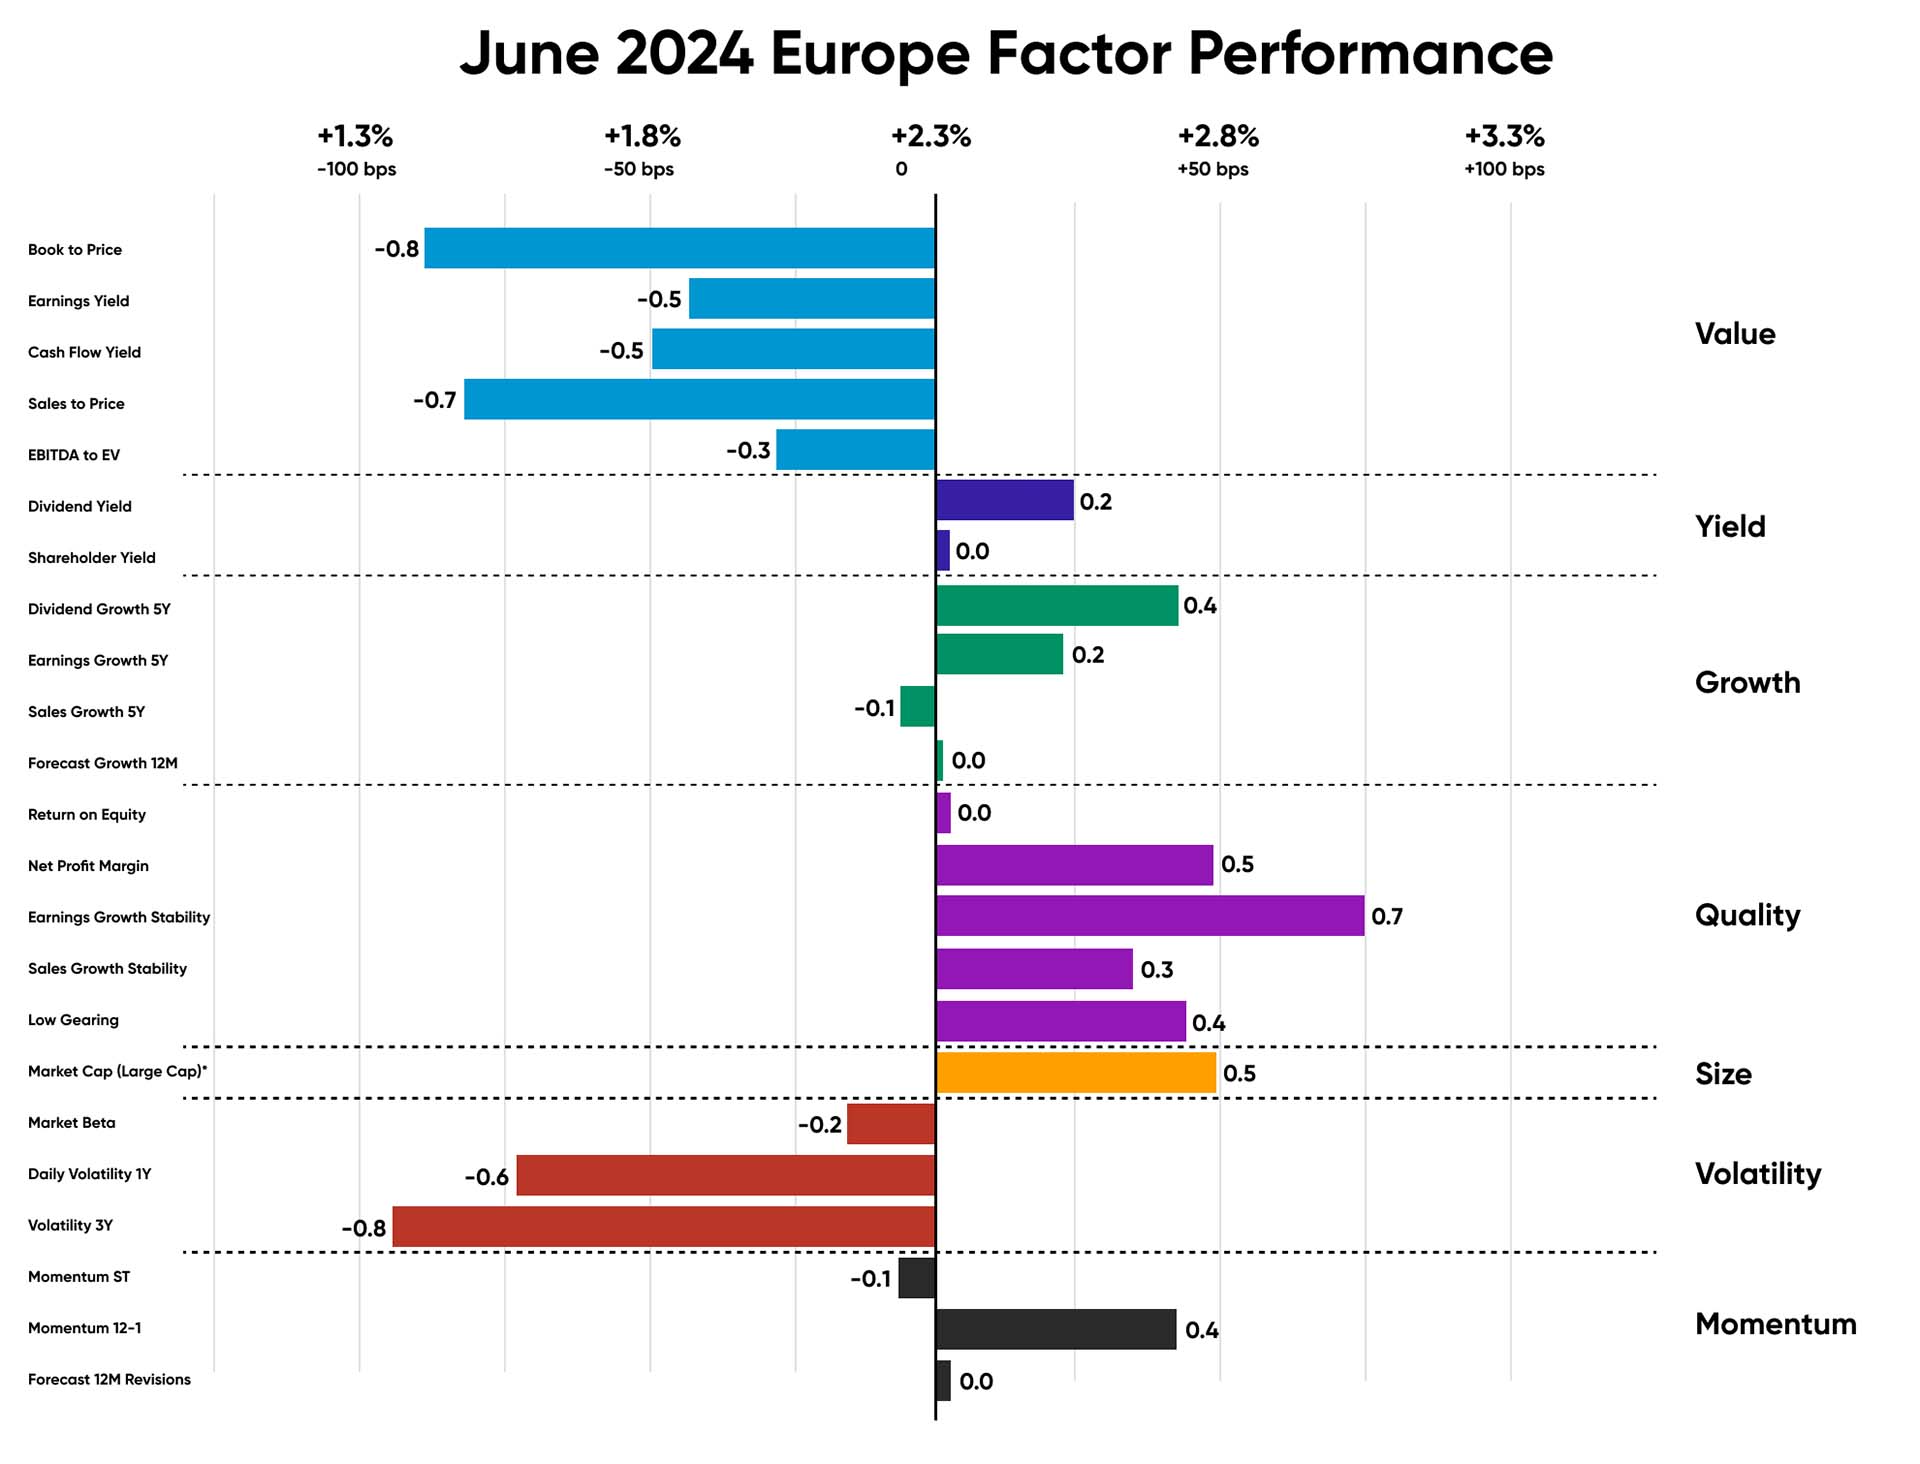
Following a brief rise in May, the Eurozone inflation in Q2 eased to 2.5% in June, meeting market expectations, with Belgium reaching a 10-month high, while Germany experienced a decline. The main components of the Euro area inflation services had the highest annual rate in June at 4.1%, remaining unchanged from May. This was followed by food, alcohol, and tobacco at 2.5%, slightly down from 2.6% in May, and energy at 0.2%, down from 0.3% in May. Notable outperformers with earnings growth stability include healthcare company UCB (+21% in Q2), French industrials company Schneider Electric SE (+8% in Q2), and financials company Tatra Banka AS (+12% in Q2).
Figure 5: June 2024 Europe Factor Performance (sector adjusted)
Source: Confluence
Figure 6: Q2 2024 Europe Factor Performance (country/sector adjusted)
Source: Confluence
UK Equities
The annual inflation rate in the UK slowed to 2% in May 2024, the lowest since July 2021. The Inflation was led by a slowdown in the cost of food (1.7%), and the cost of housing and utilities continued to decline to -4.8%.
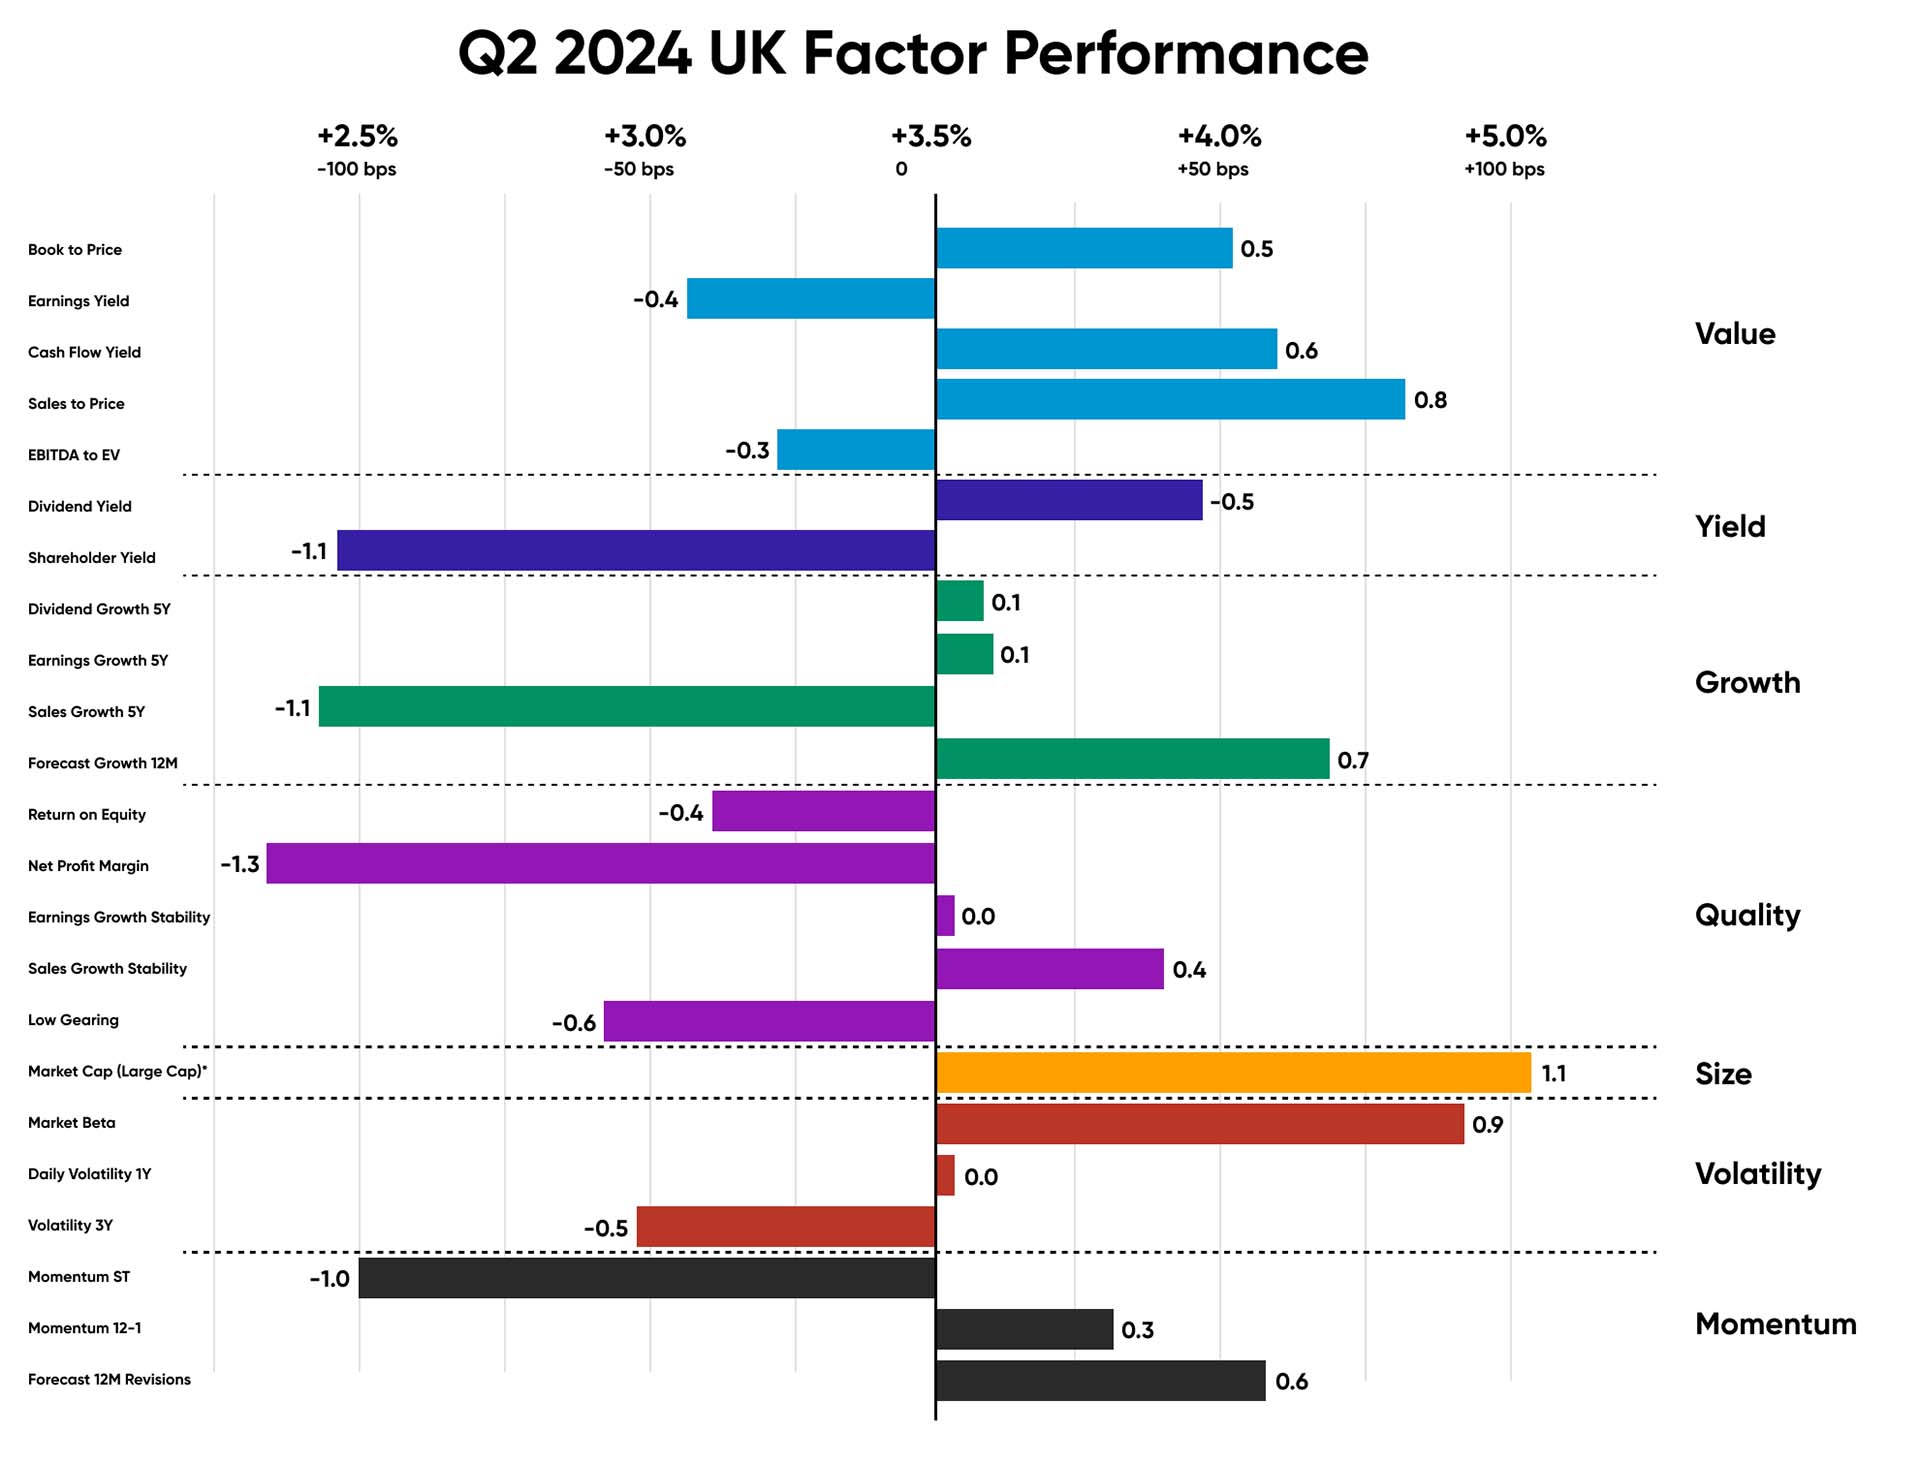
Like their European counterparts, June showed a distinct preference for Size and Quality stocks, particularly those with strong earnings growth stability, while the quarterly chart reflects strong outperformance in Size, by 110bps.
Quality equities from an Earnings Growth Stability perspective that helped Quality outperform in the region include financials company HSBC Holdings PLC (+15% in Q2); AstraZeneca PLC (+16% in Q2) and Anglo American PLC (+28% in Q2).
Source: Confluence
Source: Confluence
Emerging Market Equities
Source: Confluence
Source: Confluence
Canadian Equities
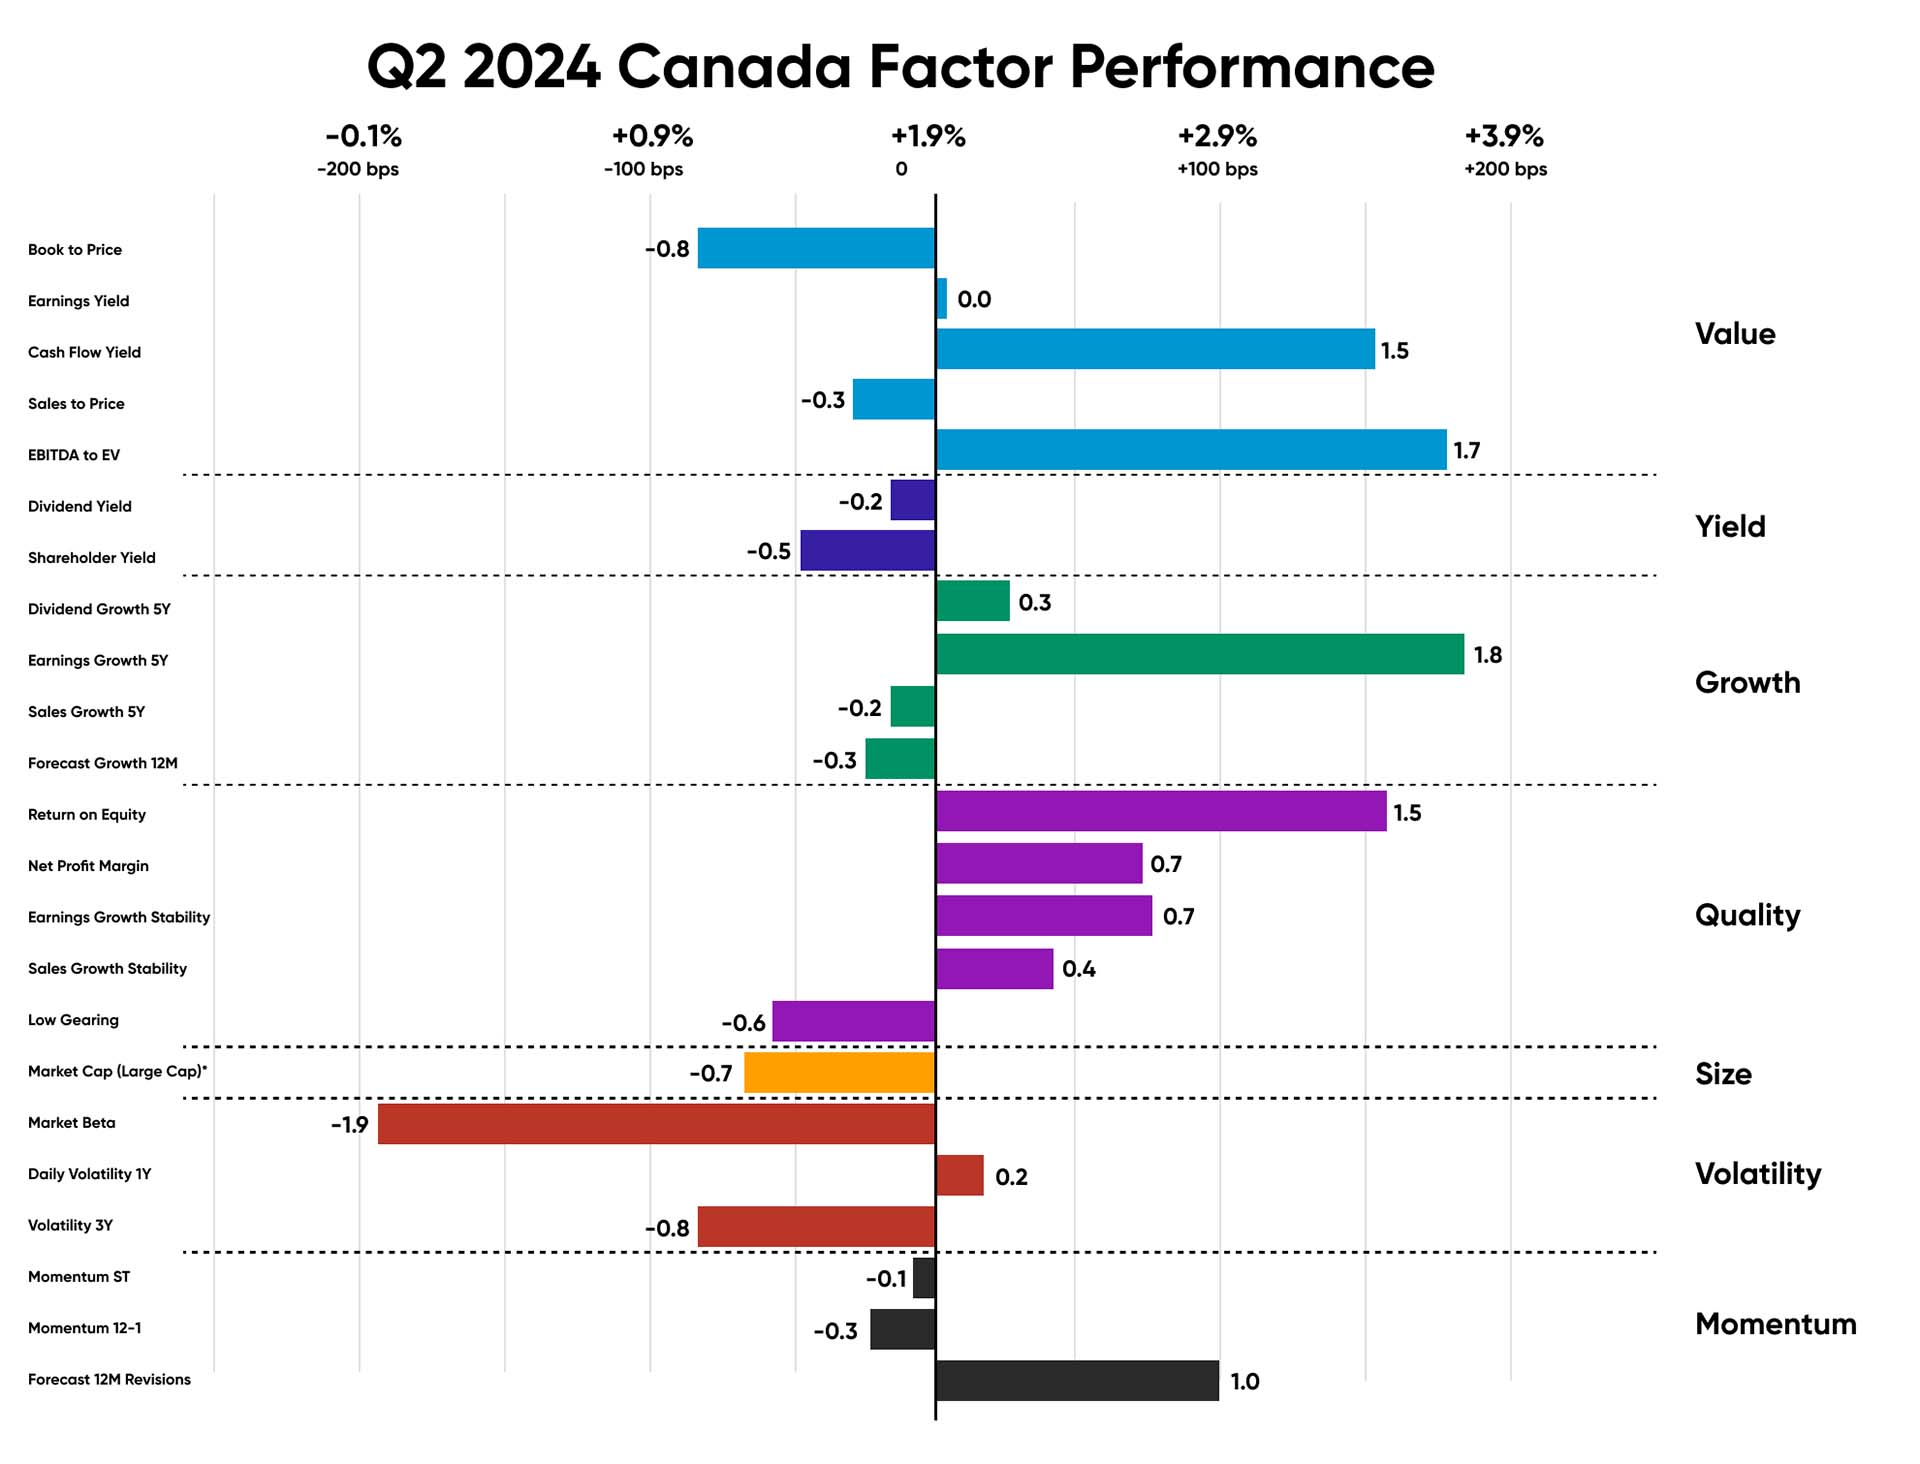
The annual inflation rate in Canada increased to 2.9% in May 2024, up from a three-year low of 2.7% in the previous month, defying market expectations of a slowdown to 2.6%. Inflation for food also rose, reaching 2.5%, driven by higher grocery costs, marking the first acceleration since June 2023.
The Quality stocks with a high ROE ratio that led Canadian markets in Q2 mainly include materials company Agnico (+11% in Q2); tech company Constellation (+5% in Q2); and financials company RBC (+7% in Q2). Earnings growth stability was led by consumer staples company Loblaw Companies Ltd (+5% in Q2).
Source: Confluence
Source: Confluence
Appendix: How to read the charts
For example, for the book-to-price factor, we determine the period’s performance of the basket of stocks with the highest book-to-price values relative to the total market. Each factor is analyzed independently. Market and fundamental data are adjusted to enable sector-average (within each country) relative data to be used, and the performance measurement isolates the factor’s contribution to return.
Disclaimer
The information contained in this communication is for informational purposes only. Investment Metrics, a Confluence company, is not providing, legal, financial, accounting, compliance or other similar services or advice through this communication. Recipients of this communication are responsible for understanding the regulatory and legal requirements applicable to their business.
About Confluence
For more information, visit confluence.com


