Report
Q2 2023 Plan Universe Allocation & Return Analysis
Public Equity Exposure Drives 2023 Performance
August 22, 2023
By:
Executive Summary
Recent data from the U.S. Bureau of Labor Statistics shows the annual consumer price inflation figure dropped to 3.0% in June.1 This is still above the U.S. Federal Reserve target of 2% annual inflation but far below the peak figure we saw in June 2022 of 9.1% annual inflation.2 This is good news for investors as the U.S. Federal Reserve appears to be getting inflation under control, which ultimately should help stabilize capital markets. In addition, the U.S. unemployment rate sits at 3.6% as of the end of June 2023, and the real gross domestic product increased at an annual rate of 2.4%,3,4 signs that the U.S. economy is continuing to move forward through difficult environments.
U.S. public equity markets are up 16.2% year-to-date through June 2023, based on the Russell 3000 index, while the MSCI All-Country World ex. the U.S. index is up 9.9%. On the opposite side of the asset class spectrum, U.S. fixed income posted positive returns year-to-date, with the Bloomberg U.S. Aggregate returning 2.1%. Capital markets are bouncing back after a difficult year in 2022.
Highlights
- The year-to-date gross of fee return performance, at a median level, from plans has been invigorating. However, compared to the blended benchmark of 60% MSCI All-Country World Index and 40% Bloomberg Barclays U.S. Aggregate index, all plan types have underperformed.
- U.S. public equities have lifted plan portfolio returns in 2023, but when comparing plan performance from U.S. public equities, at a median level, to the Russell 3000 index all plan types underperformed in the second quarter.
- High Net Worth and Taft-Hartley plans have shifted assets into the alternative asset class in Q2 2023.
- Performance from the alternative asset class continues to struggle. Public plans only saw a 0.3% return in Q2 2023 and have a year-to-date return from this asset class of 1.9%, an inferior return compared to an extraordinary year in 2021.
Plan Performance Over Time
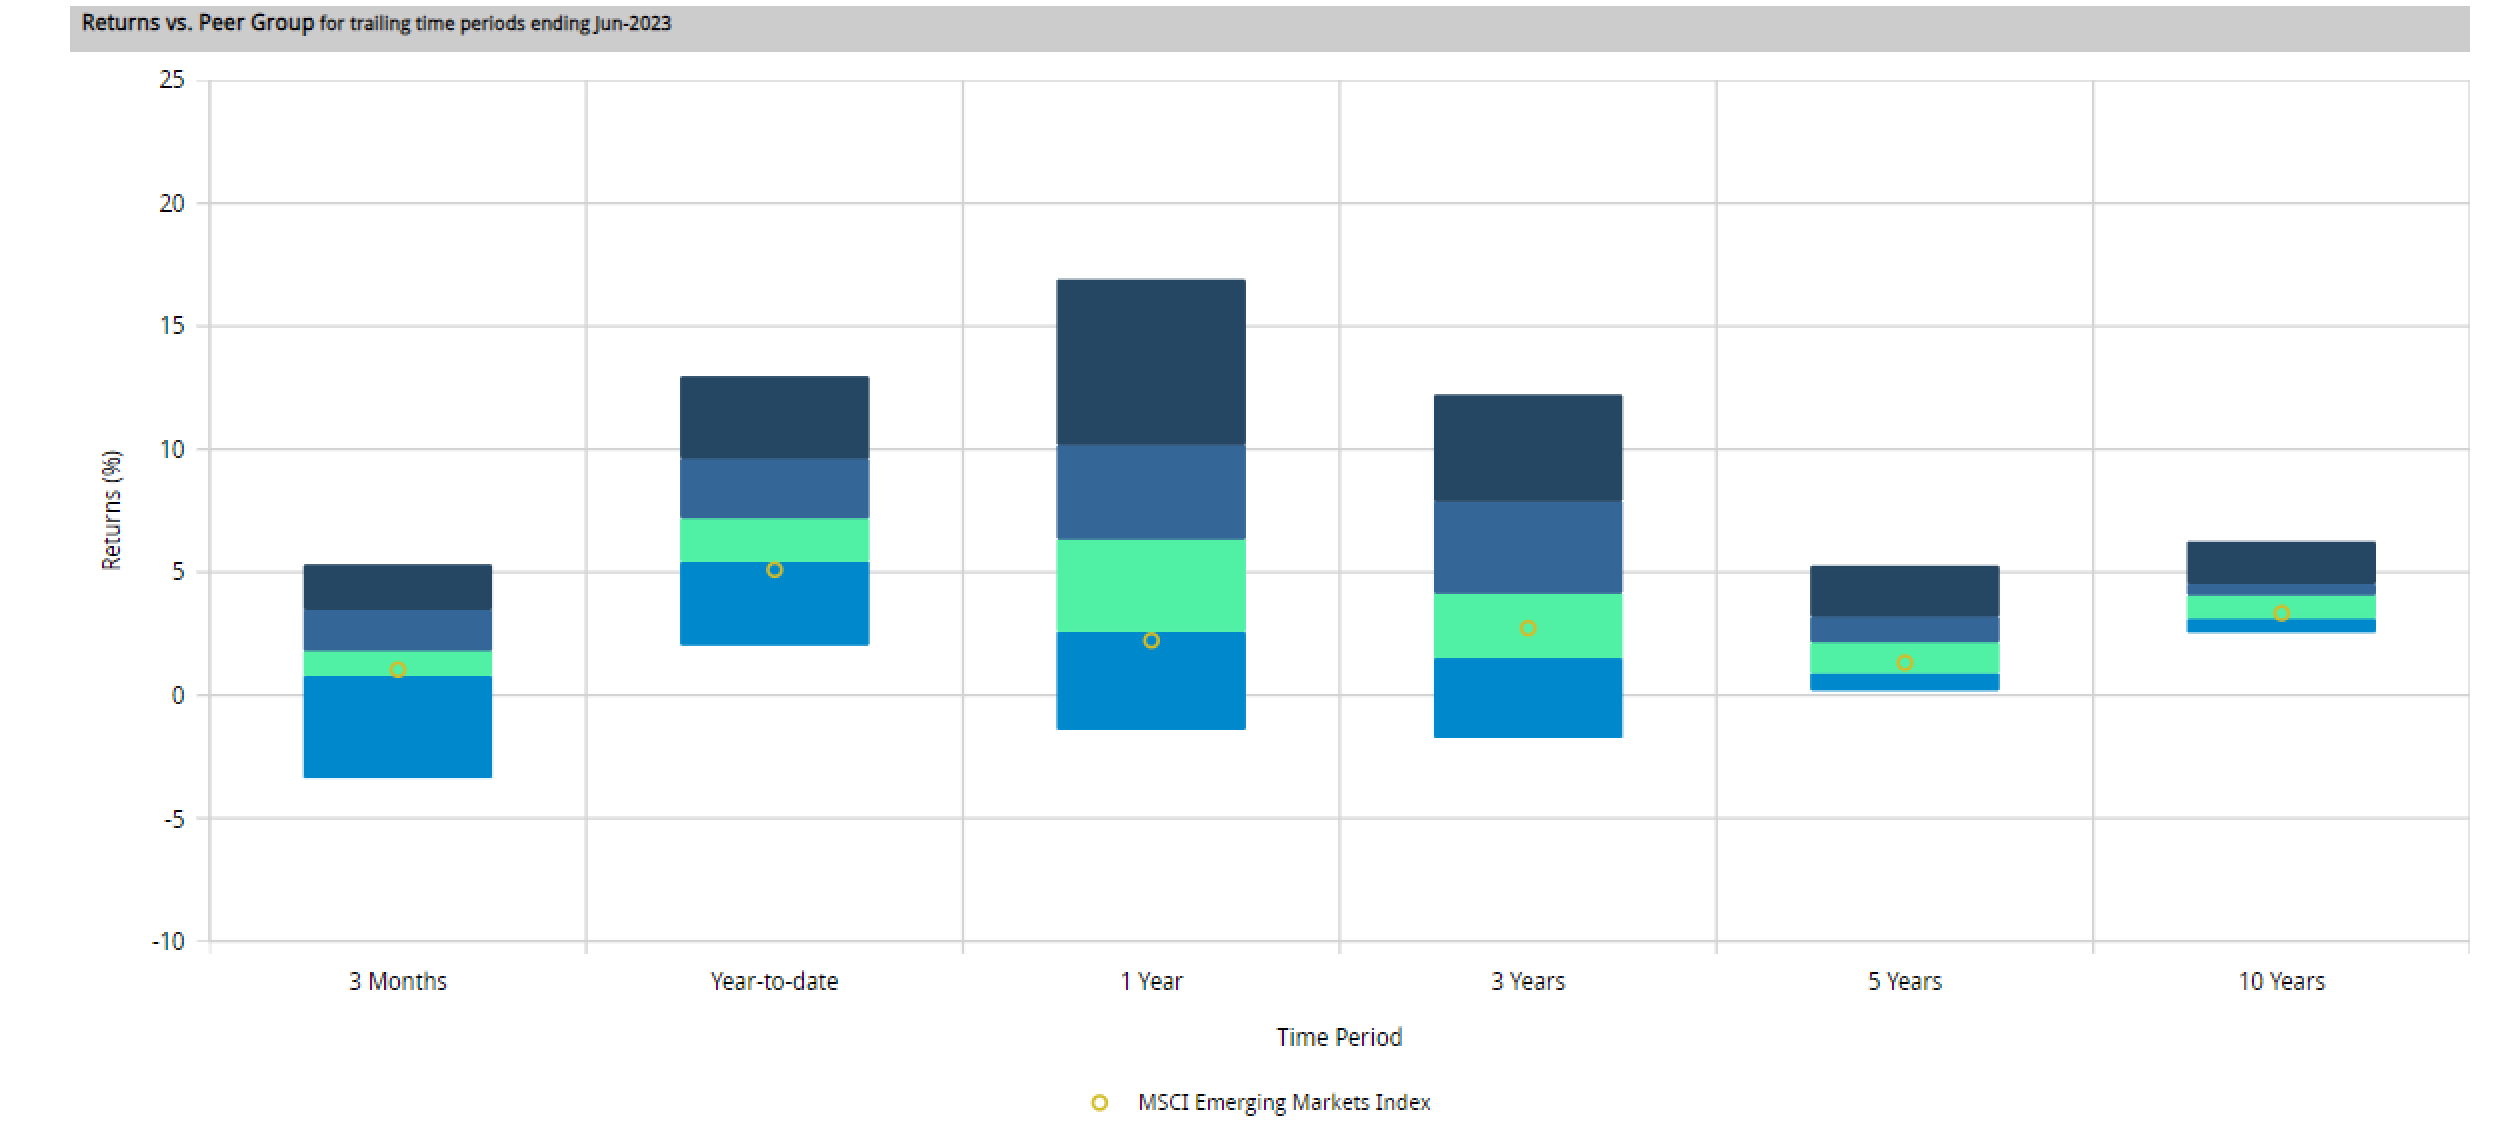
Source: Investment Metrics, a Confluence company
Historical PlanComparison
All plan types have laudable gross-of-fee returns in the short-term (quarter, year-to-date, and one year) at a median level. However, when you compare these gross-of-fee returns to a blended benchmark of 60% MSCI All-Country World Index and 40% Bloomberg Barclays U.S. Aggregate Index, most plan-type returns are disappointing. Specifically, the year-to-date returns from all plan types underperformed the blended benchmark. Having said that, the long-term (three-year and five-year) returns are outperforming the blended benchmark in a significant way.
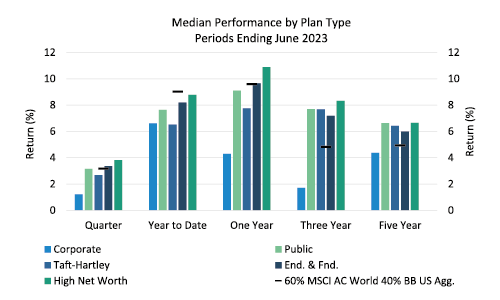
Chart 2: Median Performance by Plan Type.
Source: Investment Metrics, a Confluence company.
Q2 Plan Allocation Analysis
As anticipated, public equities are the main asset allocation for most plan types, with the exception being corporate plans. The relatively high allocation to fixed income for corporate plans compared to other plan types has clearly impacted their short-term performance, as they drastically underperformed against their peers. The other interesting move in Q2 2023 came from the High Net Worth and Taft-Hartley plans. Both plan types had a decrease in allocation to public equities and an increase in allocation to alternatives. High Net Worth portfolios have clearly benefited, based on gross-of-fee returns, from their heavy allocation to public equities. Now they seem to be shifting some of those assets to the alternative asset class.
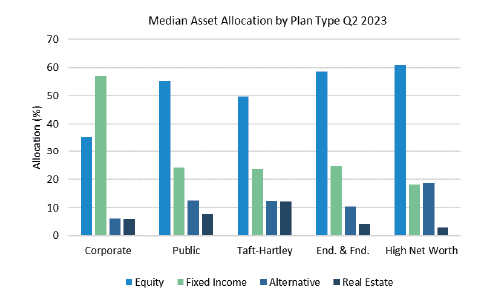
Chart 3: Median Allocations by Plan Type.
Source: Investment Metrics, a Confluence company.
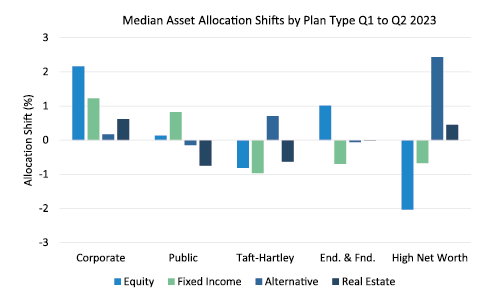
Chart 4: Median Allocation shift by Plan Type.
Source: Investment Metrics, a Confluence company.
U.S. Equity Performance
The U.S. public equity market has been the best-performing area within the public equity asset class and across all asset classes in the most recent quarter and year-to-date. All plan types have clearly benefited from this allocation based on the asset class returns reported. However, when you compare the returns attained by plans in the second quarter to the Russell 3000 index, the relative performance is discouraging. Every plan type underperformed the index in a particularly good-performing quarter for U.S. public equities. With regards to tactical asset allocation shifts, we saw High Net Worth portfolios decrease their allocation to U.S. public equities by 2% over the quarter, at a median level.
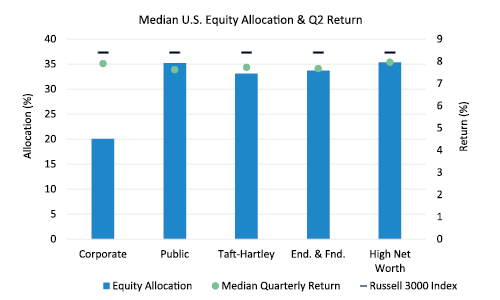
Chart 5: Median U.S. Equity Allocation & Performance by Plan Type.
Source: Investment Metrics, a Confluence company
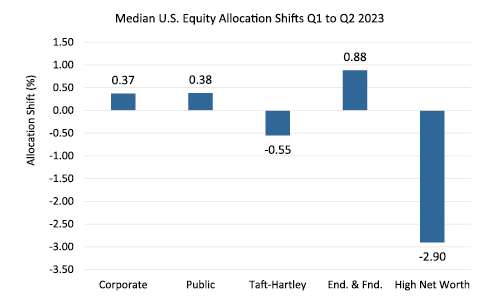
Chart 6: Median U.S. Equity Allocation shift by Plan Type.
Source: Investment Metrics, a Confluence company
Non-U.S. Equity Performance
After an electrifying Q1 2023 for Non-U.S. public equities, the returns in Q2 were moderate. Endowments and foundations have the highest exposure to Non-U.S. equities. Similar to what we saw in public U.S. equities, the High Net Worth plans decreased their allocation to Non-U.S. equities by 1% over the quarter.
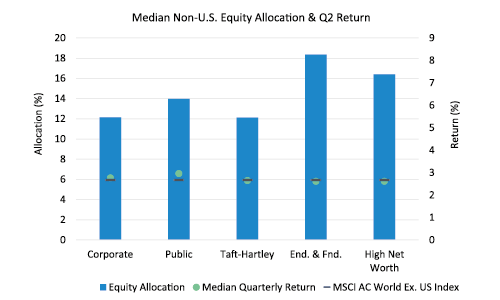
Chart 7: Median Non-U.S. Equity Allocation & Performance by Plan Type.
Source: Investment Metrics, a Confluence company
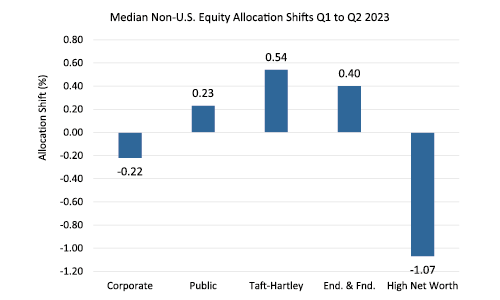
Chart 8: Median Non-U.S. Equity Allocation shift by Plan Type.
Source: Investment Metrics, a Confluence company
U.S. Fixed Income Performance
The returns from U.S. fixed income in the second quarter of 2023 were miniscule. We did not see much difference in performance between the plans U.S. fixed income returns, at a median level, and the Bloomberg Barclays U.S. Aggregate Index. Corporate plans have an allocation to this asset class that is more than double what other plans are allocating. This has clearly been a detractor of overall corporate plan performance in the short-term.
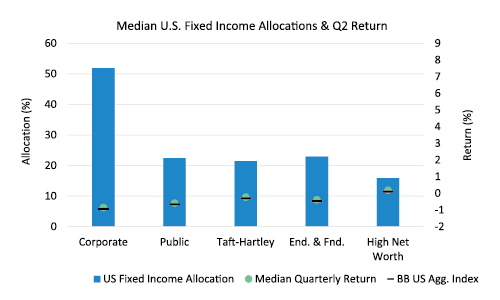
Chart 9: Median U.S. Fixed Income Allocation & Performance by Plan Type.
Source: Investment Metrics, a Confluence company
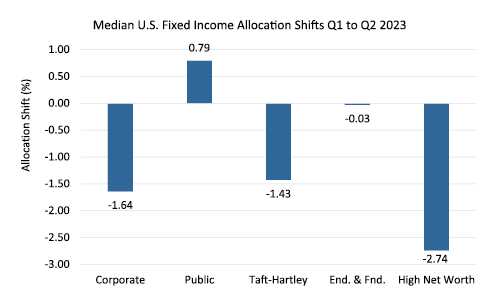
Chart 10: Median U.S. Fixed Income Allocation Shift by Plan Type.
Source: Investment Metrics, a Confluence company
Alternatives Performance
The returns from the alternative asset class were disappointing in the second quarter and year-to-date in 2023. High Net Worth portfolios have pivoted into the alternative asset class in a substantial way in 2023. We have also seen Taft-Hartley plans increase their allocation to alternatives in the second quarter.
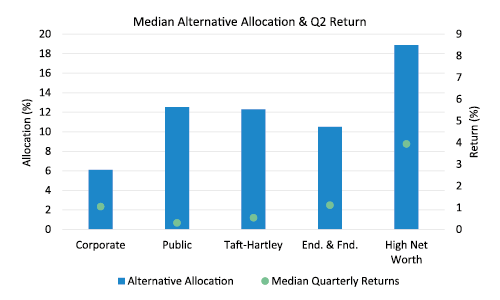
Chart 11: Median Alternative allocation & Performance.
Source: Investment Metrics, a Confluence company
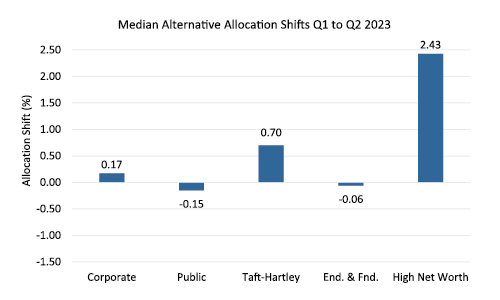
Chart 12: Median Alternative Allocation Shift by Plan Type.
Source: Investment Metrics, a Confluence company
Investment Metrics Plan Universe
Investment Metrics Plan Universe is the industry’s most granular analytics tool for plan sponsors, including standard and custom peer group comparisons of performance, risk, and asset allocations by plan type and size. The data is sourced directly from over 4,000 institutions using our reporting and analytics solutions, including investment consultants, advisors, and asset owners. Plan Universe is updated quarterly and typically available on or near the following schedule: preliminary data available on the 14th business day after quarter end, a second cut on the 21st business day, and final cut on the 29th business day. The data includes 20+ years’ history on:
- Trust Funds, Corporates, Public Plans, Taft-Hartley, Endowments & Foundations, High Net Worth, Health & Welfare, and custom groups.
- Asset Allocations broken into equity (US, global, global ex-US), fixed income (US, global, and global ex-US), alternatives, real estate (public and private), multi-asset, and cash. Emerging Markets allocations are available for equities and debt securities.
- Net and gross performances displayed by quartile with full percentiles via download.
- With all information aggregated by Plan Size.
Disclaimer
The information contained in this communication is for informational purposes only. Investment Metrics, a Confluence company, is not providing legal, financial, accounting, compliance, or other similar services or advice through this communication. Recipients of this communication are responsible for understanding the regulatory and legal requirements applicable to their business.
About Investment Metrics, a Confluence company
Investment Metrics, a Confluence company, is a leading global provider of investment analytics, reporting, data and research solutions that help institutional investors and advisors achieve better financial outcomes, grow assets, and retain clients with clear investment insights. Our solutions drive insights across 20K+ institutional asset pools, 28K+ funds, 910K+ portfolios, representing $14T+ in AUA. With over 400 clients across 30 countries and industry-leading solutions in institutional portfolio analytics and reporting, style factor and ESG analysis, competitor and peer analysis, and market and manager research, we bring insights, transparency, and competitive advantage to help institutional investors and advisors achieve better financial outcomes. For more information about Investment Metrics, a Confluence company, please visit www.invmetrics.com.

