Report
Q2 2023
Fee Analyzer Report
High Dividend Opportunities in Emerging Markets Equity
By:
Executive Summary
The analysis includes over 1,100 active manager post-negotiated fees from 76 asset managers from the Investment Metrics (IM) Emerging Markets Equity peer group.
Highlights
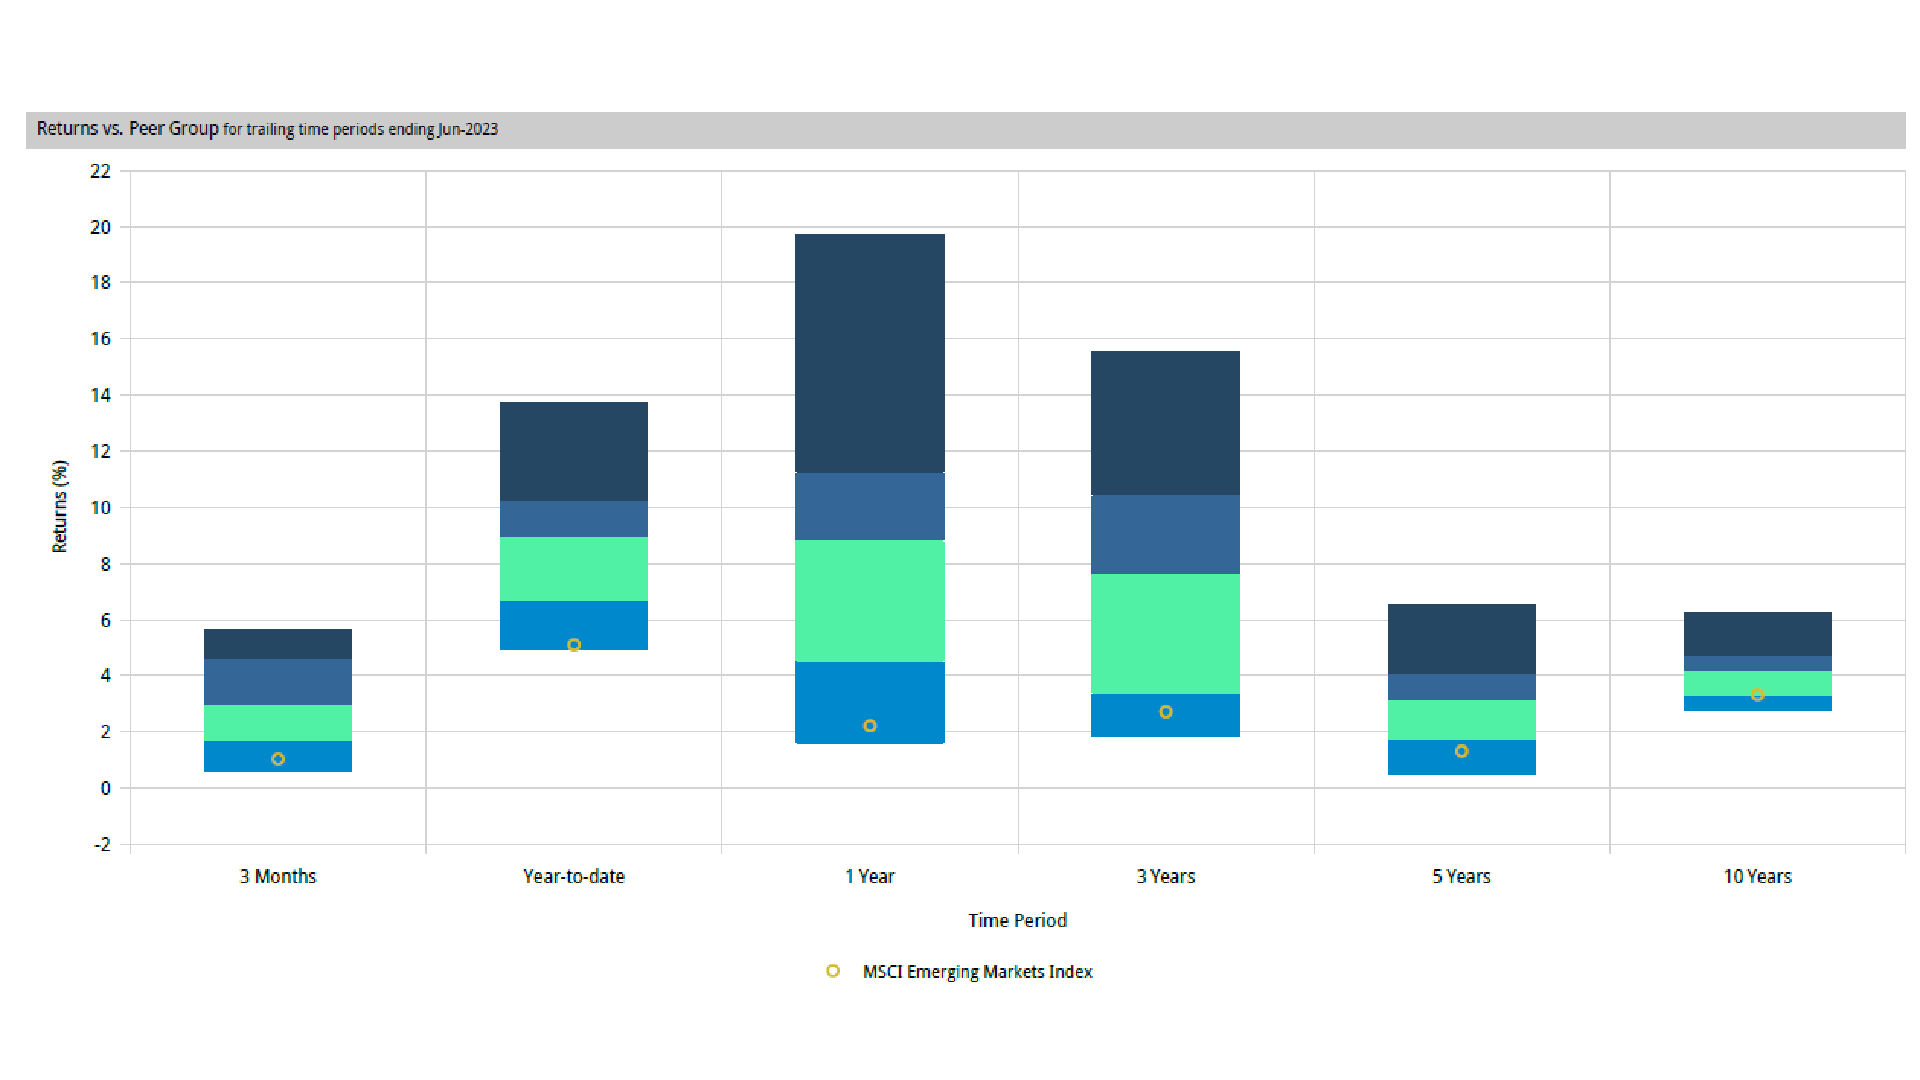
- Active Emerging Markets equity managers’ relative performance has rebounded in 2023; the median portfolio in the IM Emerging Markets Large Cap peer group has outperformed the MSCI Emerging Markets Index by 2.1% year to date.
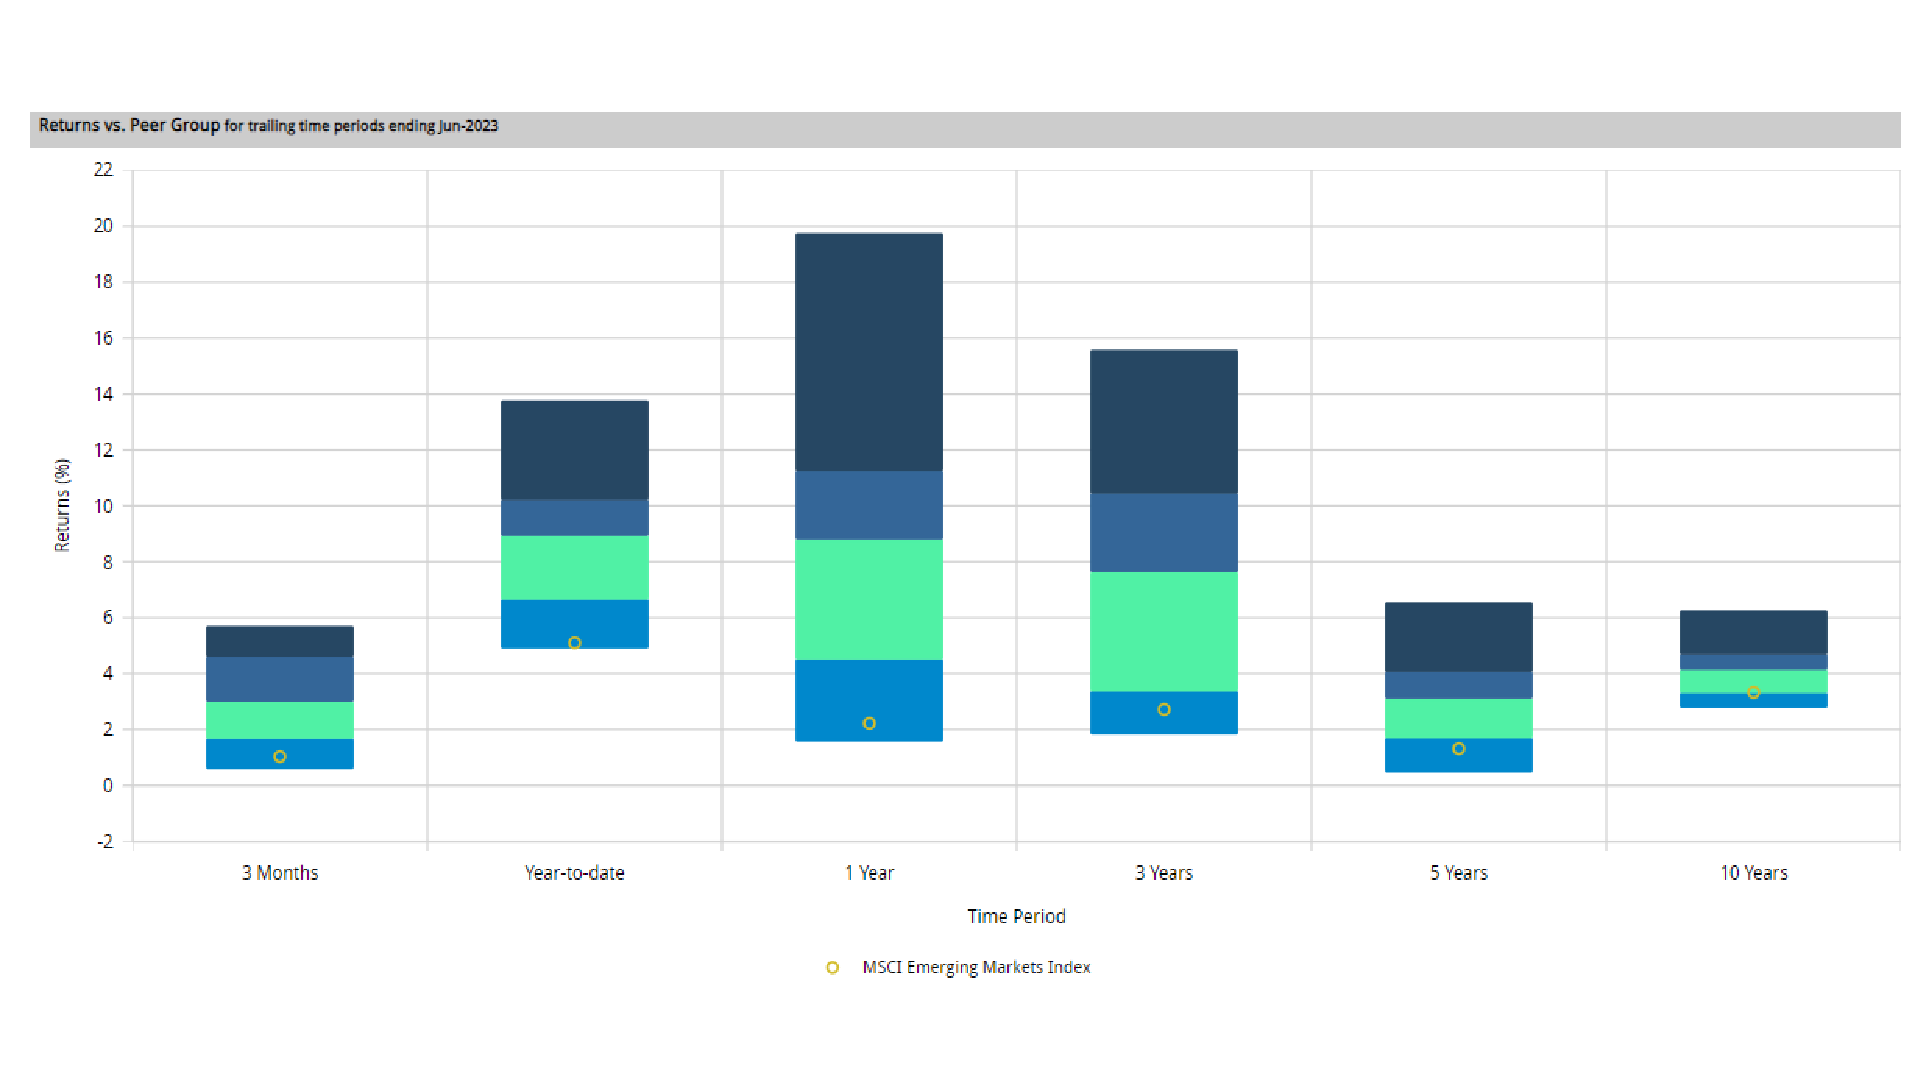
- Emerging Markets equity portfolios with above median dividend yields (>3%) offer even stronger relative performance, outperforming the benchmark by 3.8%.
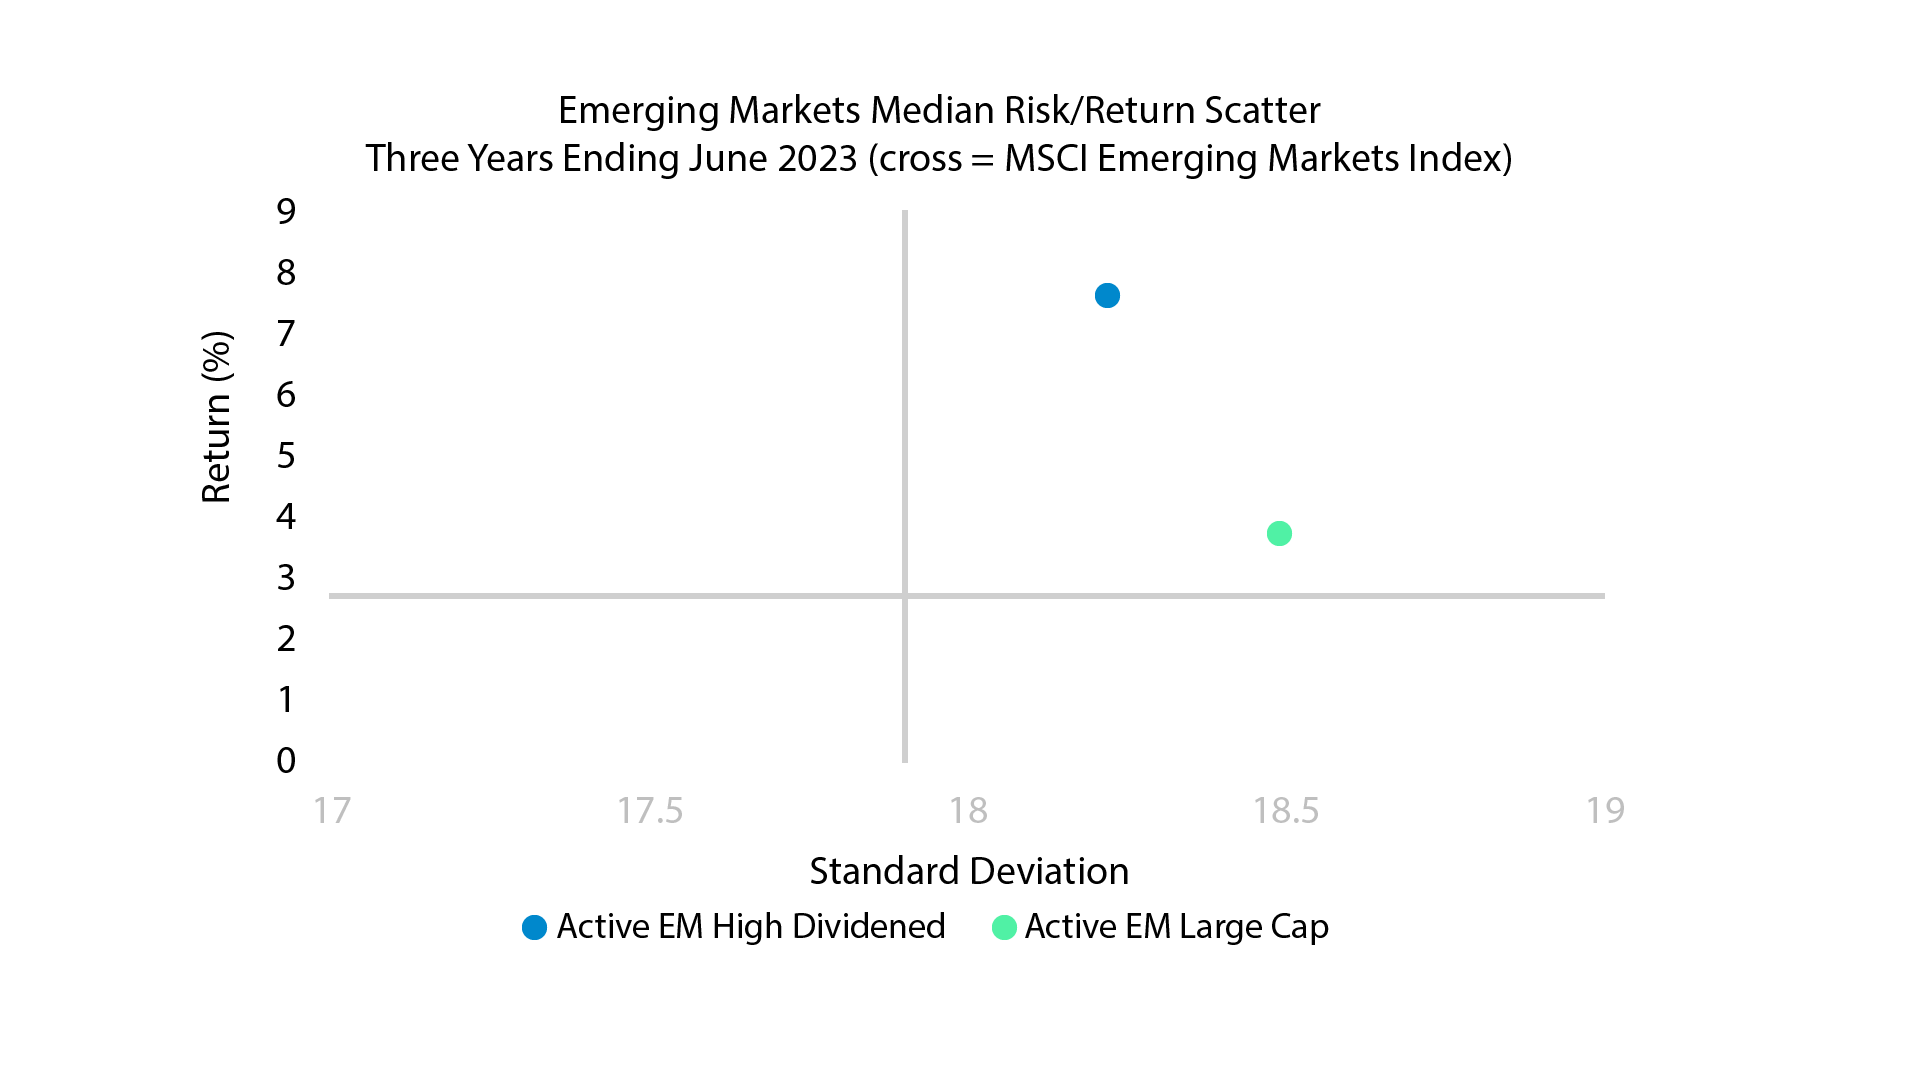
- Over three years, emerging markets portfolios with above median dividend yields produced significantly stronger returns than peers, with lower risk and fees.
Emerging Markets Equity Performance
Source: Investment Metrics, a Confluence company
Emerging Markets Equity High Dividend Yield (>3%)
As our colleagues highlighted in their recent Q21H Factor Performance Report, emerging markets equity performance was driven by Value, Yield, and Quality during the first half of 2023. With this in mind, we screened the IM Emerging Markets Equity peer group for products with above-median dividend yields (>3%). As Chart 2 highlights, these portfolios have very strong absolute and relative performance, returning 8.93% at the median level, which is more than 3.8% above the benchmark year to date.
Source: Investment Metrics, a Confluence company.
Emerging Markets Equity High Dividend Yield Risk vs. Return
What makes the emerging market’s high dividend products compelling, beyond the lower fee, is their risk /return profile. Chart 3 compares the median 3-year standard deviation and return for the high dividend products versus the IM Emerging Markets Large Cap peer group. The higher dividend products have significantly higher returns (7.63% vs. 3.72%) with lower risk (standard deviation 18.2 vs. 18.5).
Source: Investment Metrics, a Confluence company.
Source: Investment Metrics, a Confluence company.
Emerging Markets Equity Fees
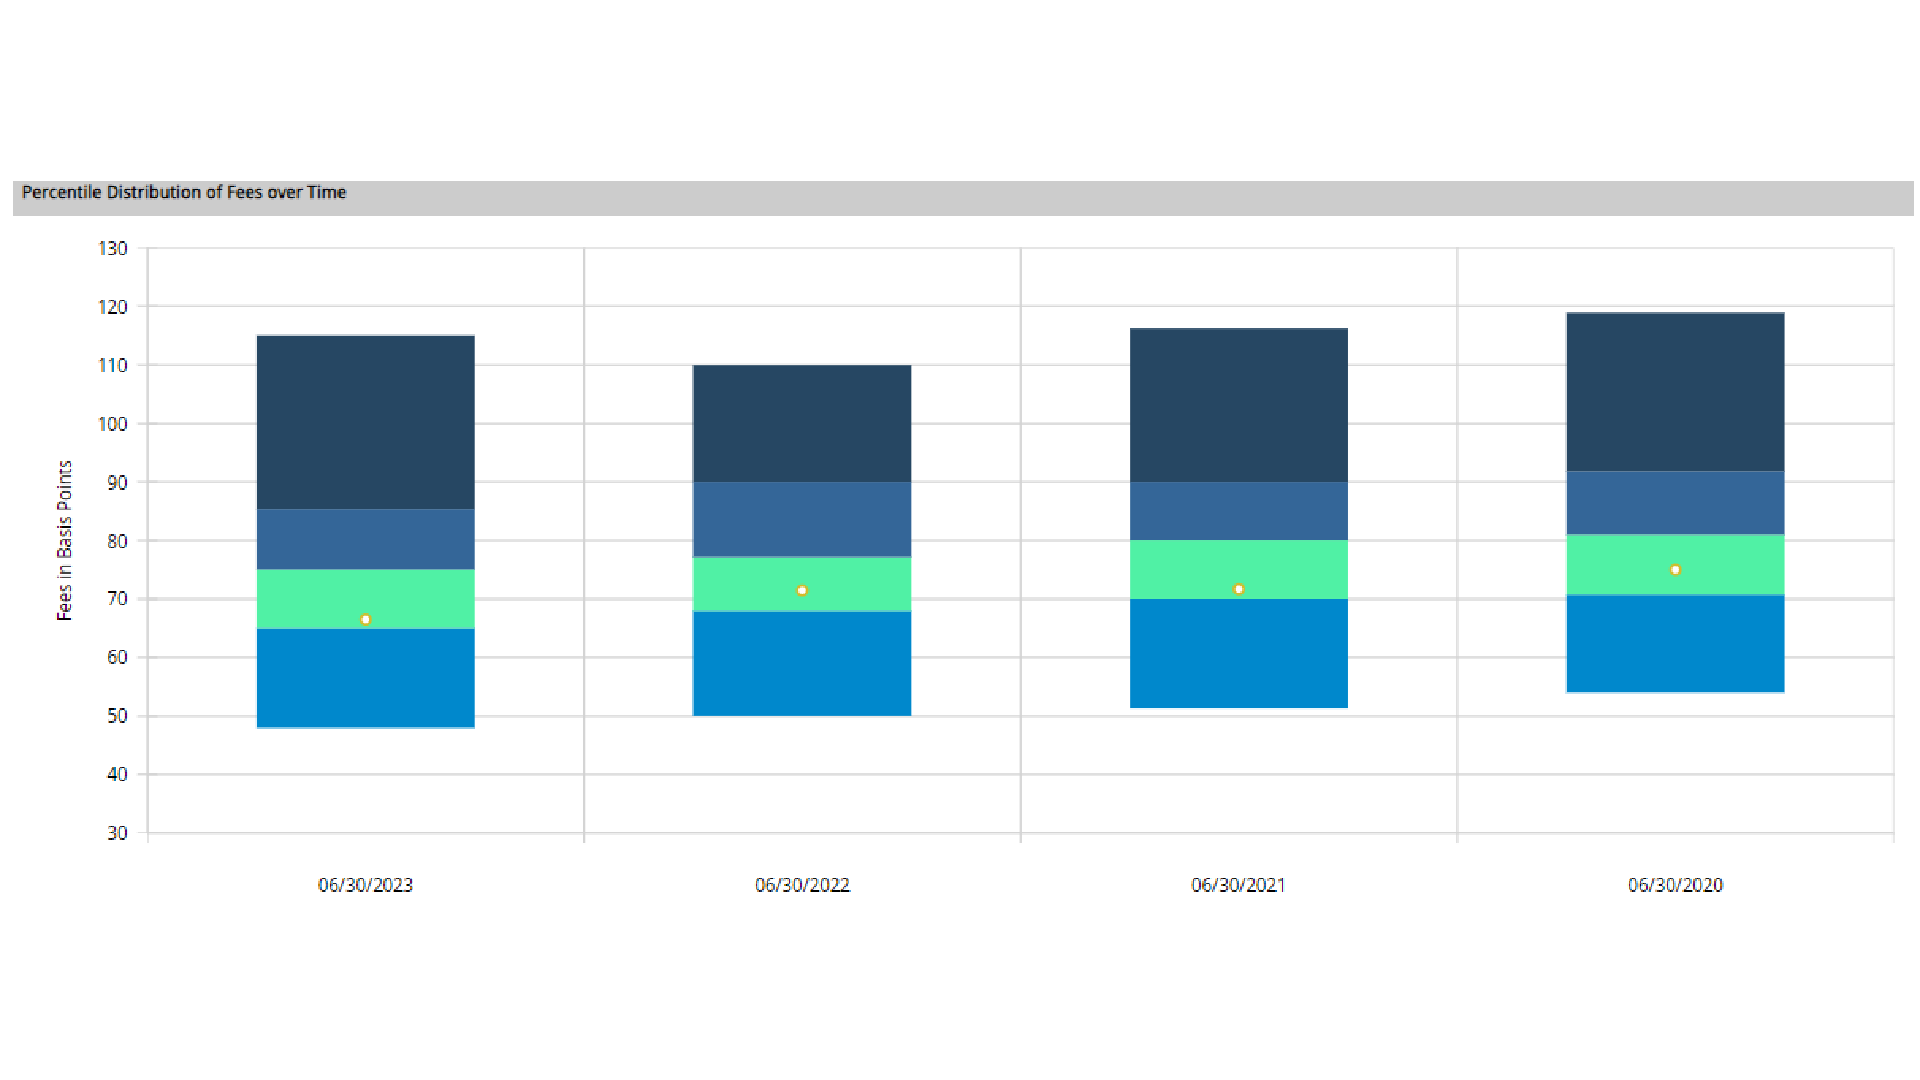
Chart 5: Active Emerging Markets Equity Fees, High Dividend Yield Median plotted.
Source: Investment Metrics, a Confluence company.
Investment Metrics Fee Analyzer
Disclaimer
The information contained in this communication is for informational purposes only. Investment Metrics, a Confluence company, is not providing legal, financial, accounting, compliance or other similar services or advice through this communication. Recipients of this communication are responsible for understanding the regulatory and legal requirements applicable to their business.
About Investment Metrics, a Confluence company
Investment Metrics, a Confluence company, is a leading global provider of investment analytics, reporting, data, and research solutions that help institutional investors and advisors achieve better financial outcomes, grow assets, and retain clients with clear investment insights. Our solutions drive insights across 20K+ institutional asset pools, 28K+ funds, and 910K+ portfolios, representing $14T+ in AUA. With over 400 clients across 30 countries and industry-leading solutions in institutional portfolio analytics and reporting, style factor and ESG analysis, competitor and peer analysis, and market and manager research, we bring insights, transparency, and competitive advantage to help institutional investors and advisors achieve better financial outcomes. For more information about Investment Metrics, a Confluence company, please visit www.invmetrics.com.

