Q1 2024
Plan Universe Allocation & Return Analysis
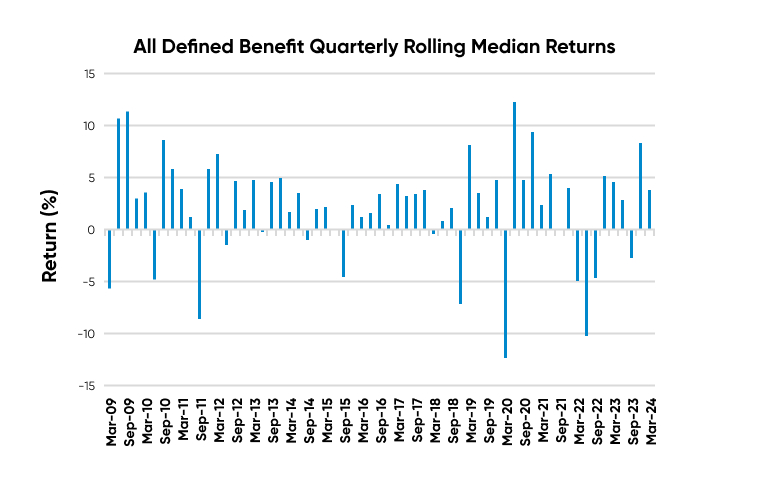
Defined Benefit plans post their best quarterly performance in three years.
by:
Market Background
Global equity markets posted another strong quarter to start the year, with the MSCI ACWI index returning over 8%. Geopolitical tensions, the high cost of borrowing, and uncertainty about the potential of loosening monetary policy all continue to present headwinds to global markets. Defined benefit plans, buoyed by strong equity markets performance during the quarter, posted a median return of 4%, which is more than double their average over the last five years.
Highlights
- All defined benefit plans posted positive performance for the quarter, with a median return of 4.03%.
- U.S. equity continued to drive performance across defined benefit plans, returning 9.87% on a median basis. Comparatively, the median returns for U.S. fixed income and alternatives were -.06% and 1.45%.
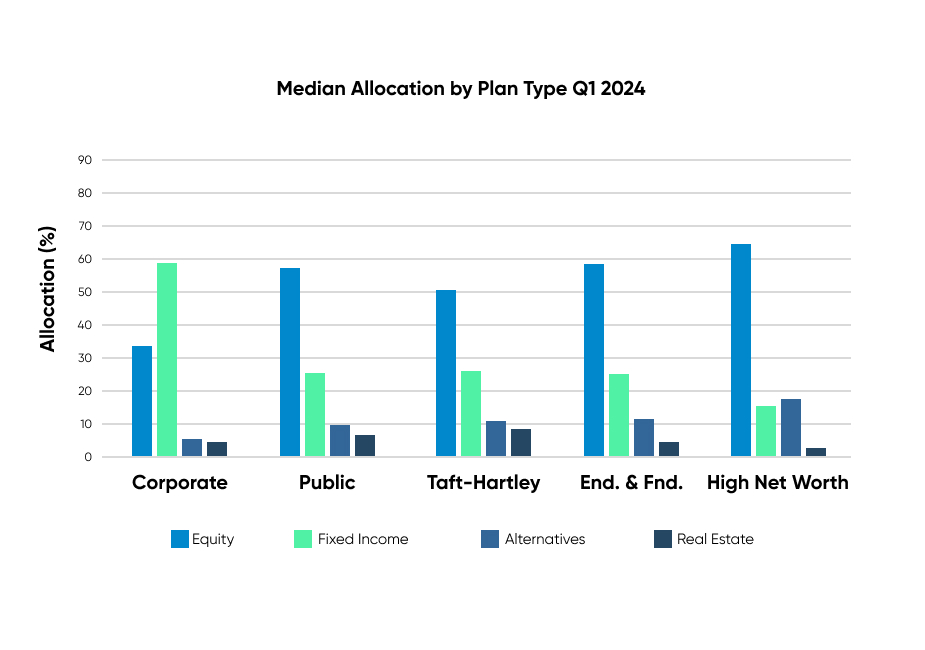
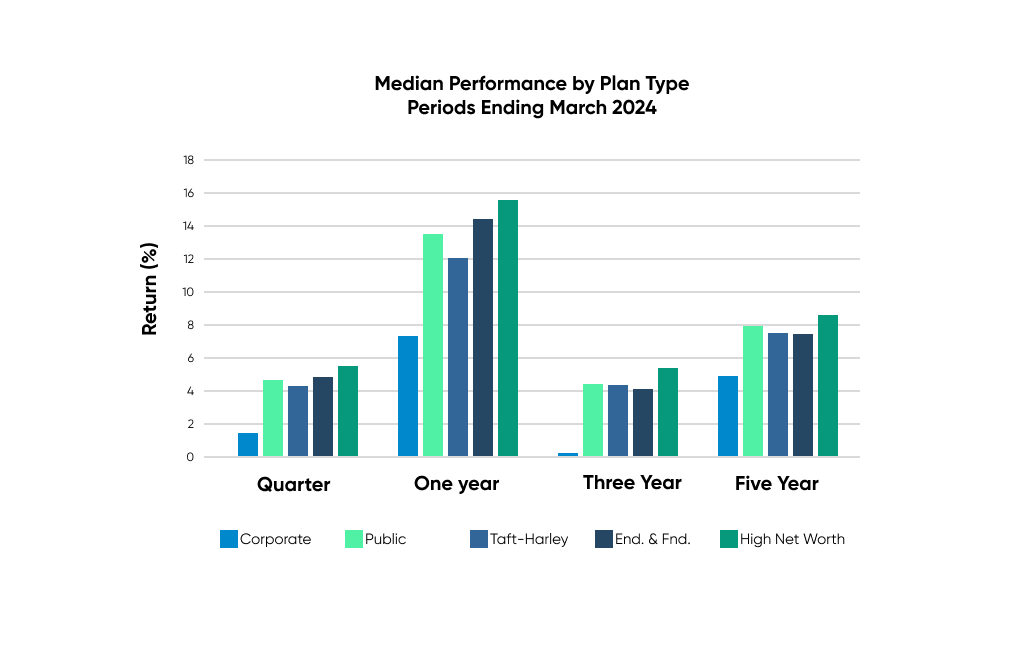
- Corporate defined benefit plans, driven by their fixed income allocation to long bonds and low exposure to equity, were the worst performers by plan type during the quarter, returning 1.46% at a median level.
- High Net Worth plans posted the strongest performance for the quarter, with a median return of 5.49%.
Plan Performance Over Time
Source: Investment Metrics, a Confluence company
Historical Plan Comparison
High Net Worth investors returned 5.49% at a median level in Q1 of 2024, outperforming all plan types. Comparatively, Corporate DB plans returned 1.46% for the quarter. While long bond performance in December buoyed corporate plan performance last quarter, that same exposure underperformed in Q1; therefore, corporate plans lagged other plan types. The plans with the highest exposure to equity (Public, Endowments & Foundations, High Net Worth) posted the most robust performance for the quarter and were the three plan types to outperform a traditional 60/40 benchmark return of 4.63%. (60% MSCI ACWI Index/ 40% Bloomberg Barclays U.S. Aggregate Index).
Source: Investment Metrics, a Confluence company.
Q1 Plan Allocation Analysis
Source: Investment Metrics, a Confluence company.
Source: Investment Metrics, a Confluence company.
U.S. Equity Performance
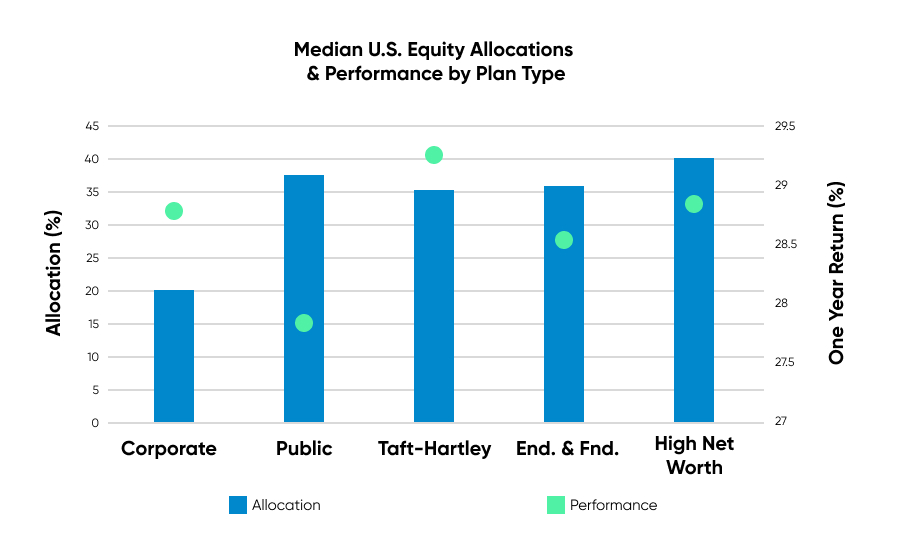
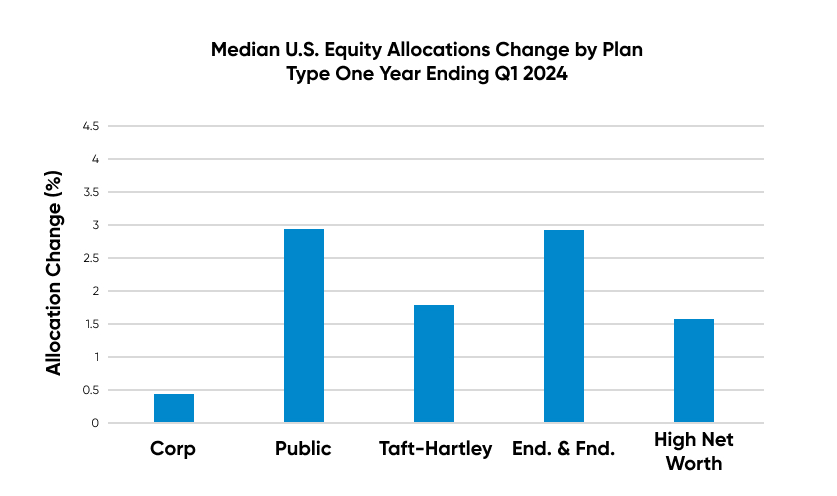
The public U.S. equity market posted very strong returns in Q1 2024; for defined benefit plans, the median U.S. equity return was 9.87%. Corporate plans continue to be underweight U.S. equity with a median allocation of 20%, roughly half the allocation compared to other plan types. All plan types increased their allocation to U.S. equity for the year ending March. High Net Worth plans, the best-performing plan type for the year, increased their allocation to U.S. equity to 40%.
Source: Investment Metrics, a Confluence company.
Source: Investment Metrics, a Confluence company.
U.S. Fixed Income Performance
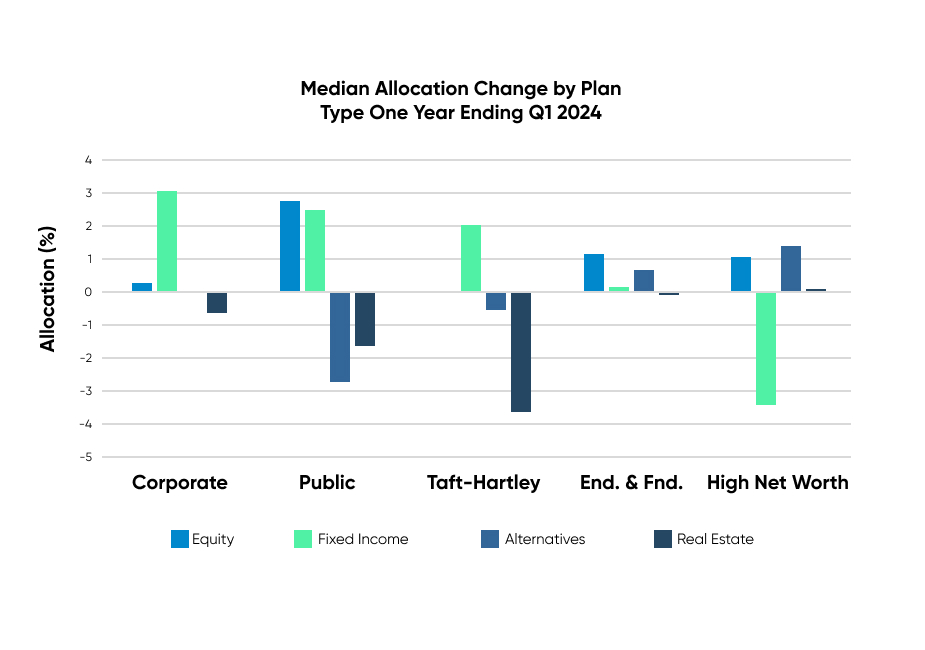
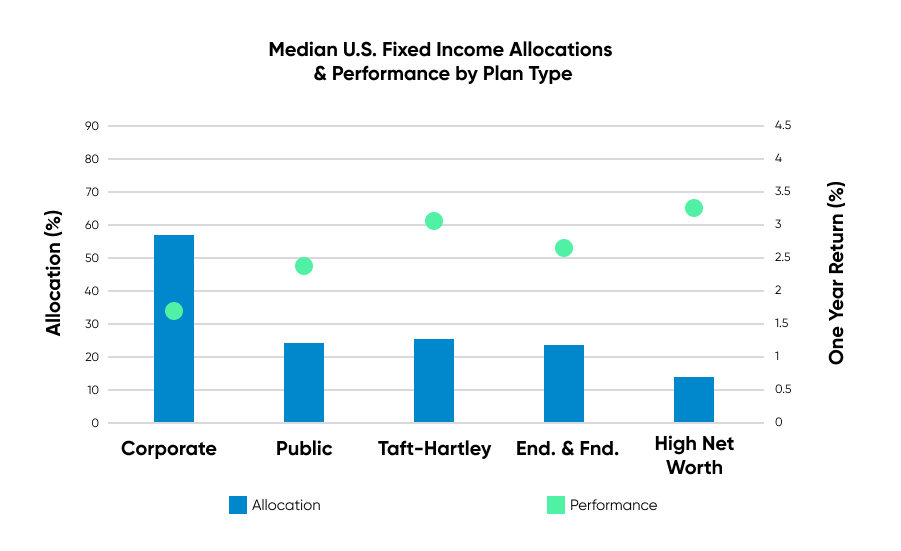
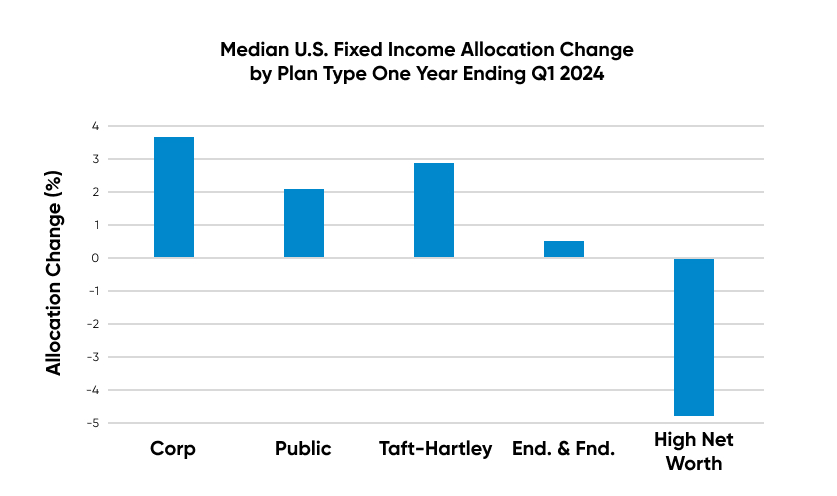
All plan types other than High Net Worth increased their allocation to U.S. Fixed income over the last year. Corporate plans, which have the highest allocation to the asset class at 57%, also increased their allocation more than any other plan type during the last year.
Source: Investment Metrics, a Confluence company.
Source: Investment Metrics, a Confluence company.
Alternatives Performance
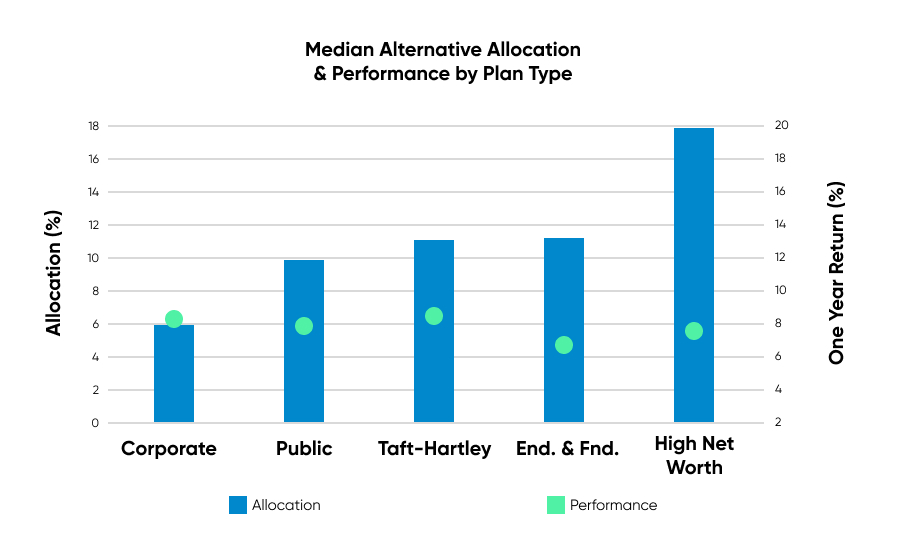
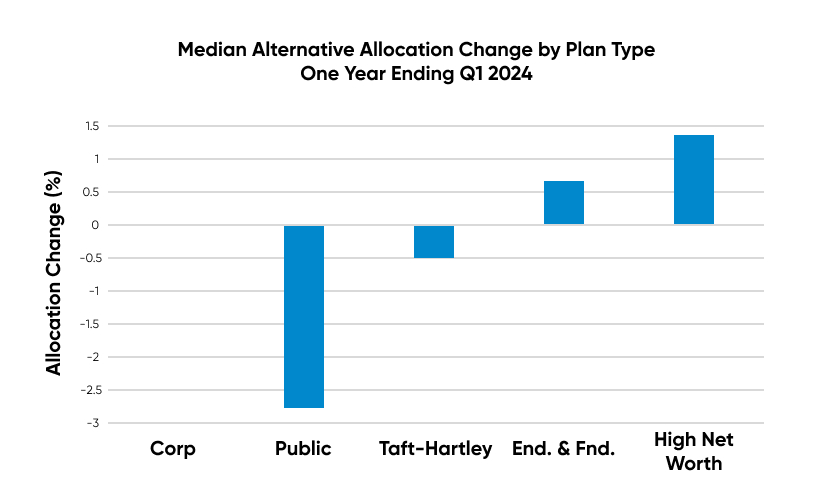
The plans that increased their allocations to Alternatives during the last year (High Net Worth and Endowments & Foundations) also have the highest allocations. Public plans had the largest pullback to alternatives during the year, down over 2.5% at the median level.
Source: Investment Metrics, a Confluence company.
Source: Investment Metrics, a Confluence company.
Investment Metrics Plan Universe
- Trust Funds, Corporates, Public Plans, Taft-Hartley, Endowments & Foundations, High Net Worth, Health & Welfare, and custom groups.
- Asset Allocations broken into equity (US, global, global ex-US), fixed income (US, global, and global ex-US), alternatives, real estate (public and private), multi-asset and cash. Emerging Markets allocations are available for equities and debt securities.
- Net and gross performances displayed by quartile with full percentiles via download.
- With all information aggregated by Plan Size.
Disclaimer
The information contained in this communication is for informational purposes only. Investment Metrics, a Confluence company, is not providing legal, financial, accounting, compliance or other similar services or advice through this communication. Recipients of this communication are responsible for understanding the regulatory and legal requirements applicable to their business.

