October 2024
Factor Performance Analysis
Global Momentum Uprise
by:
Market Background
In October, stock market volatility rose, even as stocks briefly hit new highs across the globe. Geopolitical uncertainty loomed throughout the month as the US presidential elections approached, investors keeping a close watch on potential impacts on trade and regulatory changes. Historically, market volatility tends to rise ahead of elections as investors assess potential outcomes.
China persisted in its efforts to intimidate Taiwan throughout October, conducting military exercises around the island.
Japan's economy has seen a moderate recovery, but defaults are rising, particularly among firms. Profits have only slowly improved since the monetary policy changes made in the summer of this year.
Crude oil prices dropped to $67/barrel at the end of October before rising to $71/barrel in the first week of November. They peaked at $73/barrel early in October.
Gold prices continued to surge in Oct, peaking at $2,780/ troy ounce at month-end. The total funds raised in the crypto industry in October 2024 experienced a substantial 96% increase compared to the previous month.
Factor Summary
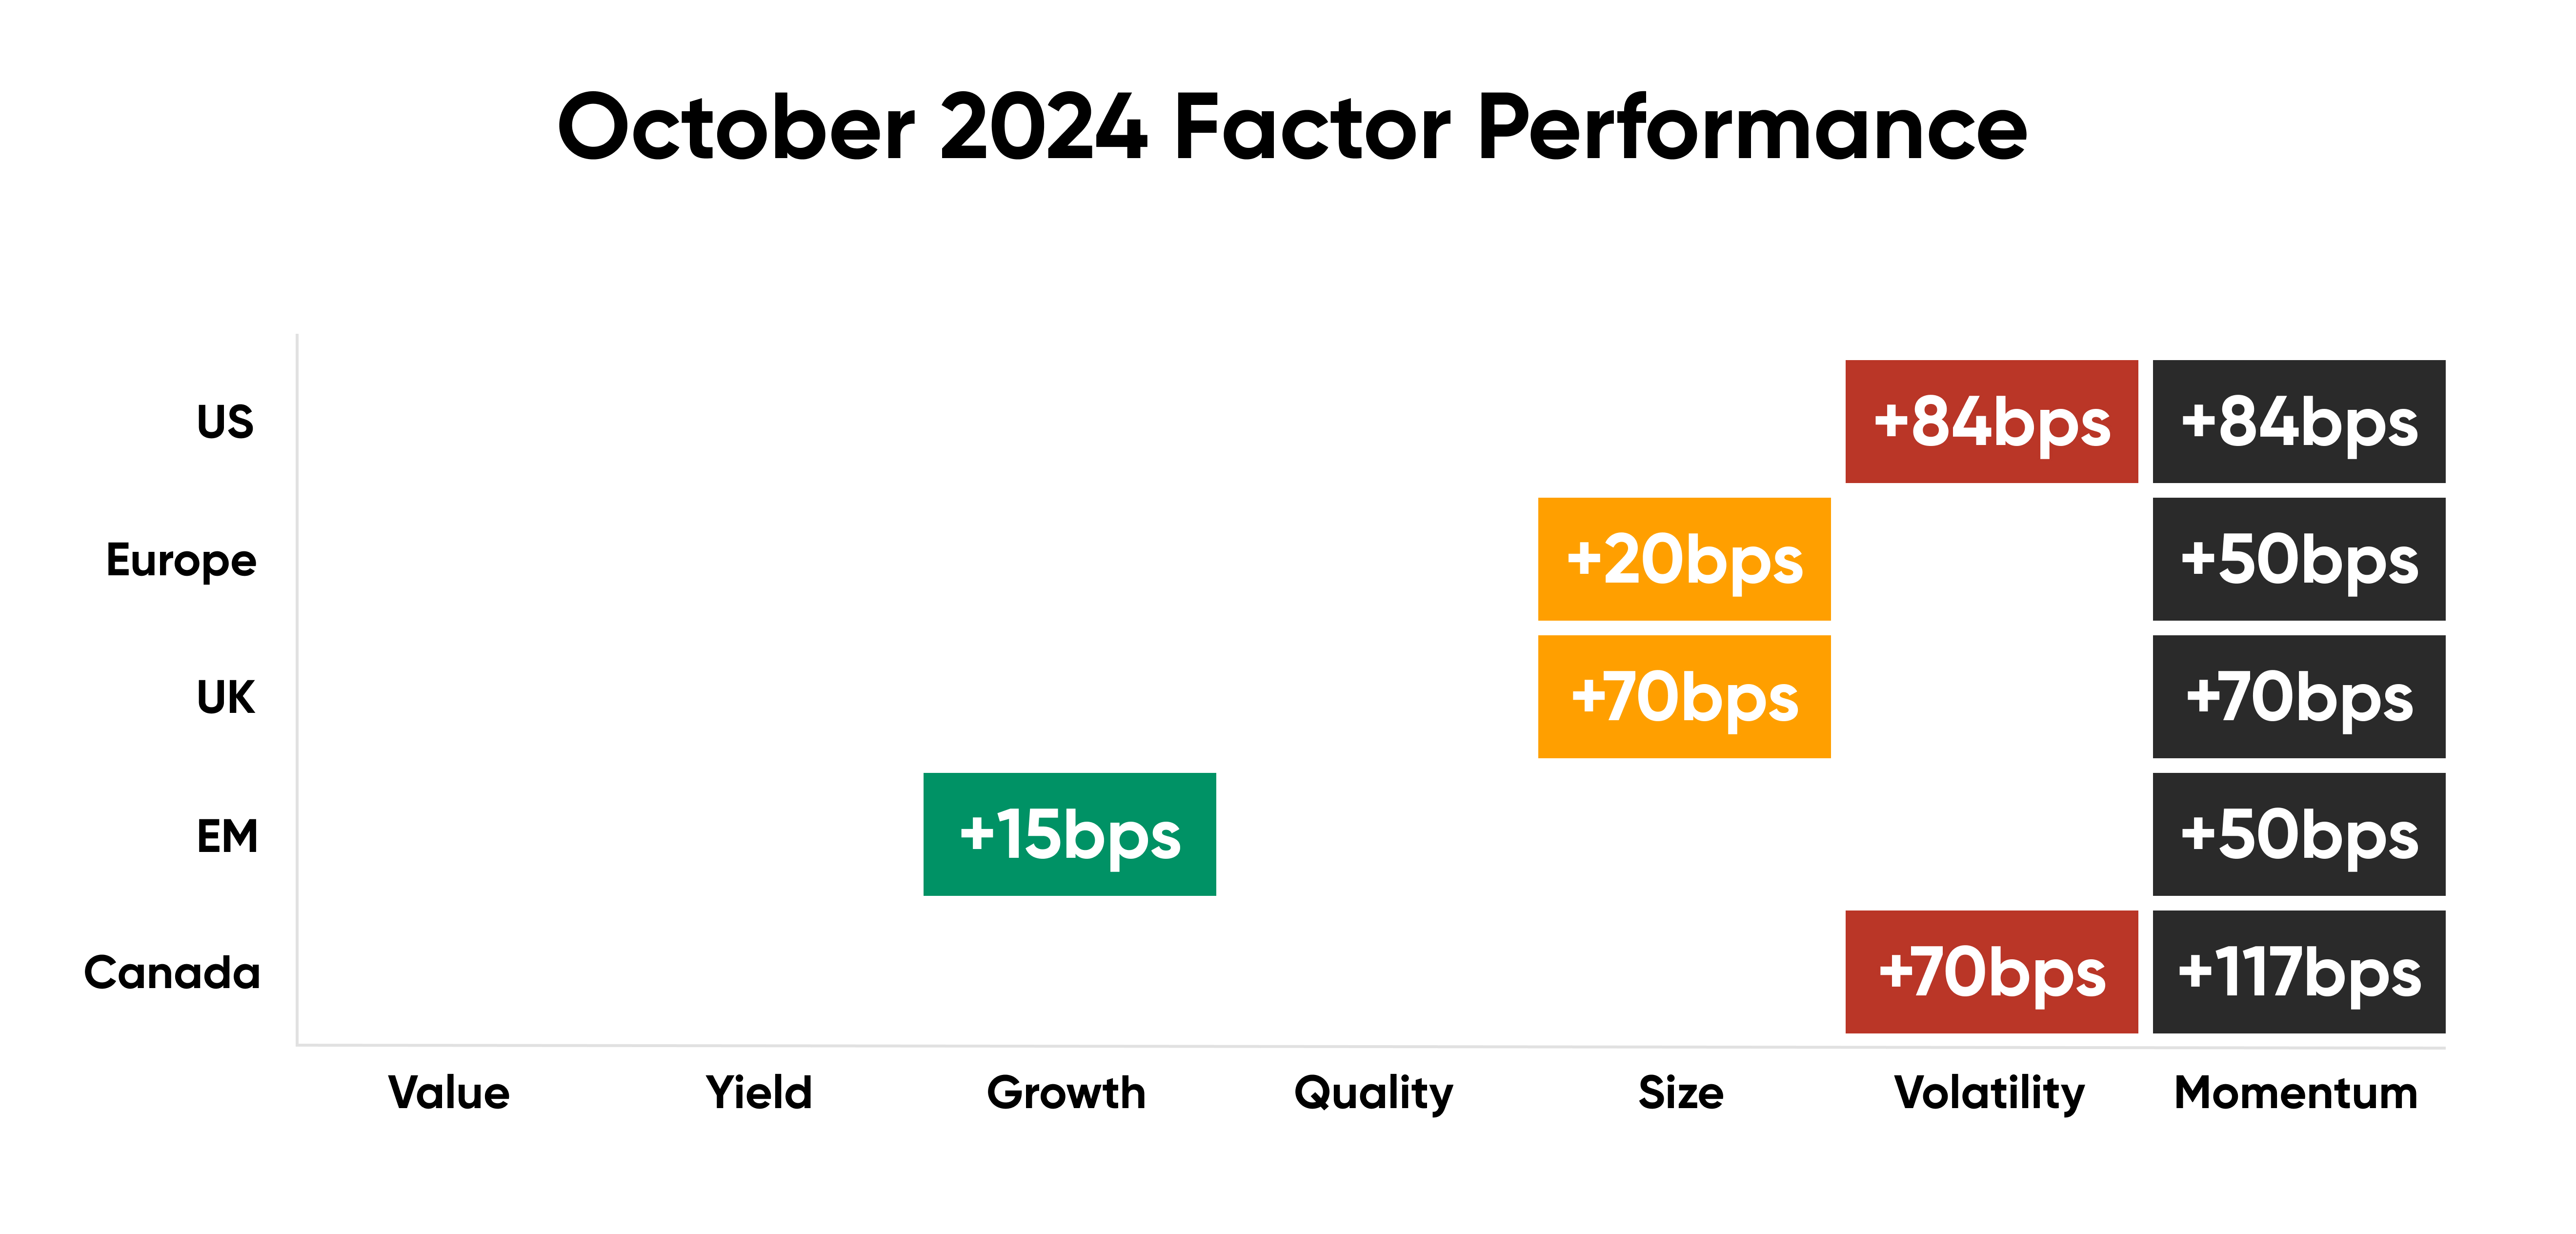
- US Equities: Volatility and Momentum outperformed.
- Europe: Size and Momentum outperformed.
- UK: Size and Momentum outperformed.
- Emerging Markets: Growth and Momentum outperformed.
- Canada: Volatility and Momentum outperformed.

Source: Confluence Style Analytics
US Equities
As the 2024 presidential election approached in October, the S&P 500's performance declined to -0.8%, with Value and Yield factors major contributors to the region's negative performance.
The U.S. unemployment rate held steady at 4.1%, a three-month low. Core consumer prices, excluding items like food and energy, increased by 0.3% from the prior month. While the US Manufacturing PMI was revised higher to 48.5 from 47.8 in September, there was uncertainty in October surrounding the upcoming presidential election, cited as a key factor behind the decline in new orders for U.S. Manufacturing.
All Growth subfactors outperformed the market in October except for the dividend growth 5Y subfactor, which lagged by 150 basis points. Volatility and Momentum returns also outperformed the market this month, marking a shift from the previous quarter's performance for these two factors.
Stocks with high 3Y volatility that contributed to the US's performance in October include info tech company NVIDIA Corp (9.3% in October), Salesforce (6.5% in October), and communication services company Netflix (6.6% in October). Additionally, companies with stable forecasted 12M revisions, including financials company JPMorgan Chase and Co (+5.8% in October) and info tech company Servicenow (6.5% in October), also contributed to the outperformance.
Source: Confluence Style Analytics
European Equities
In Europe, the equity market fell to a -5.9% performance, with the decline largely driven by the underperformance of Quality and Volatility subfactors. Momentum and Size outperformed the market, averaging gains of 50 and 20 bps, respectively.
In the Euro Area, the Consumer Price Index rose by 0.3% month-over-month in October 2024, marking the largest increase in six months. The Manufacturing PMI was revised slightly upward to 46 in October 2024, up from 45 in September. The unemployment rate held steady at 6.3% in September.
Key market cap drivers for European stocks in the month of October include German info tech company SAP Se (+2.2% in Oct) and French industrials company Airbus (+4.0% in Oct).
Companies with forecast 12M revisions subfactor that contributed to the outperformance of Euro Zone include Spanish financials company Caixa bank (+1.4% in Oct); and Italian financials company UniCredit (+0.5% in Oct). Key drivers of high-Quality European stocks with stable sales growth this month include German weapons manufacturer Heckler & Koch (+15%); French lottery organizer Francasise des Jeux (+12%), Italian bank Banca Popolare Di Sondrio (+18%) and Siemens Energy (+14%).
Source: Confluence Style Analytics
UK Equities
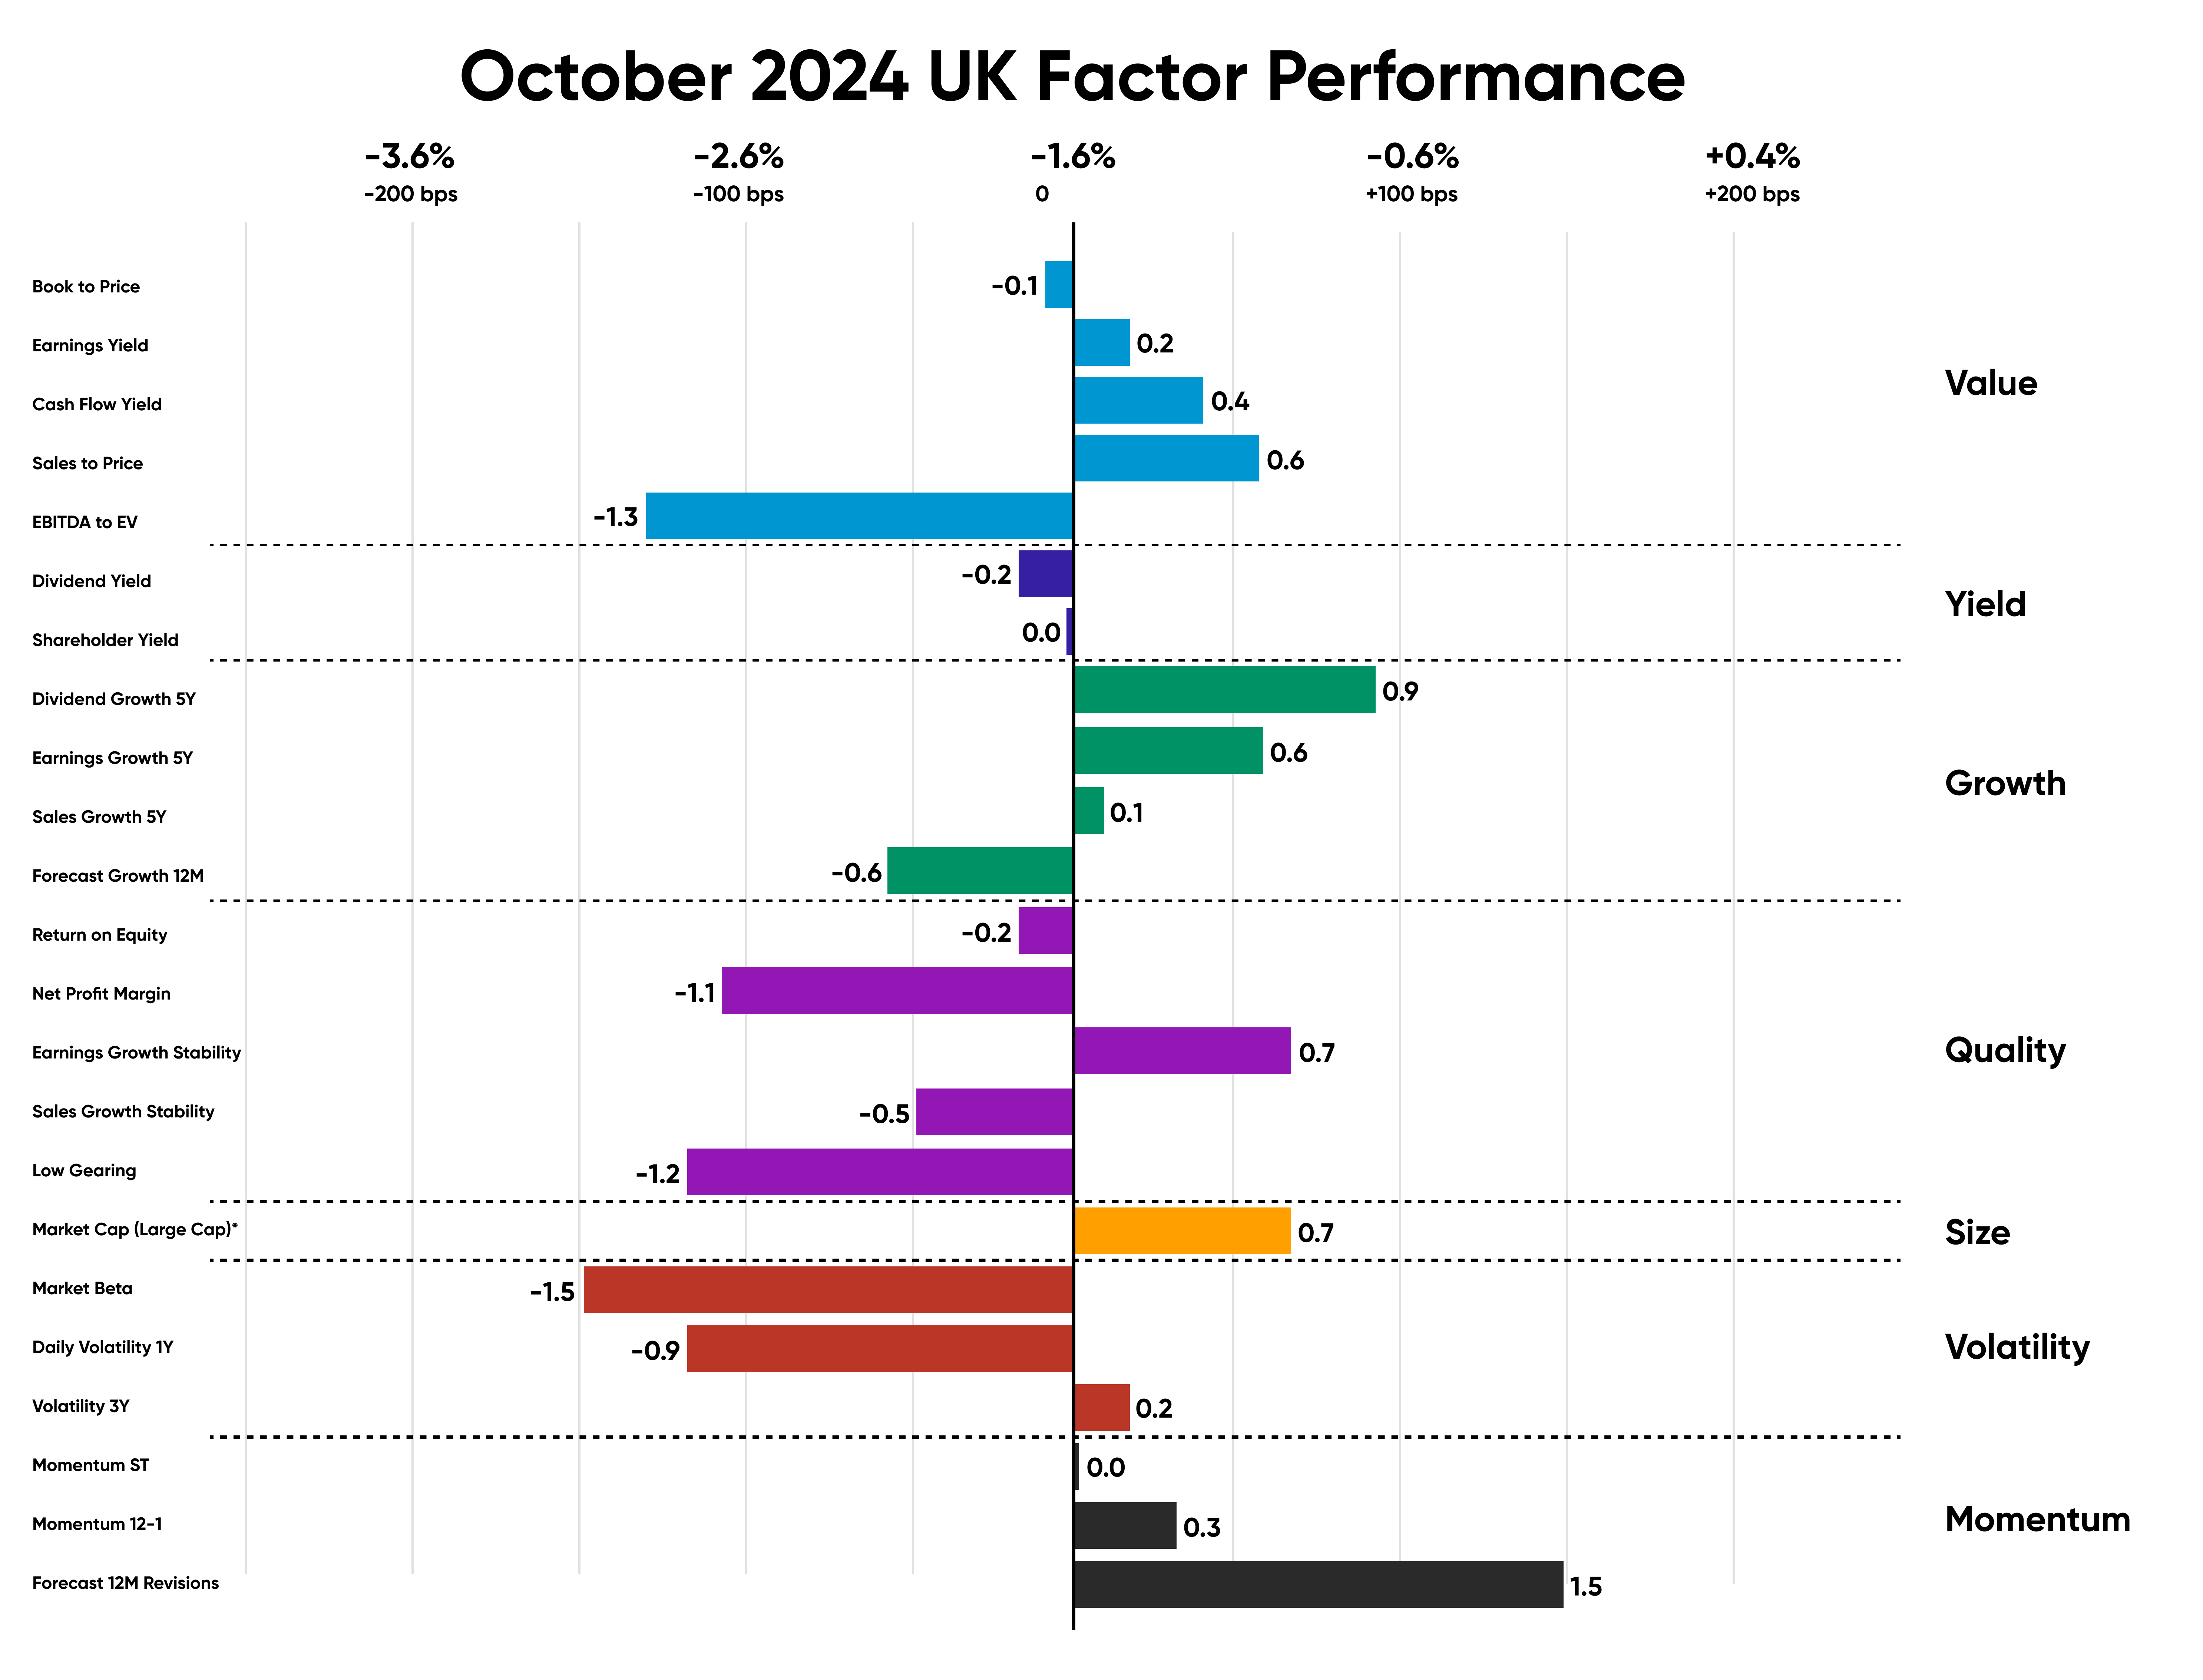
In October, the UK equity market continued its downward trend from September, recording a negative return of -1.6% for the month. The underperformance delivered by the UK this month was predominantly driven by factors Quality, Yield, and Volatility which lagged behind the market despite Size and Momentum outperforming by 70bps each.
The annual inflation rate in the UK dropped to 1.7% in September 2024, down from 2.2% in the previous month. Manufacturing production increased by 1.1% month-over-month in August 2024, recovering from a revised 1.2% decline in the previous month. The employment rate in the region rose to 75% in August from 74.8% in July of 2024.
British stocks with a strong forecast 12M Revisions that outperformed this month include financials company Barclays (+1.4% in October) and financials company Natwest (+2.5% in October).
Stocks with high market cap outperforming the UK market include financials company HSBC Holdings (2.0% in Oct); consumer discretionary company Compass Group (0.7% in Oct)
Source: Confluence Style Analytics
Emerging Market Equities
The factor trend in Emerging Markets favored Momentum and Growth, with momentum 12-1 outperforming the market by 60 bps. The region's negative performance was primarily driven by Value subfactors, while Quality, like the previous month, displayed a mixed trend. The inflation rate in India rose to 5.5% in September from 3.6% in August, while the employment rate decreased to 46.8%. Mexico's annual inflation rate increased to 4.7% in October 2024, rising from 4.58% in September. In Brazil, the inflation rate of 4.7% rose from 4.4% in September. China's unemployment rate dropped to 5.1% in September 2024, down from 5.3% in August, while the inflation rate also declined to 0.3% in October.
Emerging Markets equities that outperformed in October, captured by the momentum 12-1 subfactor, include a Taiwanese info tech company, Taiwan Semiconductor Manufacturing Co (+6.3% in Oct); Taiwanese info tech company Taiwan Semiconductor Manufacturing Corp (+4.0% in Oct); Chinese financials company China Construction Bank Co (2.5% in Oct). Companies with strong return on equity performance include Consumer Discretionary company Meituan (+5.5% in Oct); and Chinese financials company East Money Information co Limited (+12.6% in Oct).
Source: Confluence Style Analytics
Canadian Equities
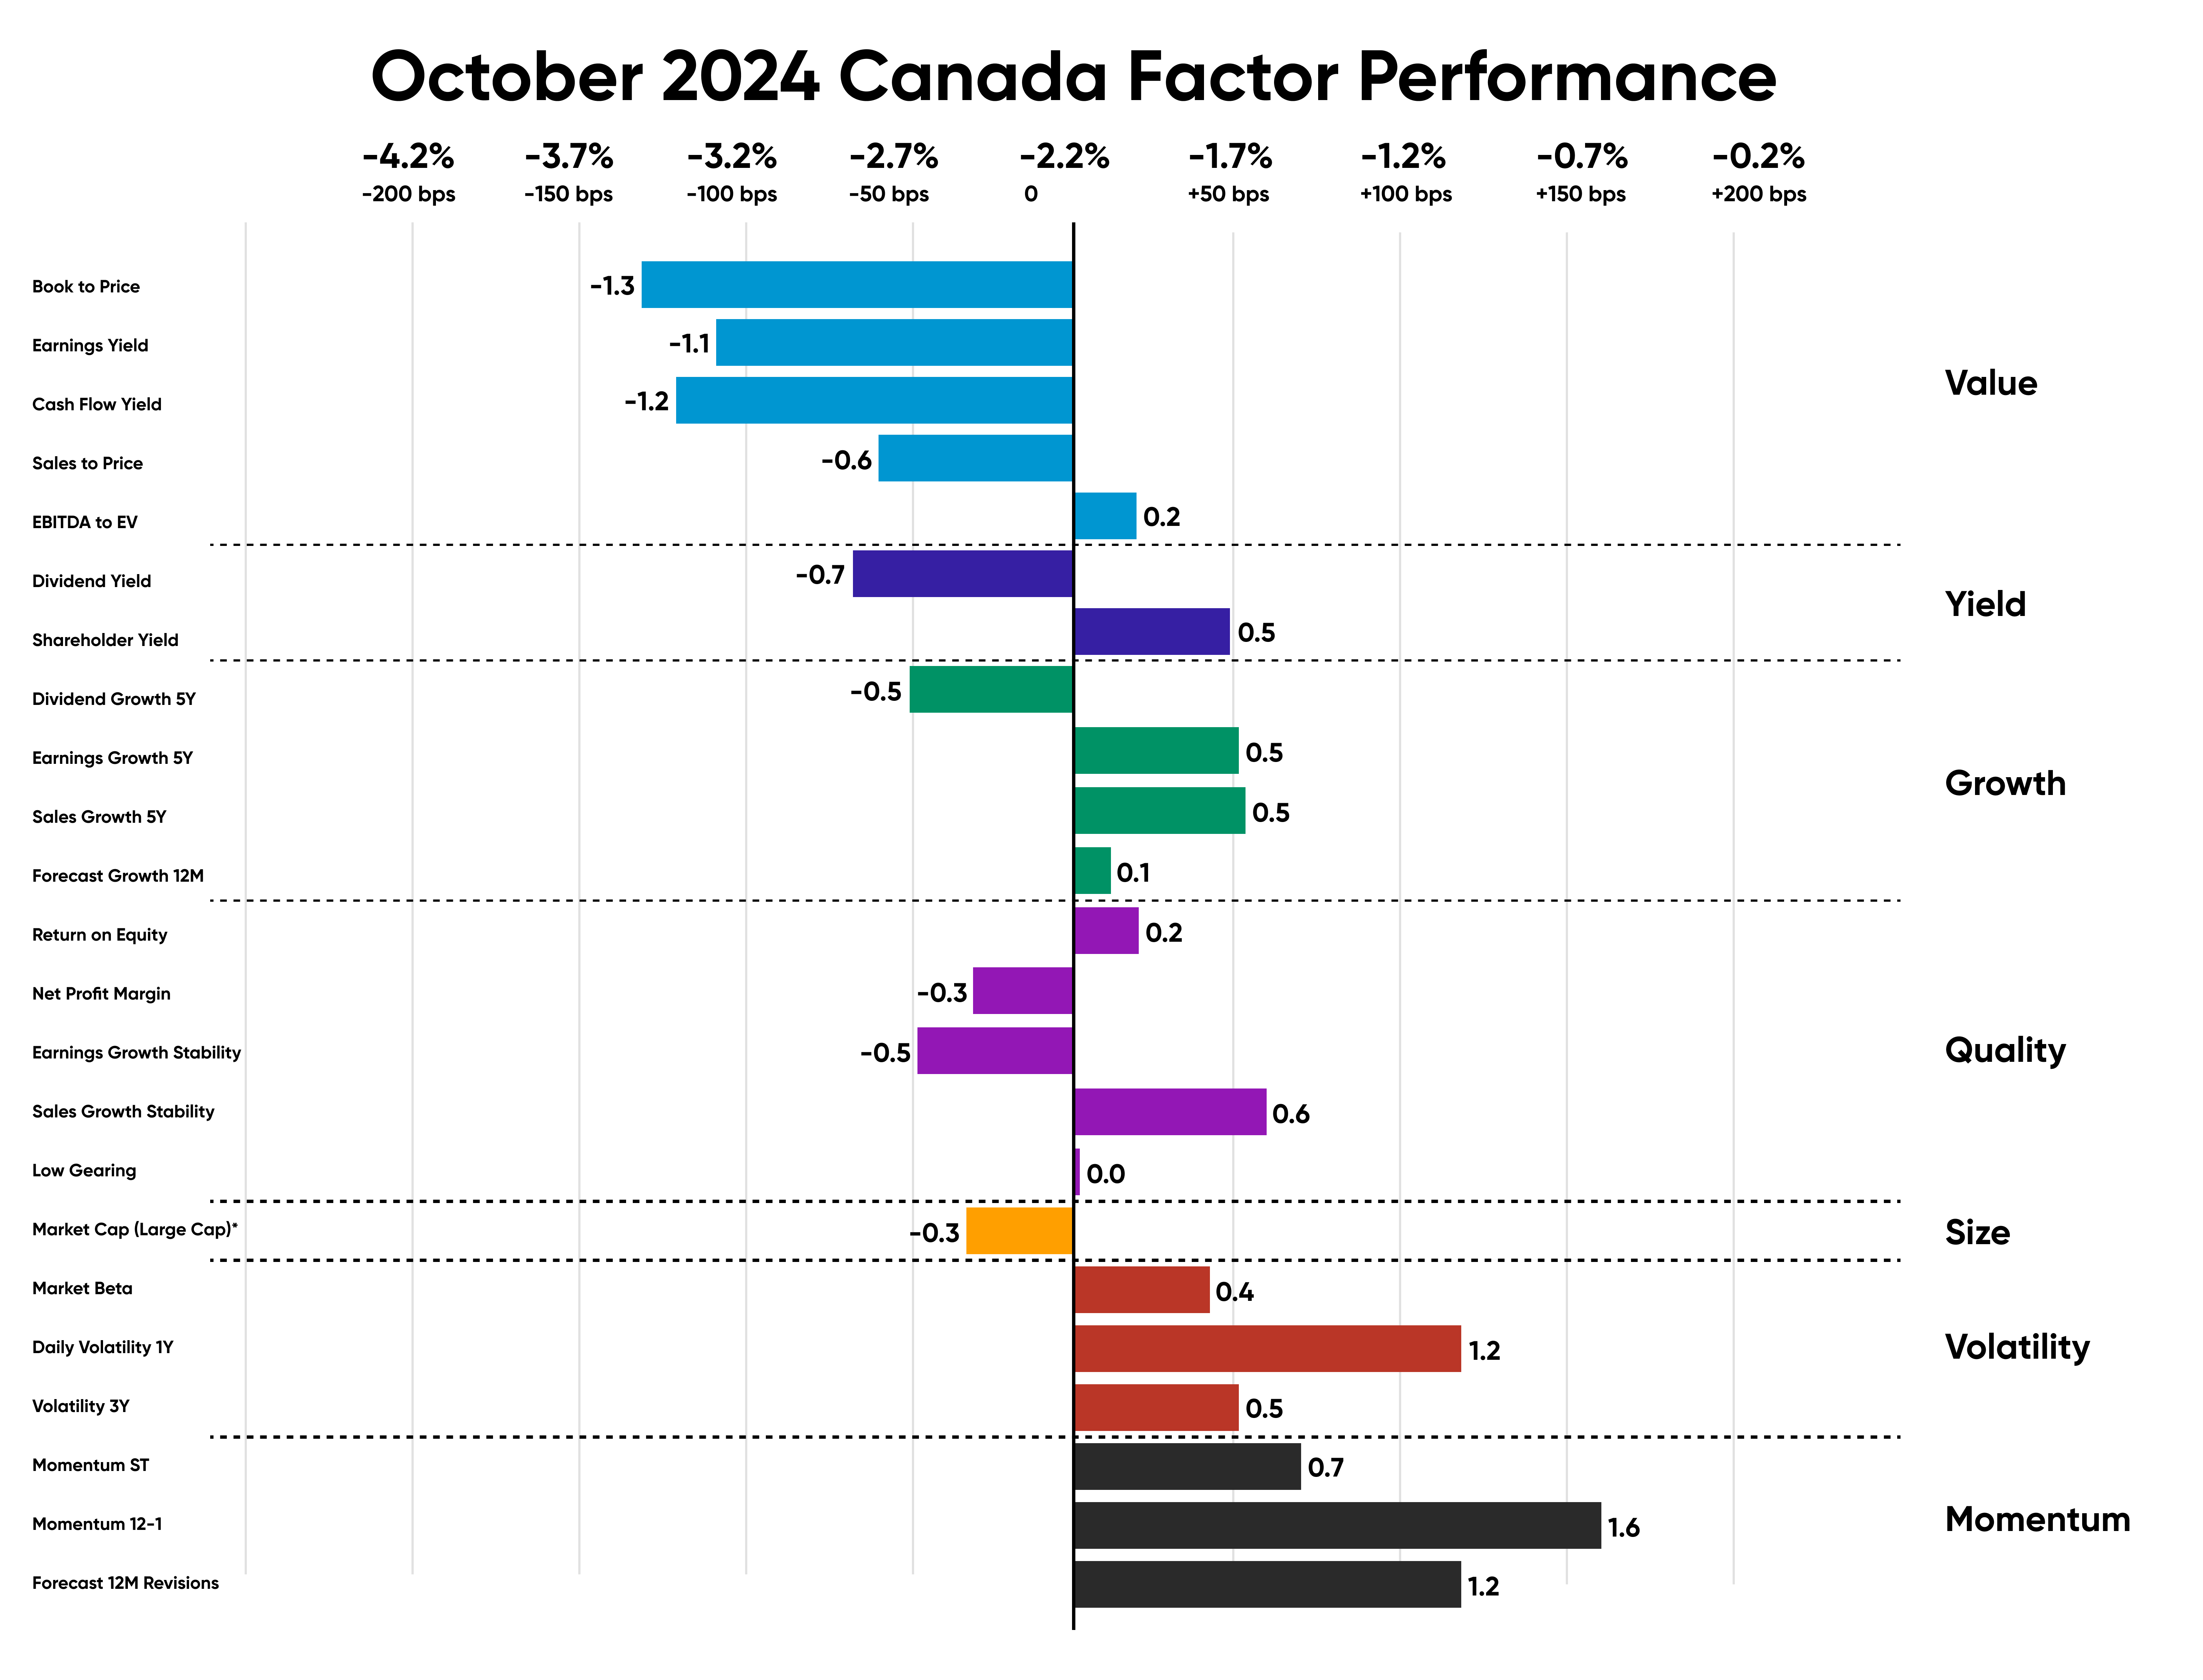
The factor performance trend in Canada favored Volatility and Momentum. Among Growth, like the previous month, all subfactors outperformed except for dividend growth 5Y. Value and Yield were the leading detractors of the region's performance, while Quality exhibited a mixed trend.
Canada's annual inflation rate dropped to 1.6% in September 2024, down from 2% in the previous month, marking the lowest since February 2021. The employment rate declined to 60.7% in September, down from 60.8% in August 2024.
Stocks with strong momentum of 12-1 in the region that outperformed include financial companies Canadian Imperial Bank of Commerce (+1.8% in October) and energy company TC Energy (+7.0% in October).
Key companies driving the volatility 1Y in October were energy companies Canadian Natural Resources Ltd (+2.2% in Oct) and Suncor Energy Incorp (+2.0% in Oct).
Source: Confluence Style Analytics
Appendix: How to read the charts
Each factor’s performance is based on the relative performance of its top 50% of stocks by market cap, compared to the overall market. The Size factor uses the top 70% of stocks, as the only exception.
For example, for the book-to-price factor, we determine the period’s performance of the basket of stocks with the highest book-to-price values, relative to the total market. Each factor is analyzed independently, market and fundamental data are adjusted to enable sector-average (within each country) relative data to be used, and the performance measurement isolates the factor’s contribution to return.
Disclaimer
The information contained in this communication is for informational purposes only. Confluence is not providing, legal, financial, accounting, compliance or other similar services or advice through this communication. Recipients of this communication are responsible for understanding the regulatory and legal requirements applicable to their business.About Confluence
For more information, visit confluence.com


