October 2023
Factor Performance Analysis
Quality shows strength world-wide during market downturn
by:
Market Background
The trends observed entering Q3 persisted in equity markets, notably with Quality stocks outperforming across all regions during the downturn. Surprisingly, every region, except Europe, favored Quality equities over Volatility, Growth and even Value, contrary to Value stocks’ typical outperformance during downturns.
Inflation remains persistently higher than central banker’s target rates exhibiting slow-receding trends in some regions while holding steady in others. Notably, core inflation in developed countries has begun to recede, suggesting a slow normalization in prices outside of the food and energy sectors.
Yields continue to rise following increases in the federal funds rate. The US 10-year yield reached 4.77% in October, with the 10-year GILT reaching a high of 4.558%. Although long-term German yields increased as well, they remained nominally smaller than their English counterparts at 2.8%.
After a brief spike to $90/barrel in September, crude oil retreated to $80/barrel in October. Despite this dip, prices remain elevated compared to the year’s earlier average of $70/barrel. Rising conflicts in the Middle East pose potential uncertainties for oil prices in the remaining months of Q4.
Natural gas prices increased to $3.4/MMBtu from $2.9/MMBtu as winter demand surged. However, this is significantly below the levels observed due to the demand for gas in Europe resulting from the Russian-Ukrainian war, which saw prices remain elevated even throughout the summer months in 2022 up to $9/MMBtu.
Factor Summary
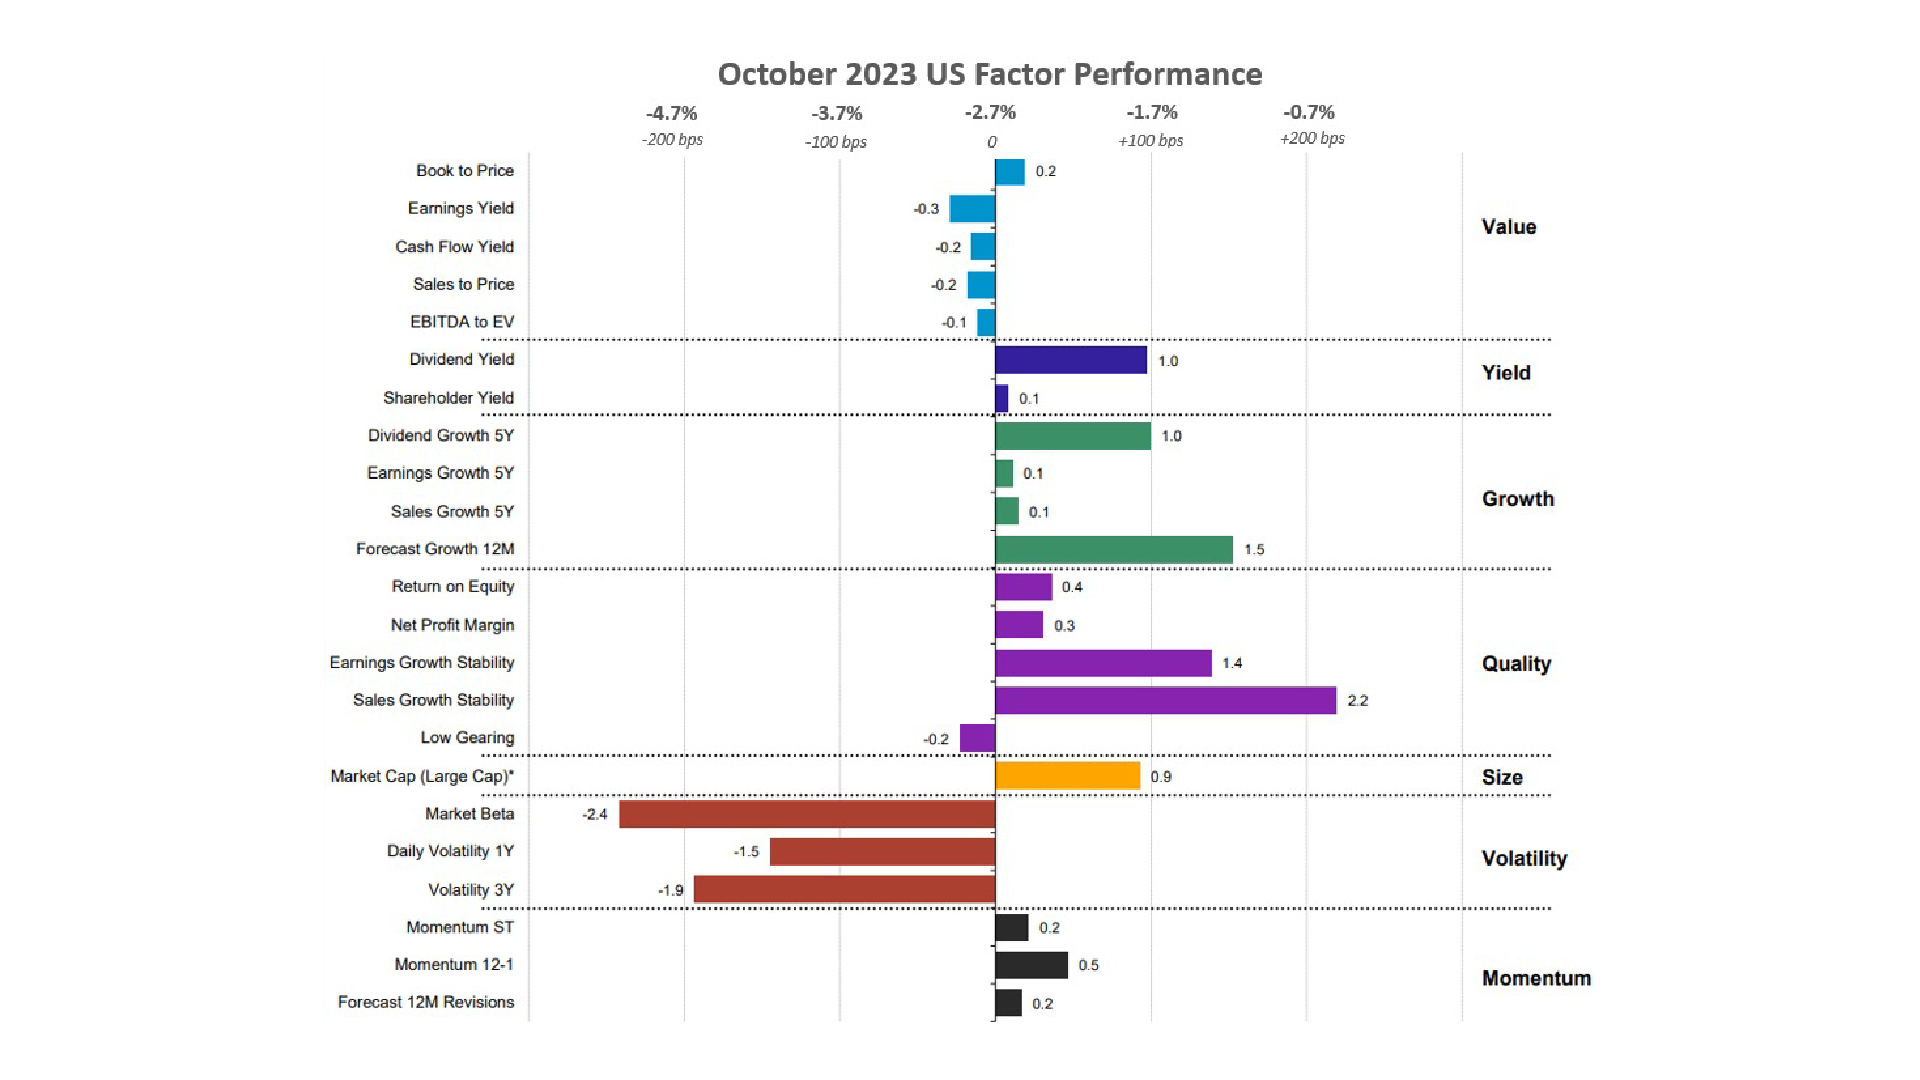
- US Equities: Quality, Yield and stocks with high forecast growth outperformed; Volatility underperformed.
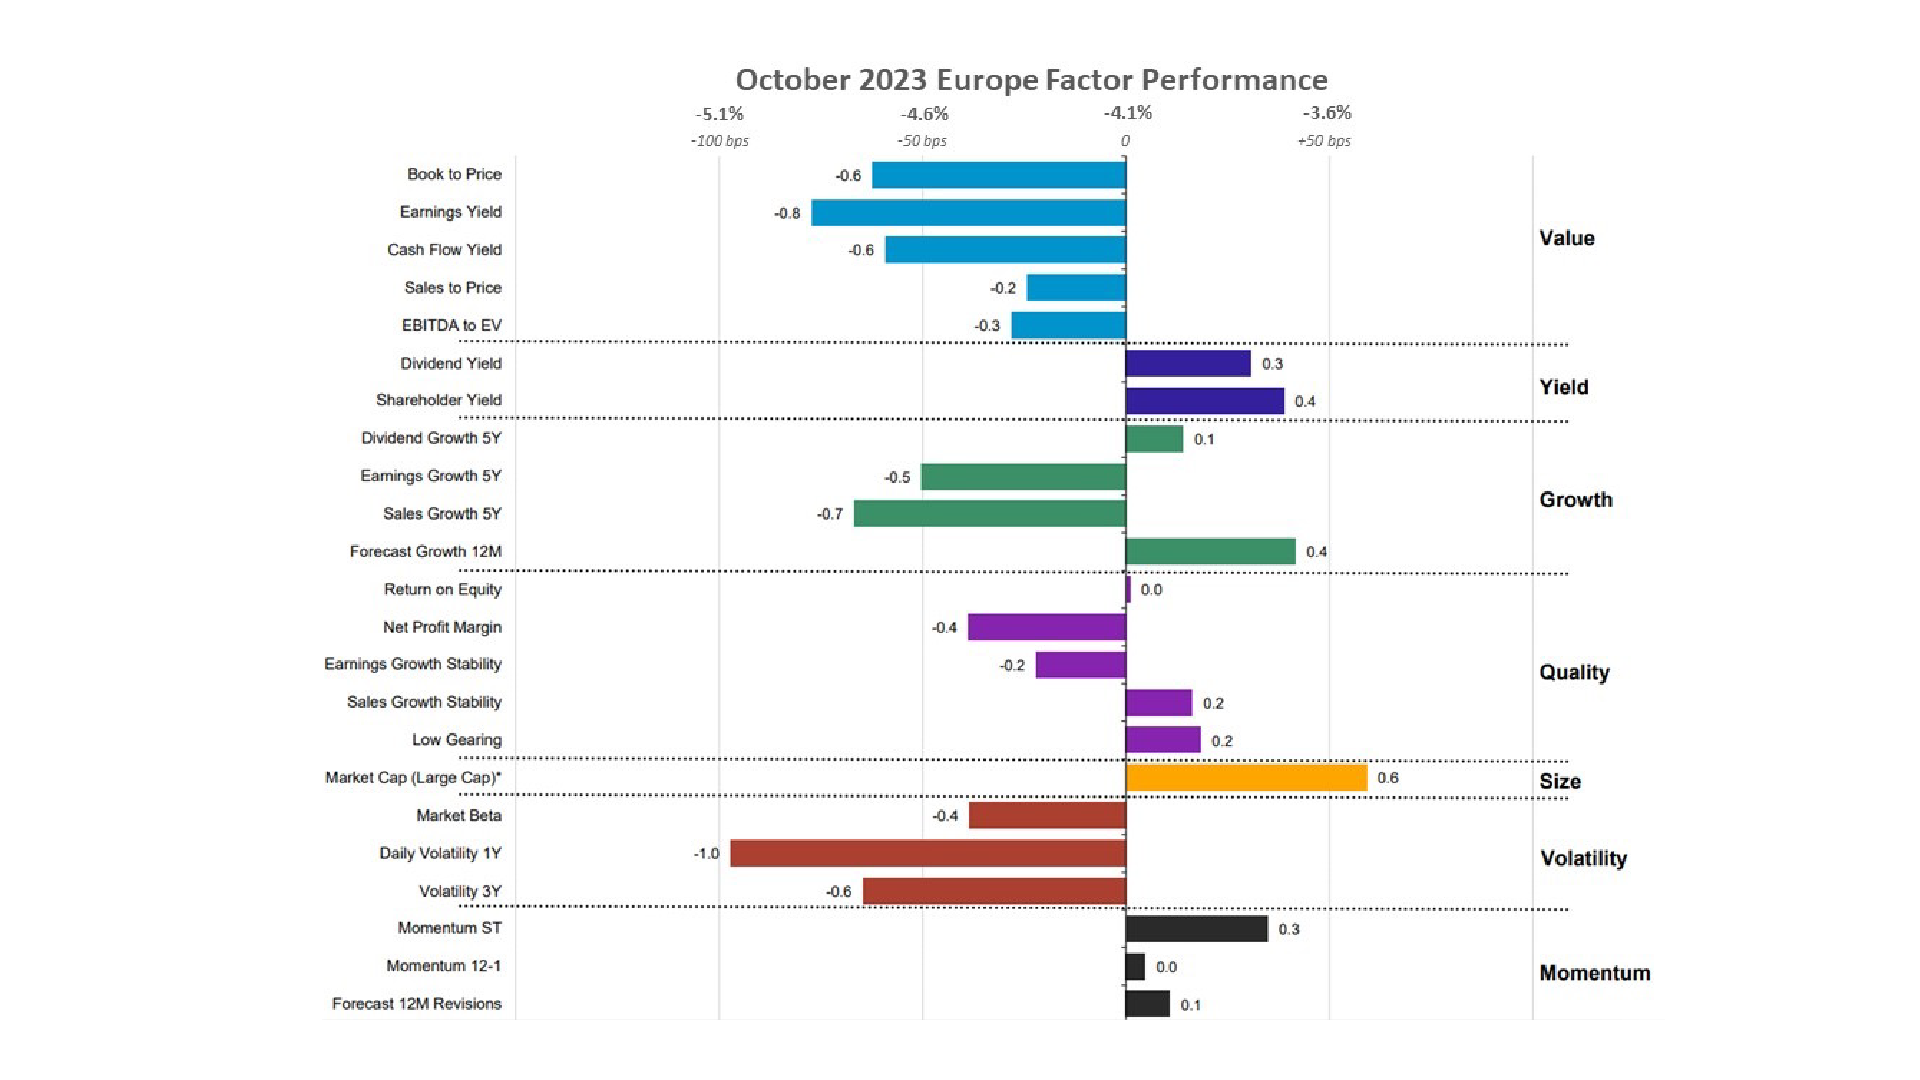
- Europe: Size, Yield, and stocks with high forecast growth outperformed; Volatility underperformed.
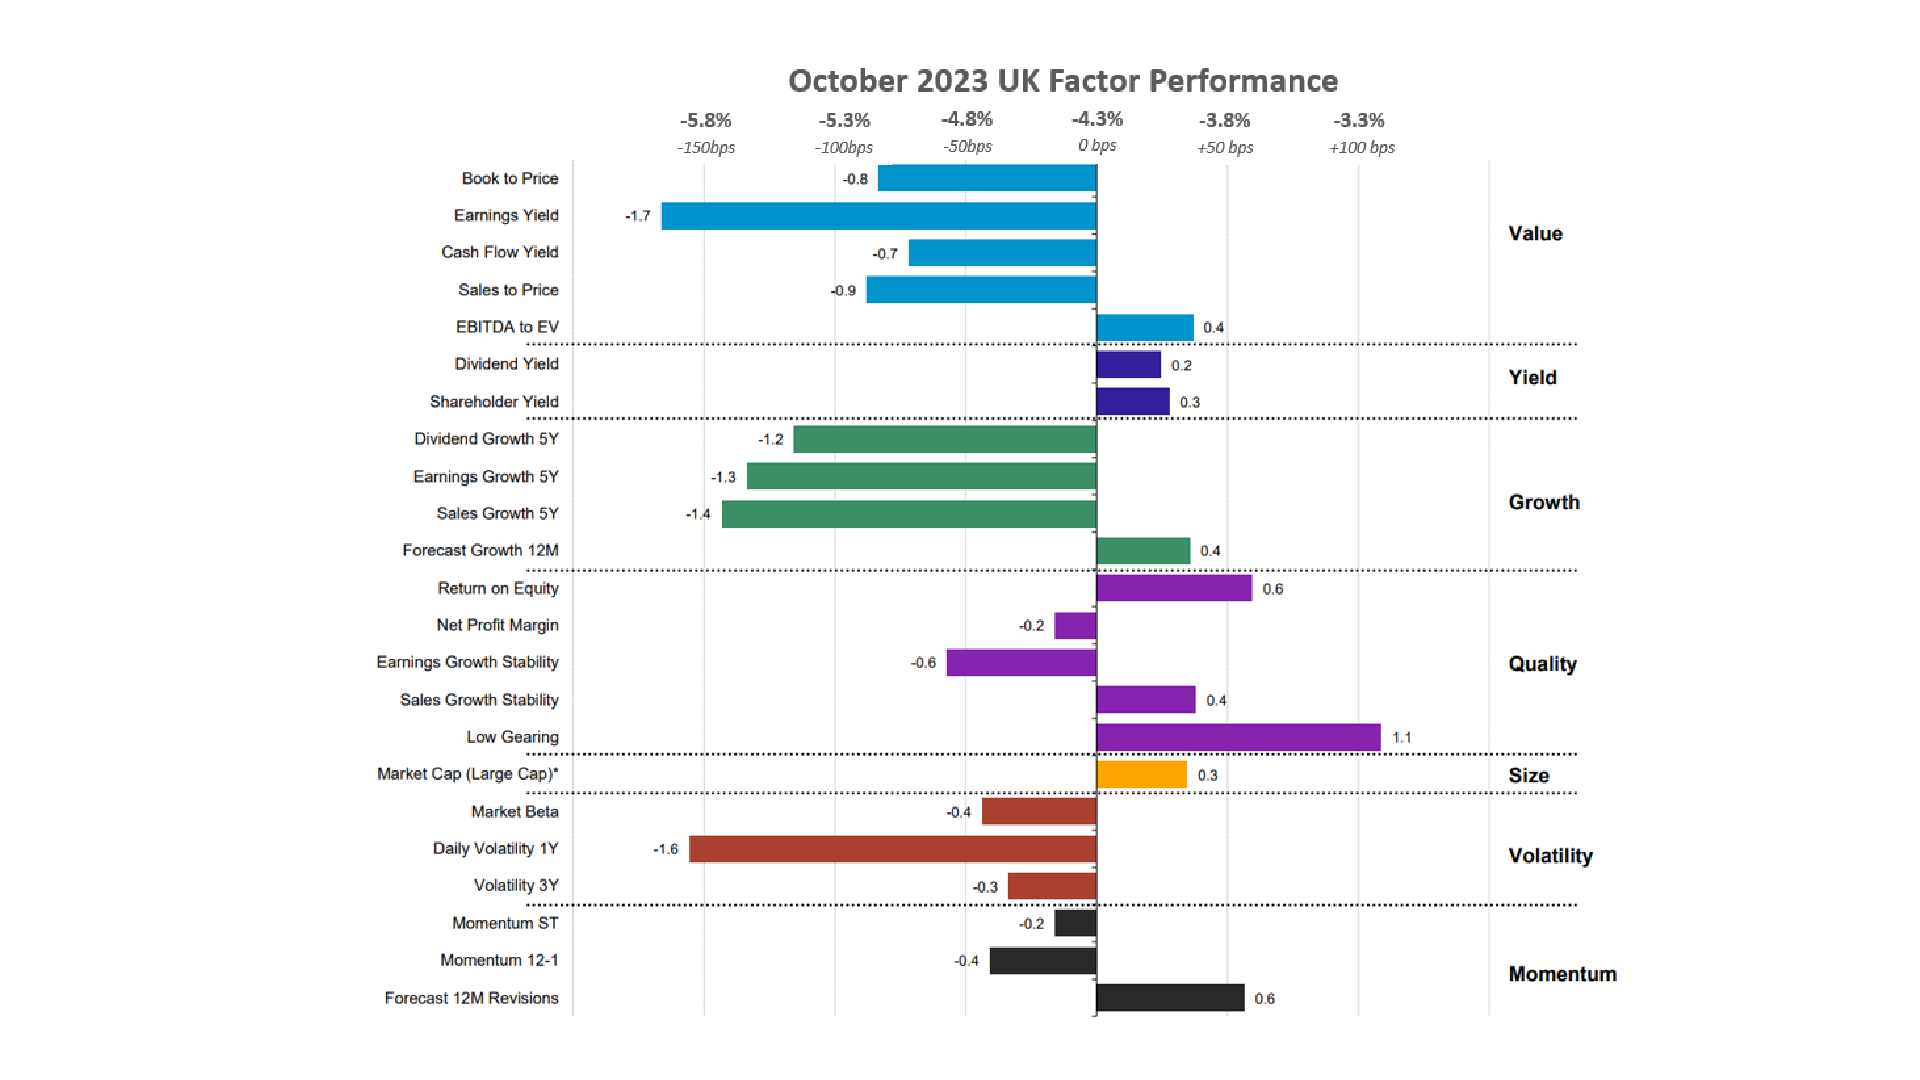
- UK: Quality outperformed, especially stocks with low levels of debt; Value, Growth and Volatility underperformed.
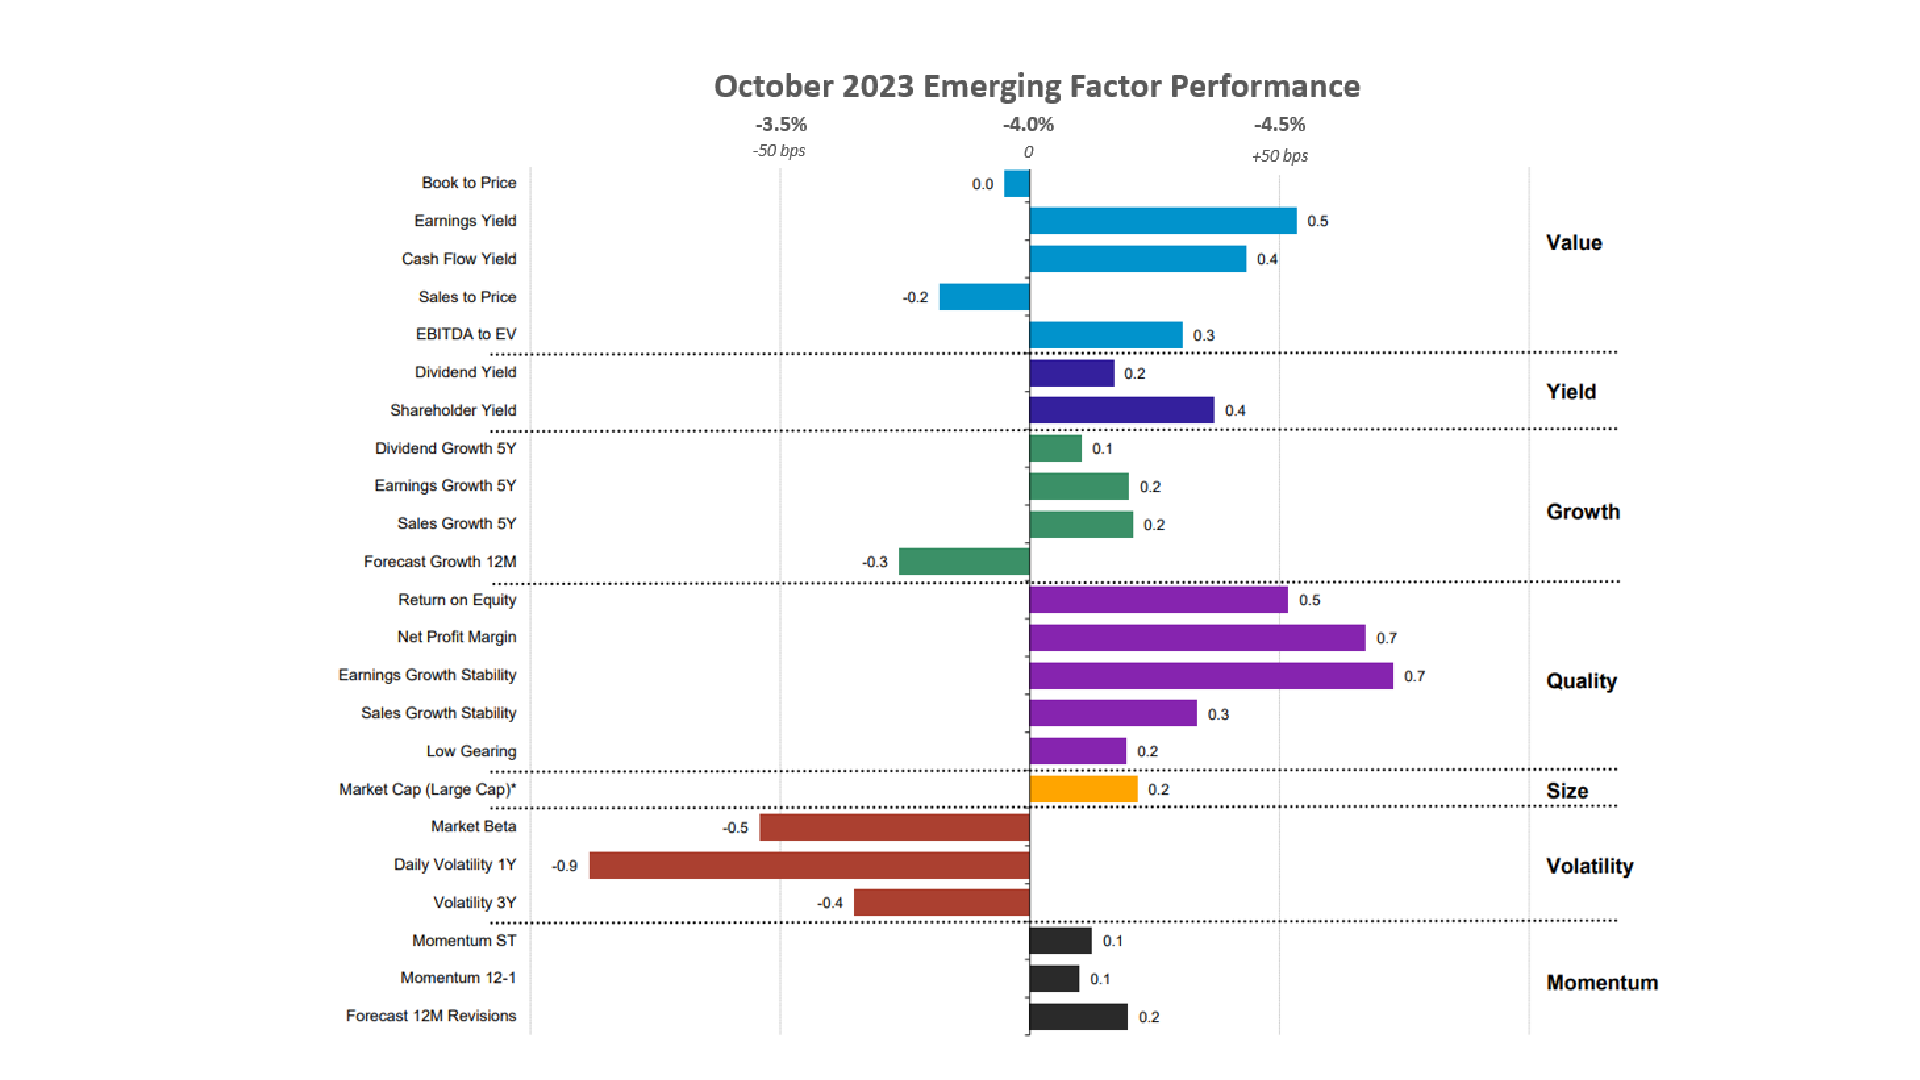
- Emerging Markets: Quality, Value, Yield outperformed; Volatility underperformed.
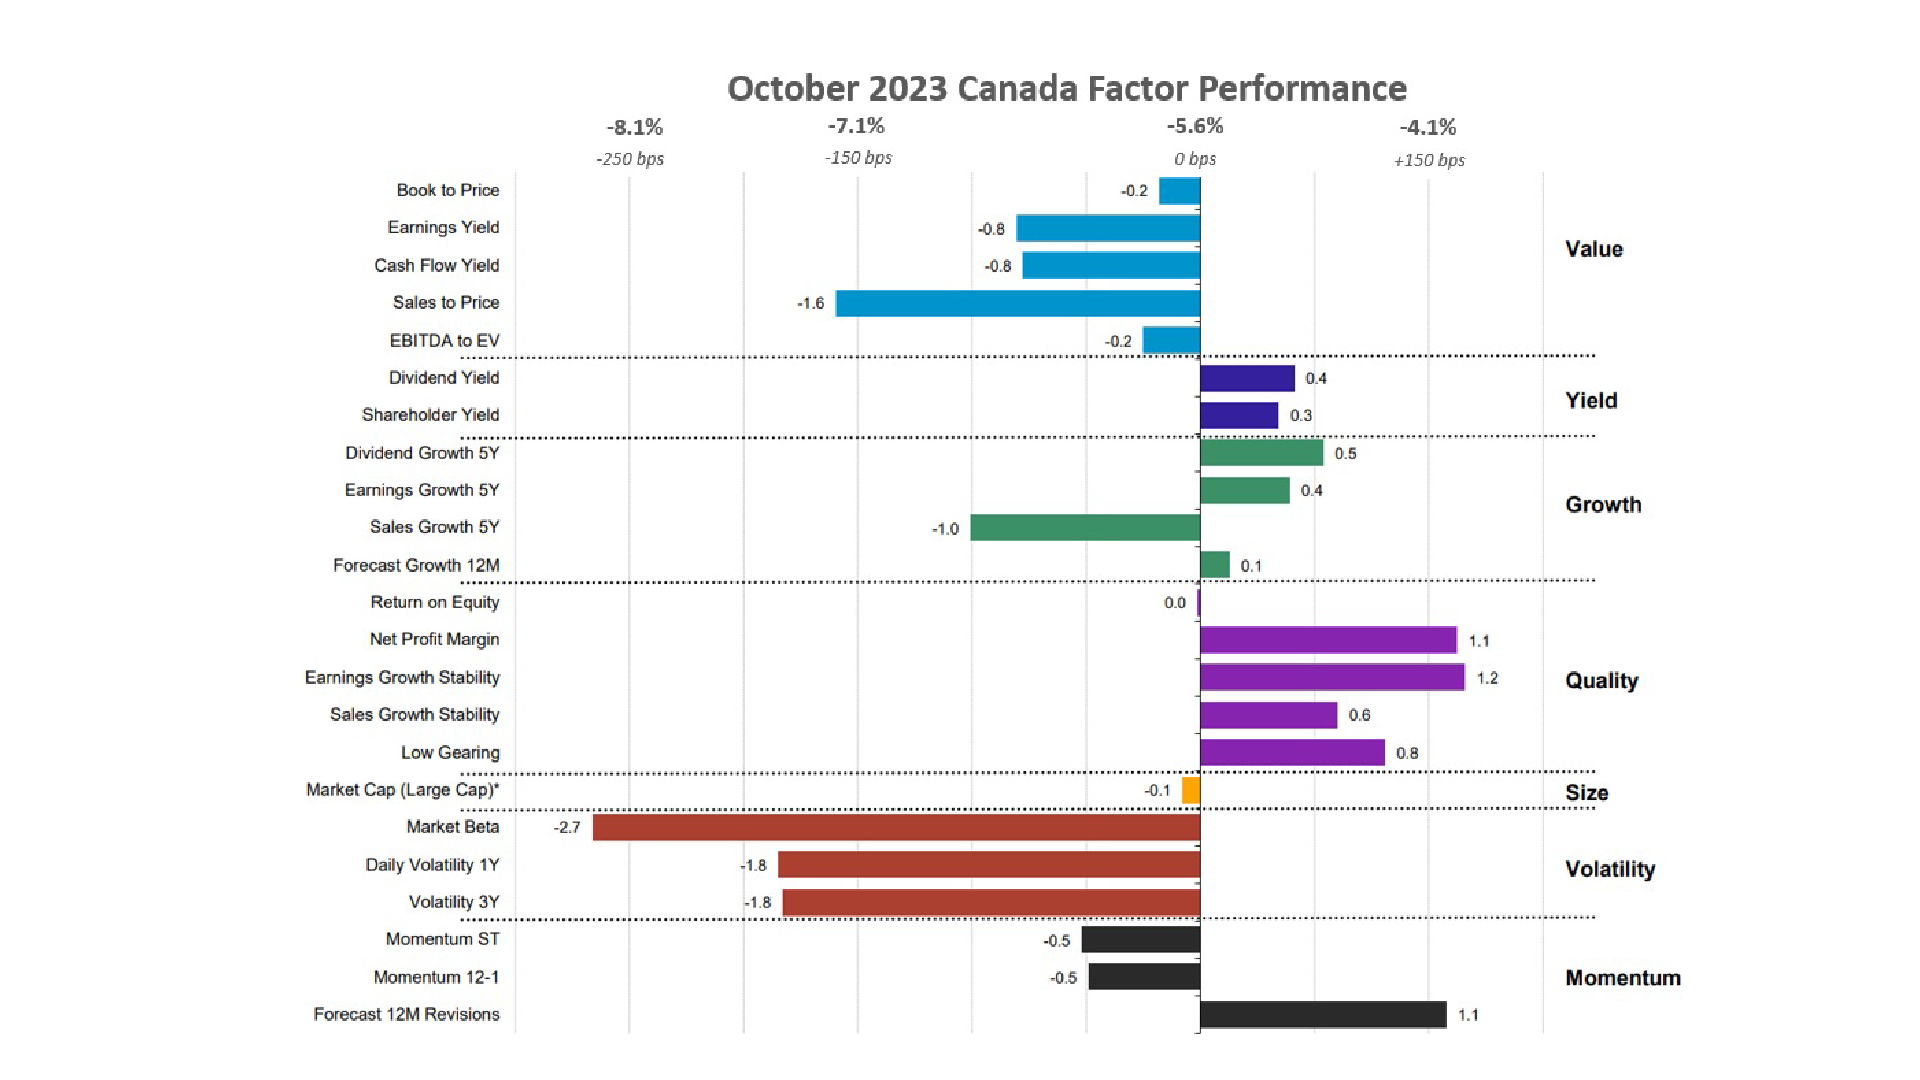
- Canada: Quality, Yield, Growth outperformed; Volatility significantly underperformed.
US Equities
This trend is intriguing, especially considering that European growth trends now align with those in the US since Europe had favored Value for months, contrasting with the US’s preference for Growth throughout the year. Even in Canada, equities with robust dividend growth also outperformed their respective market. However, this indicates a focus on Yield rather than Growth, as other Growth subfactors underperformed in Canada.
While the overall inflation rate remained steady at 3.7% in September, core inflation did fall from 4.3% to 4.1% in September, marking the sixth consecutive monthly decline this year. Jerome Powell’s recent comments solidified the notion that the Fed plans to maintain rates at their current threshold of 5.25% – 5.5%, concurrently reducing the Fed’s security holdings through contractionary monetary policy.
Despite a cooling labor market in the latter half of the year, as indicated by the ADP National Employment Report, October witnessed the addition of 113k new workers to payrolls. Although slightly below market expectations of 150k, this figure falls within the 70k-100k range required to accommodate the expanding working population. This suggests the labor market remains robust even amid the Federal Reserve’s tightening measures.
Within Quality, sales growth stability continued to outperform all other Quality subfactors, led by stocks like Microsoft (+7%) which regained losses from the last quarter as well as Lockheed Martin (+11%) and Progressive Corp. (+13%). On the other hand, high-beta stocks underperformed by an even more significant margin, weighed down by companies like Tesla Inc. (-19%); Caterpillar Inc. (-16%) and Thermo Fisher Scientific Inc. (-12%), the latter losing over 18% over the last 90 days as well.
Source: Investment Metrics, a Confluence company
European Equities
However, despite Value has been a focus for European investors over the past year, October marked the first month where Value fell out of favor. In the absence of Value, large-cap Yield stocks took the spotlight as they outperformed the market.
During the summer, there was interest in stocks with high forecasted growth over twelve months, which shifted towards stocks with high dividend growth over five years. Although forecast growth stocks performed better than dividend growth stocks this month, it is interesting to see both subfactors outperform again as European investors gravitate toward companies with growing yields but also with positive forecasted growth.
In Europe, inflation is gradually receding, with September data revealing a 15-basis point drop in the core inflation rate to 5.15%. Although still twice the ECB’s target rate, this represents a noticeable decrease from the average of 6.3% observed in the first half of the year.
The HCOB German Manufacturing PMI remained below 50 in October at a value of 40.8, signaling an overall decrease in manufacturing compared to September. While an improvement from the average of around 46 in the first half of the year and a low of 37 in July, the trend in European manufacturing remains negative throughout the year.
Large-cap companies stood out in the European market this month, with notable gains from Novo Nordisk (+4%), which returned nearly 20% in the last 90 days; Turkish financial services company Turkiye Kalinma (+104%); French info tech company Dassault Systemes (+9%); and Polish-based Santander Bank Polska SA (+31%).
Source: Investment Metrics, a Confluence company
UK Equities
While both regions exhibited similar performance, the UK underperformed the European Union in October, reversing its over 6% outperformance in September. Notably, investors did not exhibit a direct preference for Value or Growth equities; instead, their focus centered on Quality companies adept at managing debt levels effectively. The emphasis on return on equity and forecasted growth suggests a preference for stable stocks with the potential for growth over the next year. Return on equity outperformed both dividend growth by 180 basis points and dividend/shareholder yield, reinforcing the notion of Quality Growth stocks potentially outperforming Yield.
The S&P Manufacturing PMI in the UK mirrored the manufacturing story observed in Germany, peaking at 49 in the beginning of 2023, falling to 43 at the end of the summer, and rebounding to 45 in October. A value below 50 indicates a contraction in manufacturing over the previous month, signifying a decline in UK manufacturing since the last inversion point in July 2022. The GfK Consumer confidence indicator in the UK has consistently increased, except for July and October, when the index fell to -30 from a high of -21.
UK Value investors have preferred stocks with high EBITDA-to-EV ratios again this month, uncovering a surprising preference for this metric compared with Value investors in other developed markets. However, this trend is shadowed by the performance of companies with high low-gearing values, which returned nearly three times that of EBITDA-to-EV stocks this month.
British firms that have managed their debt well and provided outsized returns this month include Admiral Group PLC (+15%), Medical devices company Convatec Group (+10%), and marketing agency IWG PLC (+15%).
Source: Investment Metrics, a Confluence company
Emerging Markets Equities
The strategy of selecting high-quality Value stocks has proven to yield better risk-adjusted returns, as discussed in our article “Don’t Take Value at Face Value.” This trend is underscored in Emerging Markets this month, with all Quality subfactors outperforming. While Volatility performed well in the region in 2021, a reversal occurred in 2022 and continues to underperform in 2023.
Quality stocks with stable earnings growth outperformed in the region, led by Chinese health care company Hansoh Pharmaceutical (+38%); Saudi Arabian energy company ACWA Power (+16%); Misr Fertilizer Production Company (+55%); and Nestle India (+7%).
Source: Investment Metrics, a Confluence company
Canadian Equities
Canadian inflation slightly decreased from 4% to 3.8% in September, but core inflation fell by the largest margin this year, from 3.3% in August to 2.8% in September as food and energy prices propped up non-core inflation.
Canadian companies with stable earnings growth that outperformed the market heavy equipment marketplace RB Global (+5%); Gold producer Alamos Gold (+5%) and Calgary-based energy company Parkland Corp. (+4%).
Source: Investment Metrics, a Confluence company
Appendix: How to read the charts
Each factor’s performance is based on the relative performance of its top 50% of stocks by market cap, compared to the overall market. The Size factor uses the top 70% of stocks, as the only exception.
For example, for the book-to-price factor, we determine the period’s performance of the basket of stocks with the highest book-to-price values, relative to the total market. Each factor is analyzed independently, market and fundamental data are adjusted to enable sector-average (within each country) relative data to be used, and the performance measurement isolates the factor’s contribution to return.
Disclaimer
The information contained in this communication is for informational purposes only. Investment Metrics, a Confluence company, is not providing legal, financial, accounting, compliance or other similar services or advice through this communication. Recipients of this communication are responsible for understanding the regulatory and legal requirements applicable to their business.

