May 2024
Factor Performance Analysis
Equities Regain Momentum
by:
Market Background
Inflation in the eurozone is relatively low at 2.4% year-on-year compared to the United States. European economies seem to be rebounding after a prolonged period of stagnation and now demonstrate surprising strength.
Crude oil peaked at $79/barrel in May before easing to month-end prices at $76/barrel. In the first week of June, the price eased to a low of $73/barrel.
Gold prices continued to surge in May, peaking at $2,426/ troy ounce before stabilizing at $2,343 by the end of the month. Bitcoin made its all-time high in May, with mining capacity increasing by 5.0 EH/s. The dollar declined 1.5% in May after advancing for four consecutive months.
Factor Summary
- US Equities: Growth, Size, Volatility, and Momentum outperformed
- Europe: Value, Growth, Volatility, and Momentum outperformed
- UK: Value and Volatility outperformed
- Emerging Markets: Value, Yield, and Momentum outperformed
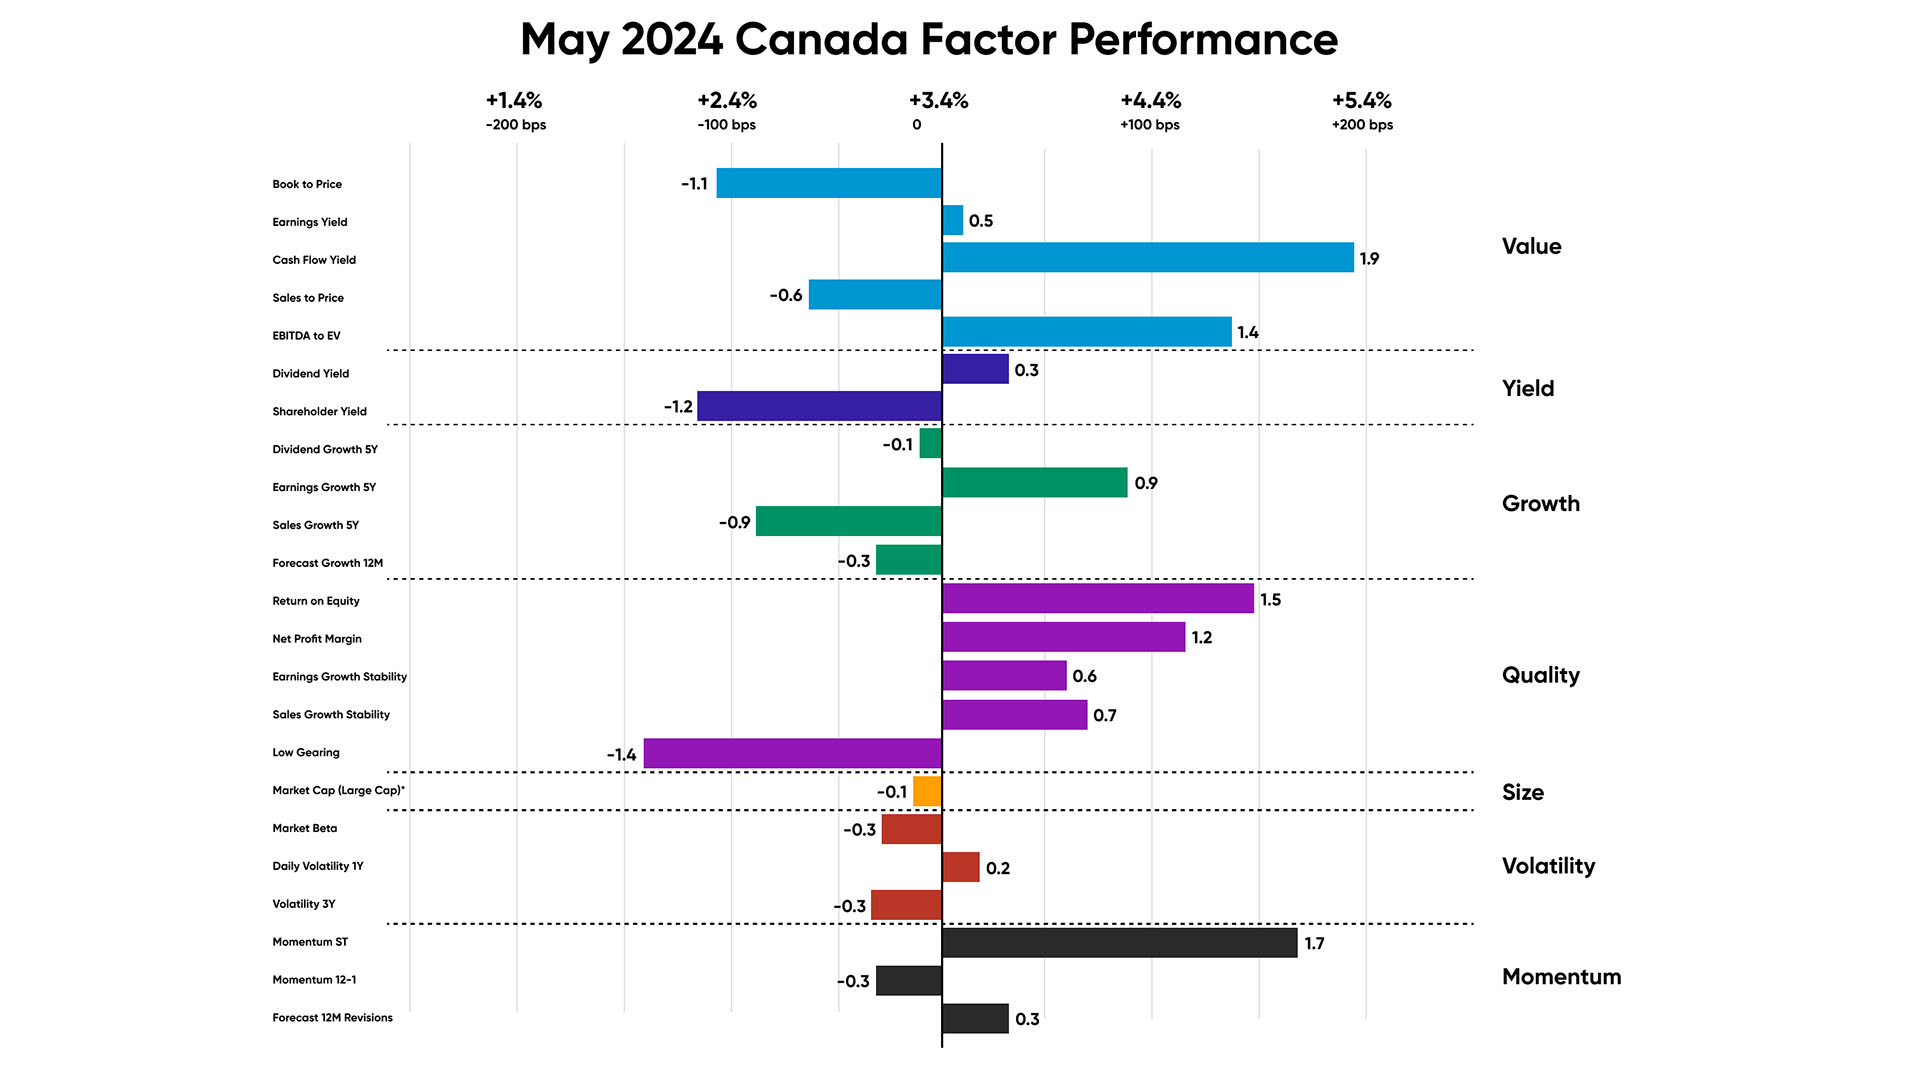
- Canada: Value, Quality, and Momentum outperformed

Figures 1: Regional relative factor performance (country and sector adjusted). Average of subfactors’ relative returns
Source: Confluence
US Equities
US economic growth, as measured by Gross Domestic Product, has slowed while inflation has risen. The growth was primarily driven by real wage increases and a reduction in household savings, whereas inflation was fueled by robust services consumption.
Stocks with resilient return on equity that contributed to the performance of the US market in May include the tech giants NVIDIA (27% in May), Apple (13% in May), Meta Platforms (9% in May) and Alphabet (6% in May). Additionally, companies with high forecasted earnings, including healthcare company Eli Lilly (+5% in May), industrials company General Electric (+2% in May), and utilities company Nextera Energy (+19% in May), also contributed to the outperformance.
Source: Confluence
European Equities
A positive trend was noted in Growth subfactors, particularly in sales growth over 5 Years and forecast growth for 12 Months, with the latter outperforming by 90 bps.
Eurozone inflation increased to 2.6% in May from 2.4% in April, and services inflation, a key metric for the ECB, rose to 4.1% from 3.7%. The Eurozone unemployment report shows that it hit a new record low of 6.4%. The number of unemployed people decreased by 100,000 from the previous month.
Key drivers of high-Value European stocks with stable book-to-price in the month of May include info tech company ASML Holdings (+6% in May), healthcare company Merck (+14% in May), and financials company BNP Paribas (+9% in May).
Companies with high forecasted earnings, including German financials company Muenchener Rueckversicher (+21% in May), French industrials company Safran (+8% in May), and French consumer staples company L’oreal (+5% in May), also contributed to the Eurozone’s outperformance.
Figure 3: May 2024 Europe Factor Performance (country and sector adjusted)
Source: Confluence
UK Equities
British inflation dropped sharply to 2.3% from the previous month’s 3.2%, yet it remains above the Bank of England’s 2% target. Core inflation, which excludes food and energy prices, remained persistent at 3.9%, while services inflation slightly eased to 5.9% YoY.
British stocks with a strong EBITDA to EV that outperformed this month include consumer staples company Unilever (+6% in May, +12% in the last three months) and BT Group (+29% in May, +26% in the last three months). Key drivers of high 3-year volatility companies that contributed to the outperformance include healthcare company GSK PLC (+8% in May, +8% in the last three months), industrials companies Rolls Royce Holdings Plc (+12% in May, +24% in the last three months), and Experian Plc (+13% in May, +7% in the last three months).
Source: Confluence
Emerging Market Equities
Emerging Markets equities that outperformed in the month of May, captured by the Momentum short-term subfactor, include tech company Taiwan Semiconductor (+5% in May, +17% in the last three months); Chinese communication services company Tencent Holdings Ltd (+4.5% in May, +25% in the last three months) and Indian materials company Hindustan Zinc Ltd (+64% in May, +126% in the last three months). Stocks with a steady dividend yield in the region that outperformed include Chinese companies from the communication services sector, China Mobile Ltd (+7% in May, +13% in the last three months), and from the financial sector, China Construction Bank (+9% in May, +14% in the last three months).
Source: Confluence
Canadian Equities
A notable trend in Canada was observed in Quality sub-factors, with an outperformance of 52 bps, with return on equity and net profit margin leading the trend. However, the underperformance in companies with low gearing hindered the performance.
Stocks with a steady cash flow yield in the region that have outperformed include energy companies Suncor Energy Inc. (+7% in May, +20% in the last three months), Canadian Natural Resources (+2% in May, +11% in the last three months), and materials company Agnico Eagle Mines (+8% in May, +42% in the last three months).
Key companies driving the momentum short-term performance in May were financials companies Royal Bank of Canada (+13% in May, +14% in the last three months), Manulife Financials (+12% in May, +11% in the last three months), and information and services company Thompson Reuters (+15% in May, +9% in the last three months).
Source: Confluence
Appendix: How to read the charts
For example, for the book-to-price factor, we determine the period’s performance of the basket of stocks with the highest book-to-price values relative to the total market. Each factor is analyzed independently, market and fundamental data are adjusted to enable sector-average (within each country) relative data to be used, and the performance measurement isolates the factor’s contribution to return.
Disclaimer
The information contained in this communication is for informational purposes only. Investment Metrics, a Confluence company, is not providing, legal, financial, accounting, compliance or other similar services or advice through this communication. Recipients of this communication are responsible for understanding the regulatory and legal requirements applicable to their business.
About Confluence
For more information, visit confluence.com


