Mandate Winners and Market Shareholders 3Q 23
Data derived from the Confluence Prism Analytics platform covers 80% of the top 20 institutional consultants as ranked by P&I
December 7th, 2023
by:
Consultants use the Confluence Portfolio Analytics and Reporting (PARis) platform to report results to institutional plans after the quarter. PARis allows consultants to provide comparisons at the plan and mandate/account levels. They can compare allocations, risk and return to other peer plans at the plan level. For example, a consultant can compare a $475M corporate DB plan to other corporate DB plans between $400M and $600M. At the mandate/account level, first, the consultant classifies the mandate into class, style, cap, etc. An actively managed US small cap growth (SCG) equity mandate, for example, could then be compared to peers’ actively managed US SCG equity mandates. In this example, the SCG mandate market share or actual fees paid could be compared to the Russell 2000 Growth.
With over 13,000 institutional plans managed in PARis, Asset Owners and Asset Managers can now use a platform based on one used by 80% of the top 20 consultants to understand buyer segments, track winning managers, analyze fee structures, monitor asset flows, identify market winners, and more.
Prism Analytics extracts the classifications to see flows at the channel level. For example, we can see if Taft-Hartley DB plans are buying US Small Cap Growth or Global High Yield. Prism Analytics users can see everything from the longevity of mandates to the post-negotiated fees paid for those mandates. They can also see net new mandates established and who is winning those mandates within both plan peer groups and asset manager peer groups. With those same peer groups, users can also measure market share by manager.
This analysis is primarily based on new mandates won and market share when using standard peer groups. The web-based platform enables users to view market share for something as specific as actively managed US SCG in separate account mandates between $1-$10M. Prism Analytics allows nearly endless customization. This view uses fairly common peer groups.
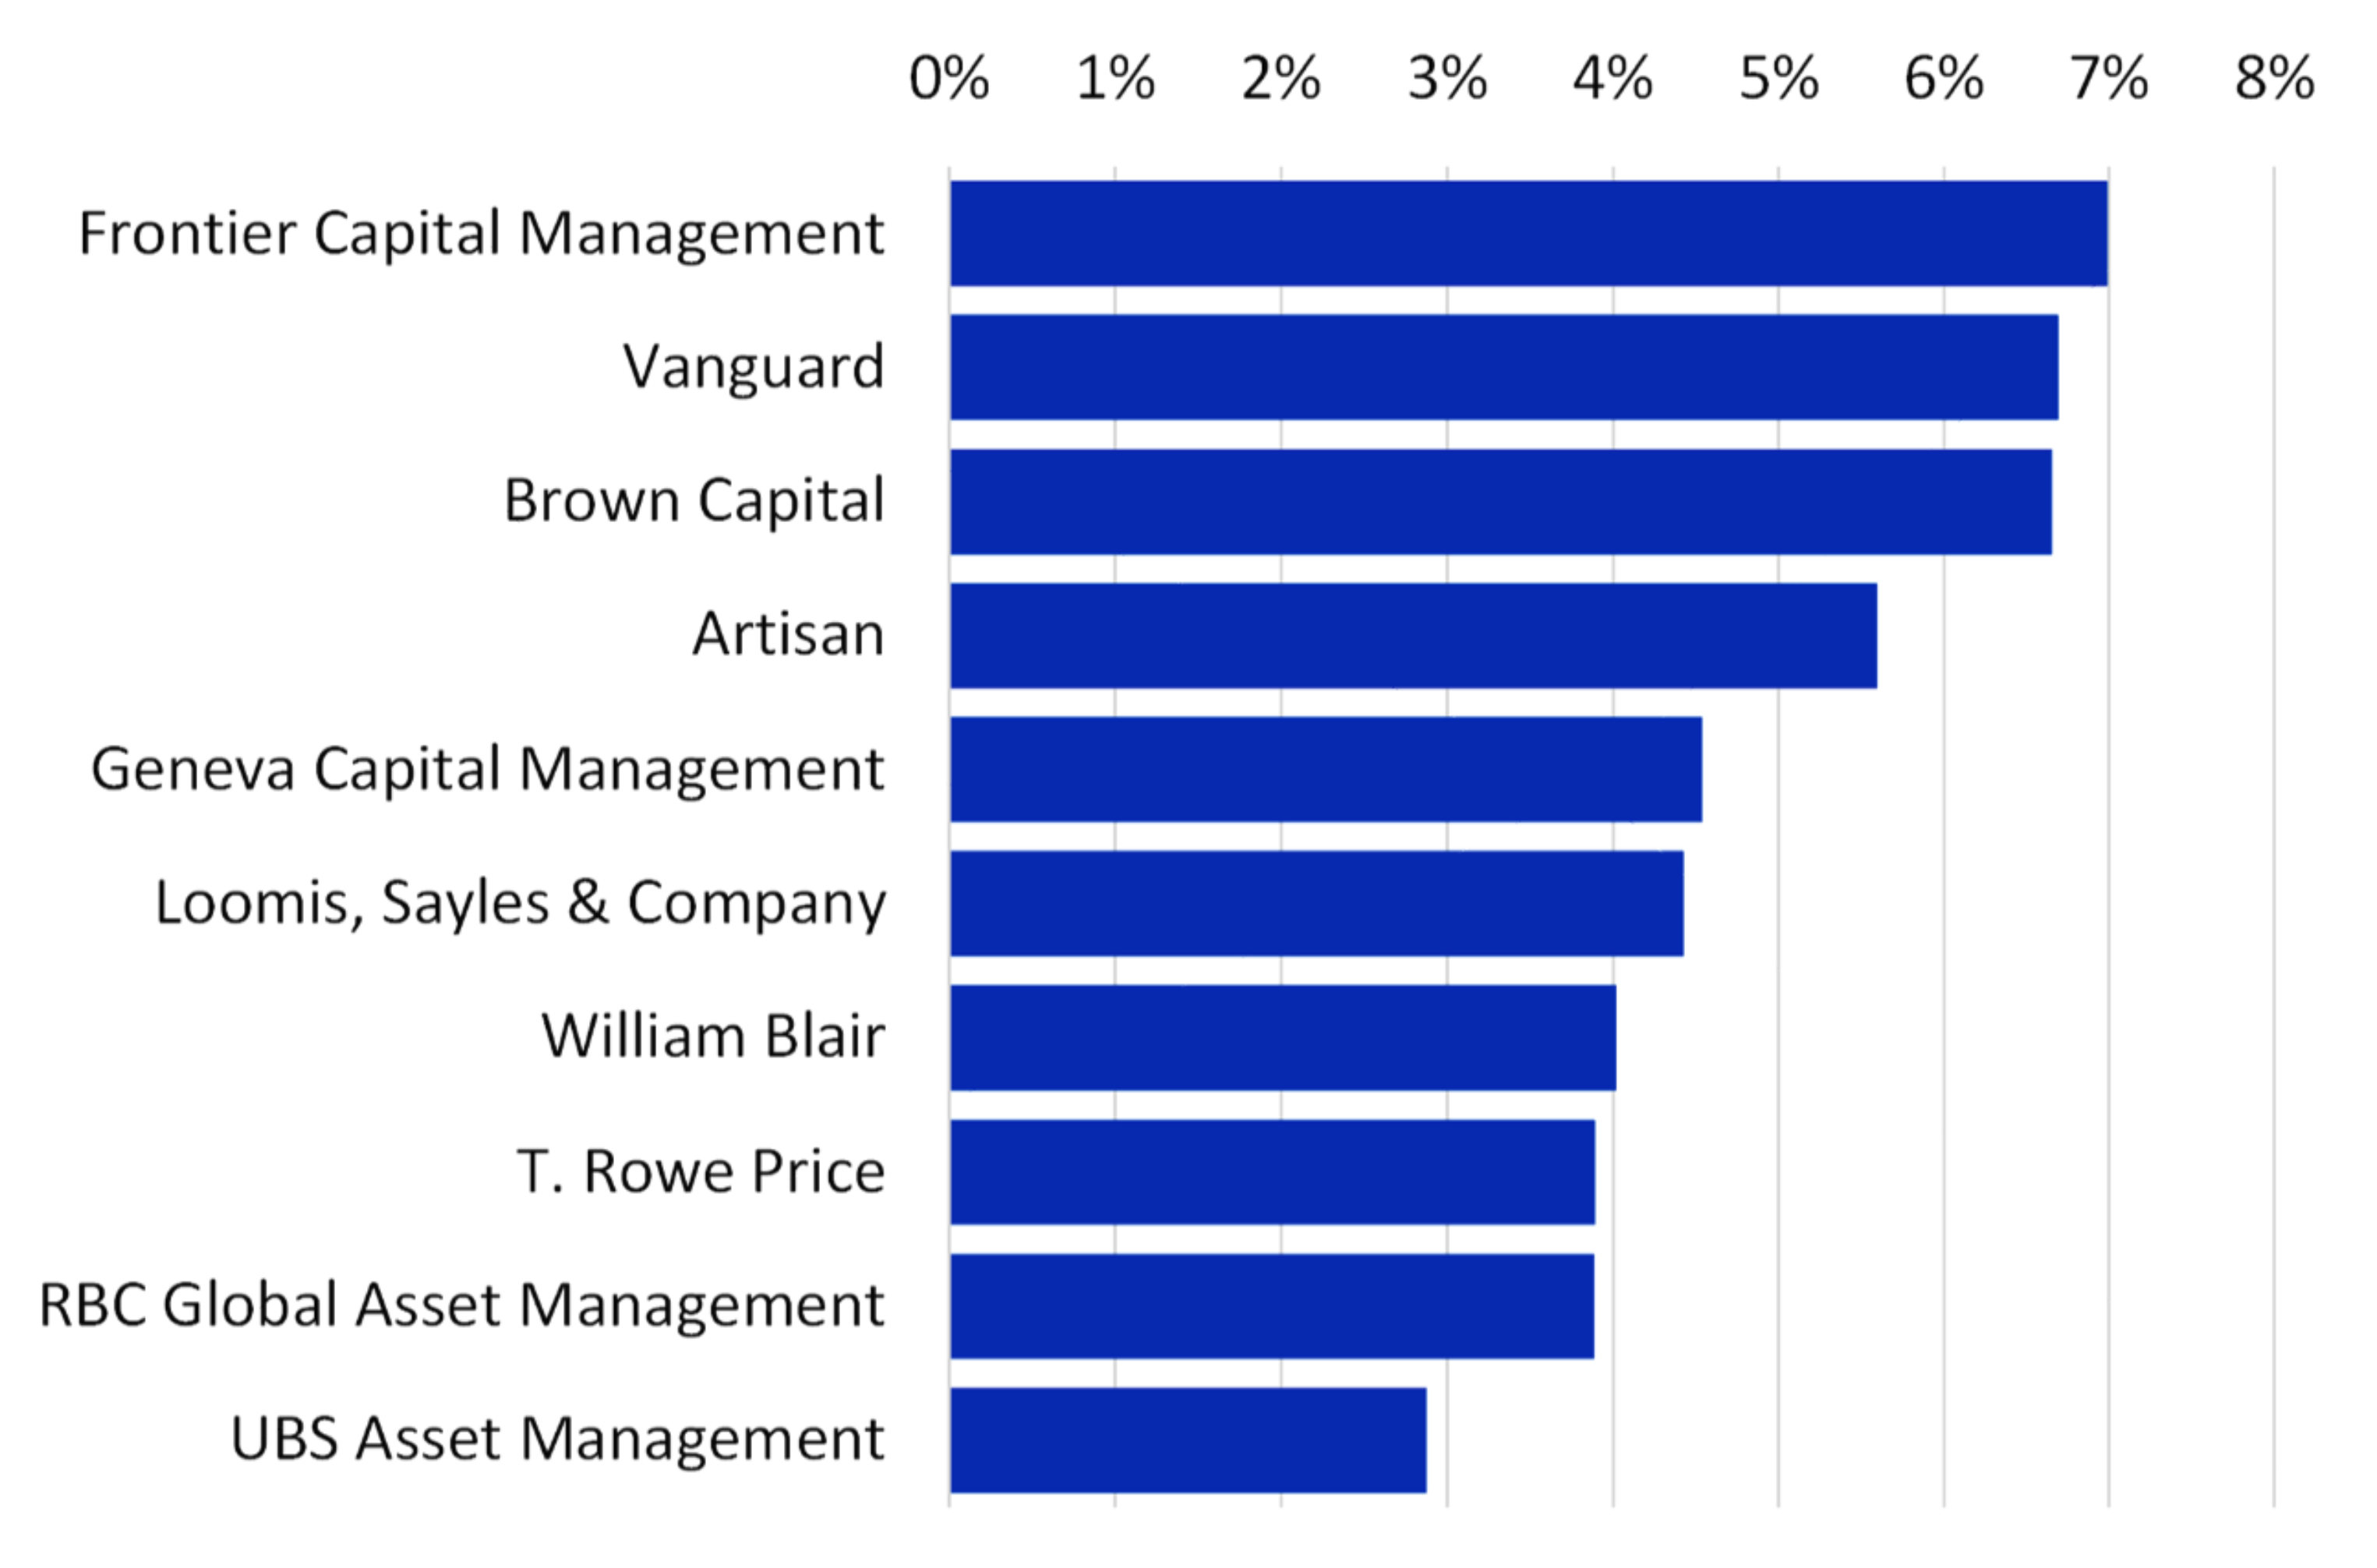
Actively Managed US Small-Cap Growth
Market share in actively managed small-cap growth is more evenly split between asset managers than some other actively managed equity universes in the US. The top 10 managers hold 50% of the market share.
US actively managed small-cap growth fees are higher than most other actively managed US equity universes. Actual fees to US SCG have a median of 80.00 bps for commingled or separate account vehicles.
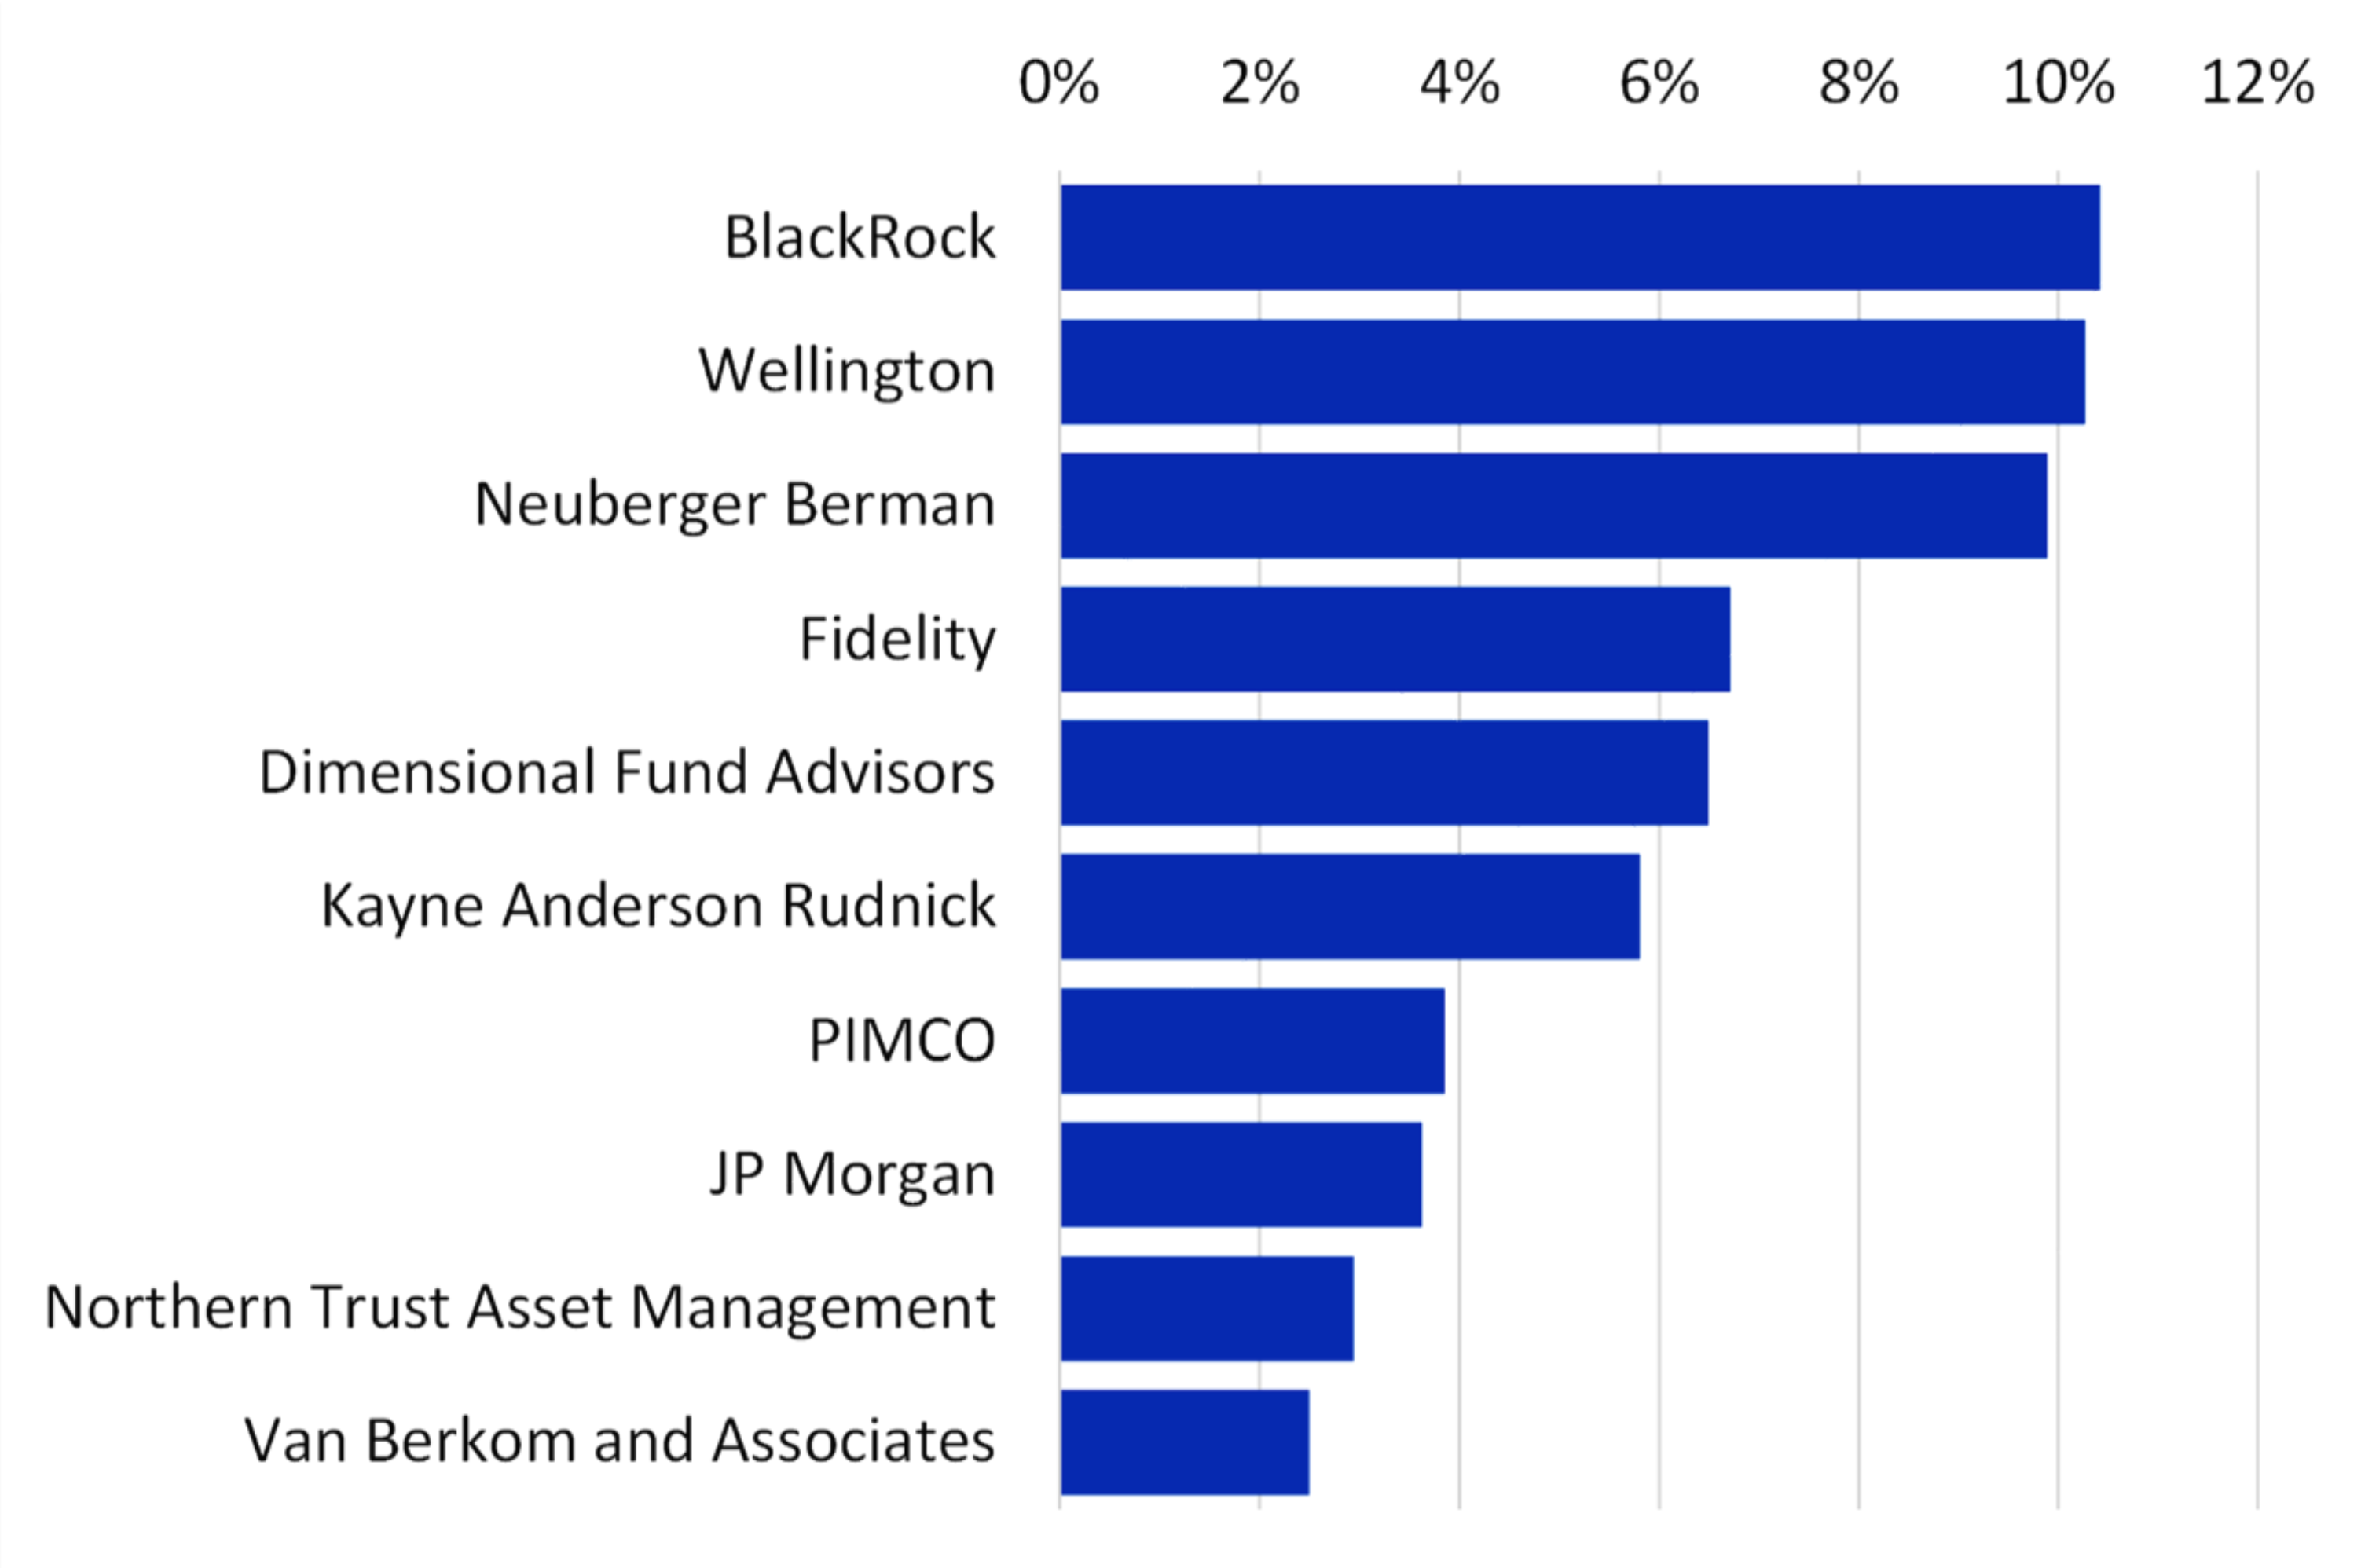
Actively Managed US Small-Cap Core
Market share in actively managed us small-cap core is more concentrated than small-cap growth. The top 10 managers make up 62.5% of assets. BlackRock leads in market share, followed by Wellington and Neuberger Berman.
Post-negotiated fees into actively managed US small-cap core are several bps below small cap growth. Fees for commingled and separate account vehicles for institutional plans in small cap core are 68.00 bps.
The top buyers for US SCC during 2023 were:
1. Public Defined Benefit
2. Endowments & Foundations
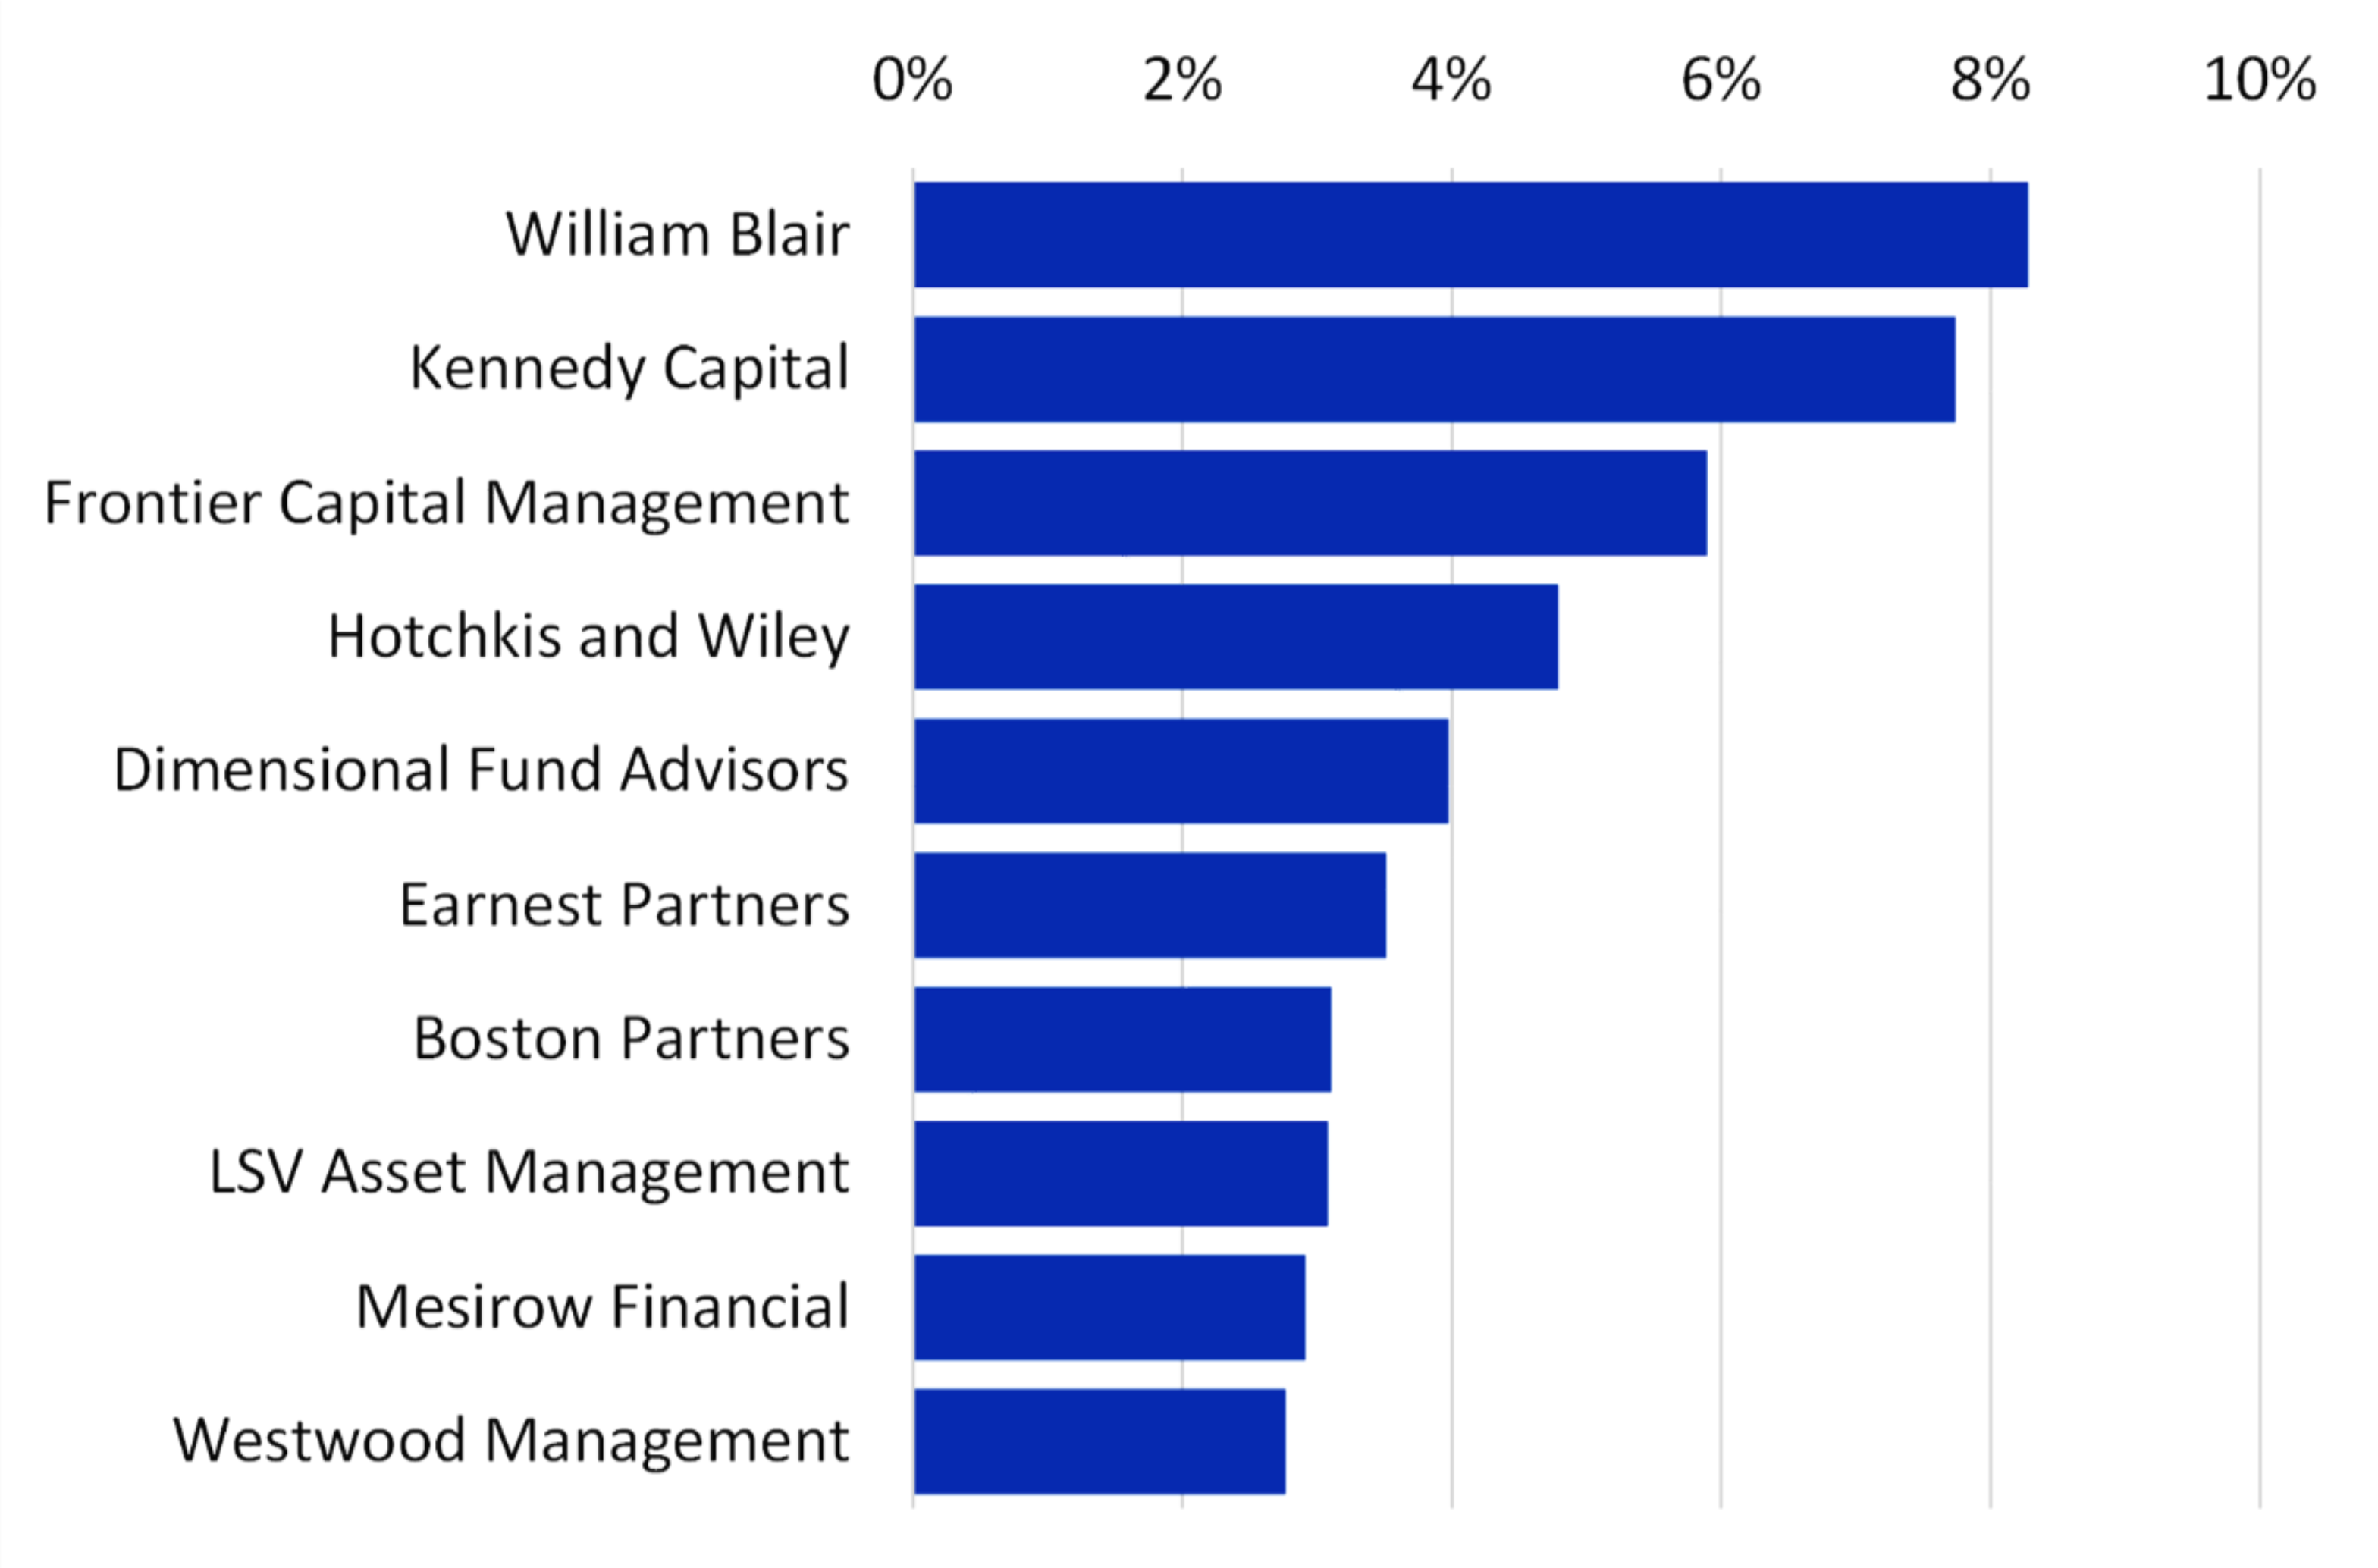
Actively Managed US Small-Cap Value
Market share in actively managed US small cap value is distributed compared to both growth and core. The top 10 market share holders only hold 44.0% of the US SCV market. William Blair, Kennedy Capital and Frontier Capital lead in market share.
Post-negotiated fees to actively managed US small cap value are above small-cap core but below small cap growth. The fee median for commingled and separate account vehicles in institutional plans is 75.00 bps for US small-cap value.
The top buyers for US SCV YTD 2023 were:
1. Endowments & Foundations
2.Public Defined Benefit
It is also important to note that operating reserve accounts purchased nearly as much US SCV and Public DBs. These operating reserve plans were typically on Healthcare in this instance.
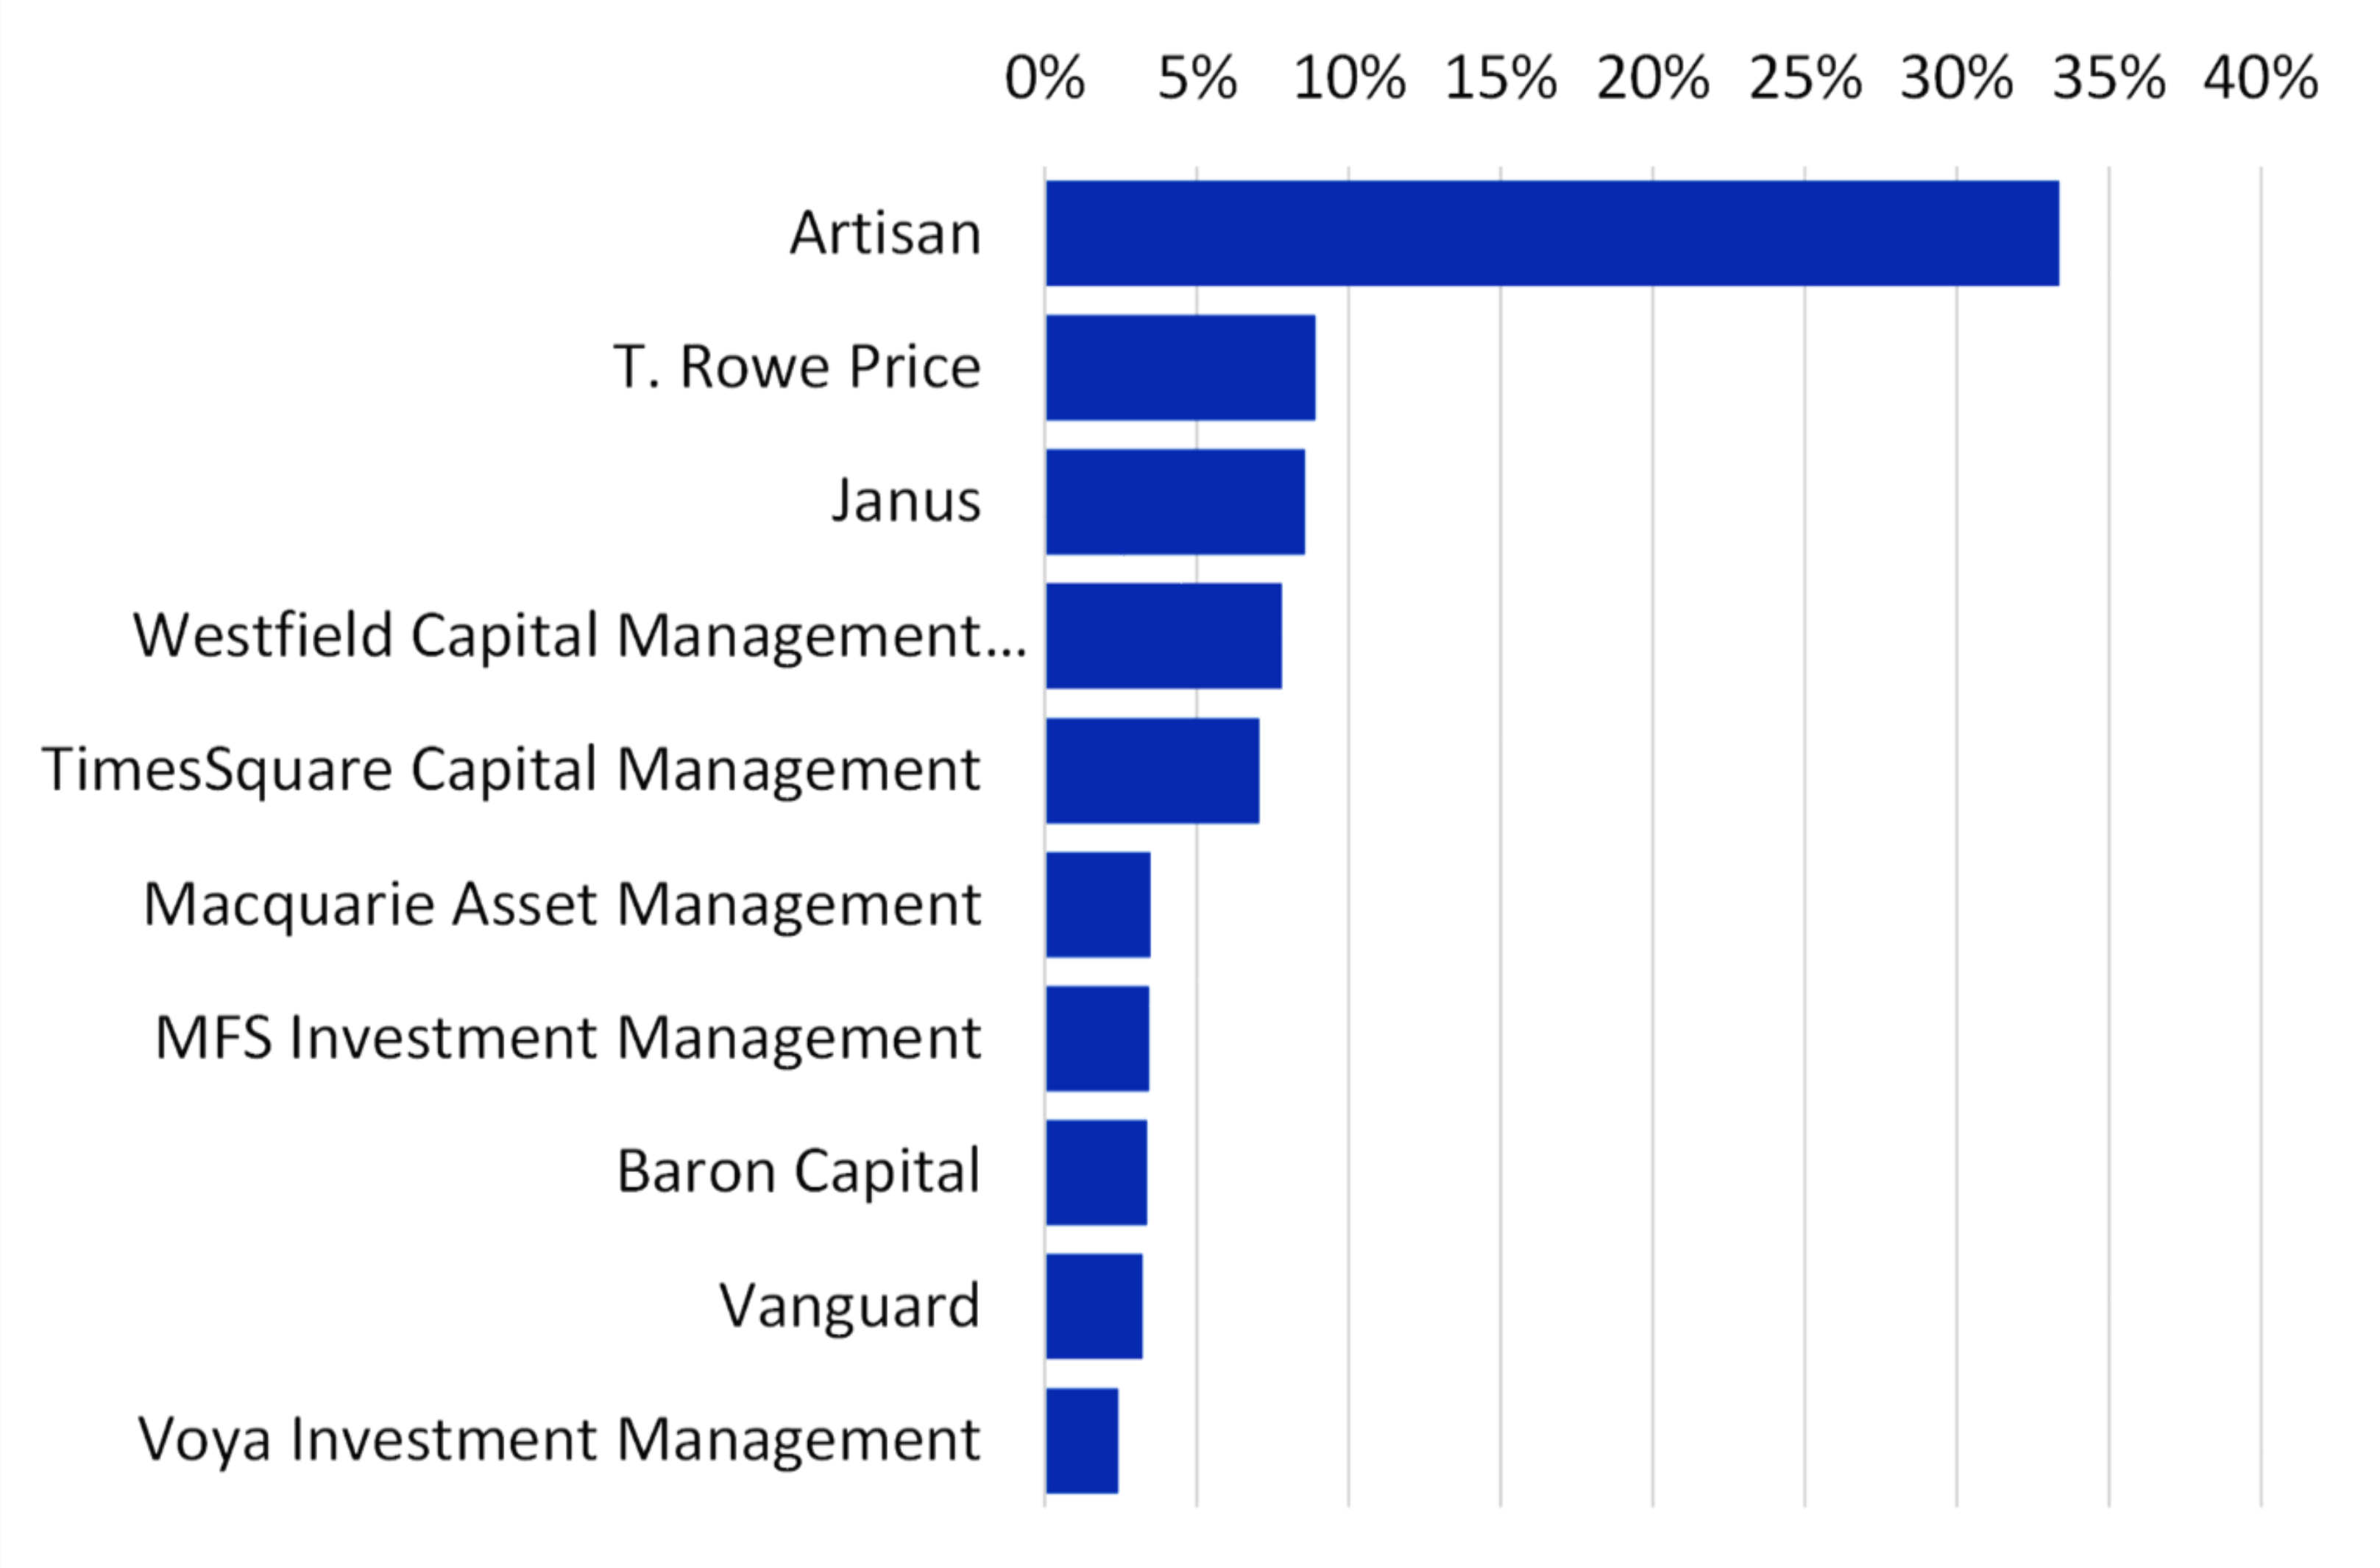
Actively Managed US Mid-Cap Growth
The mid-cap space is about half as large as the small-cap space in institutional portfolios. Artisan dominates the US actively managed mid-cap growth space, and Artisan is increasing its share.
The top buyers for US MCG YTD 2023 were:
1. Public Defined Benefit
2. Endowments & Foundations
Actively Managed US Mid-Cap Core
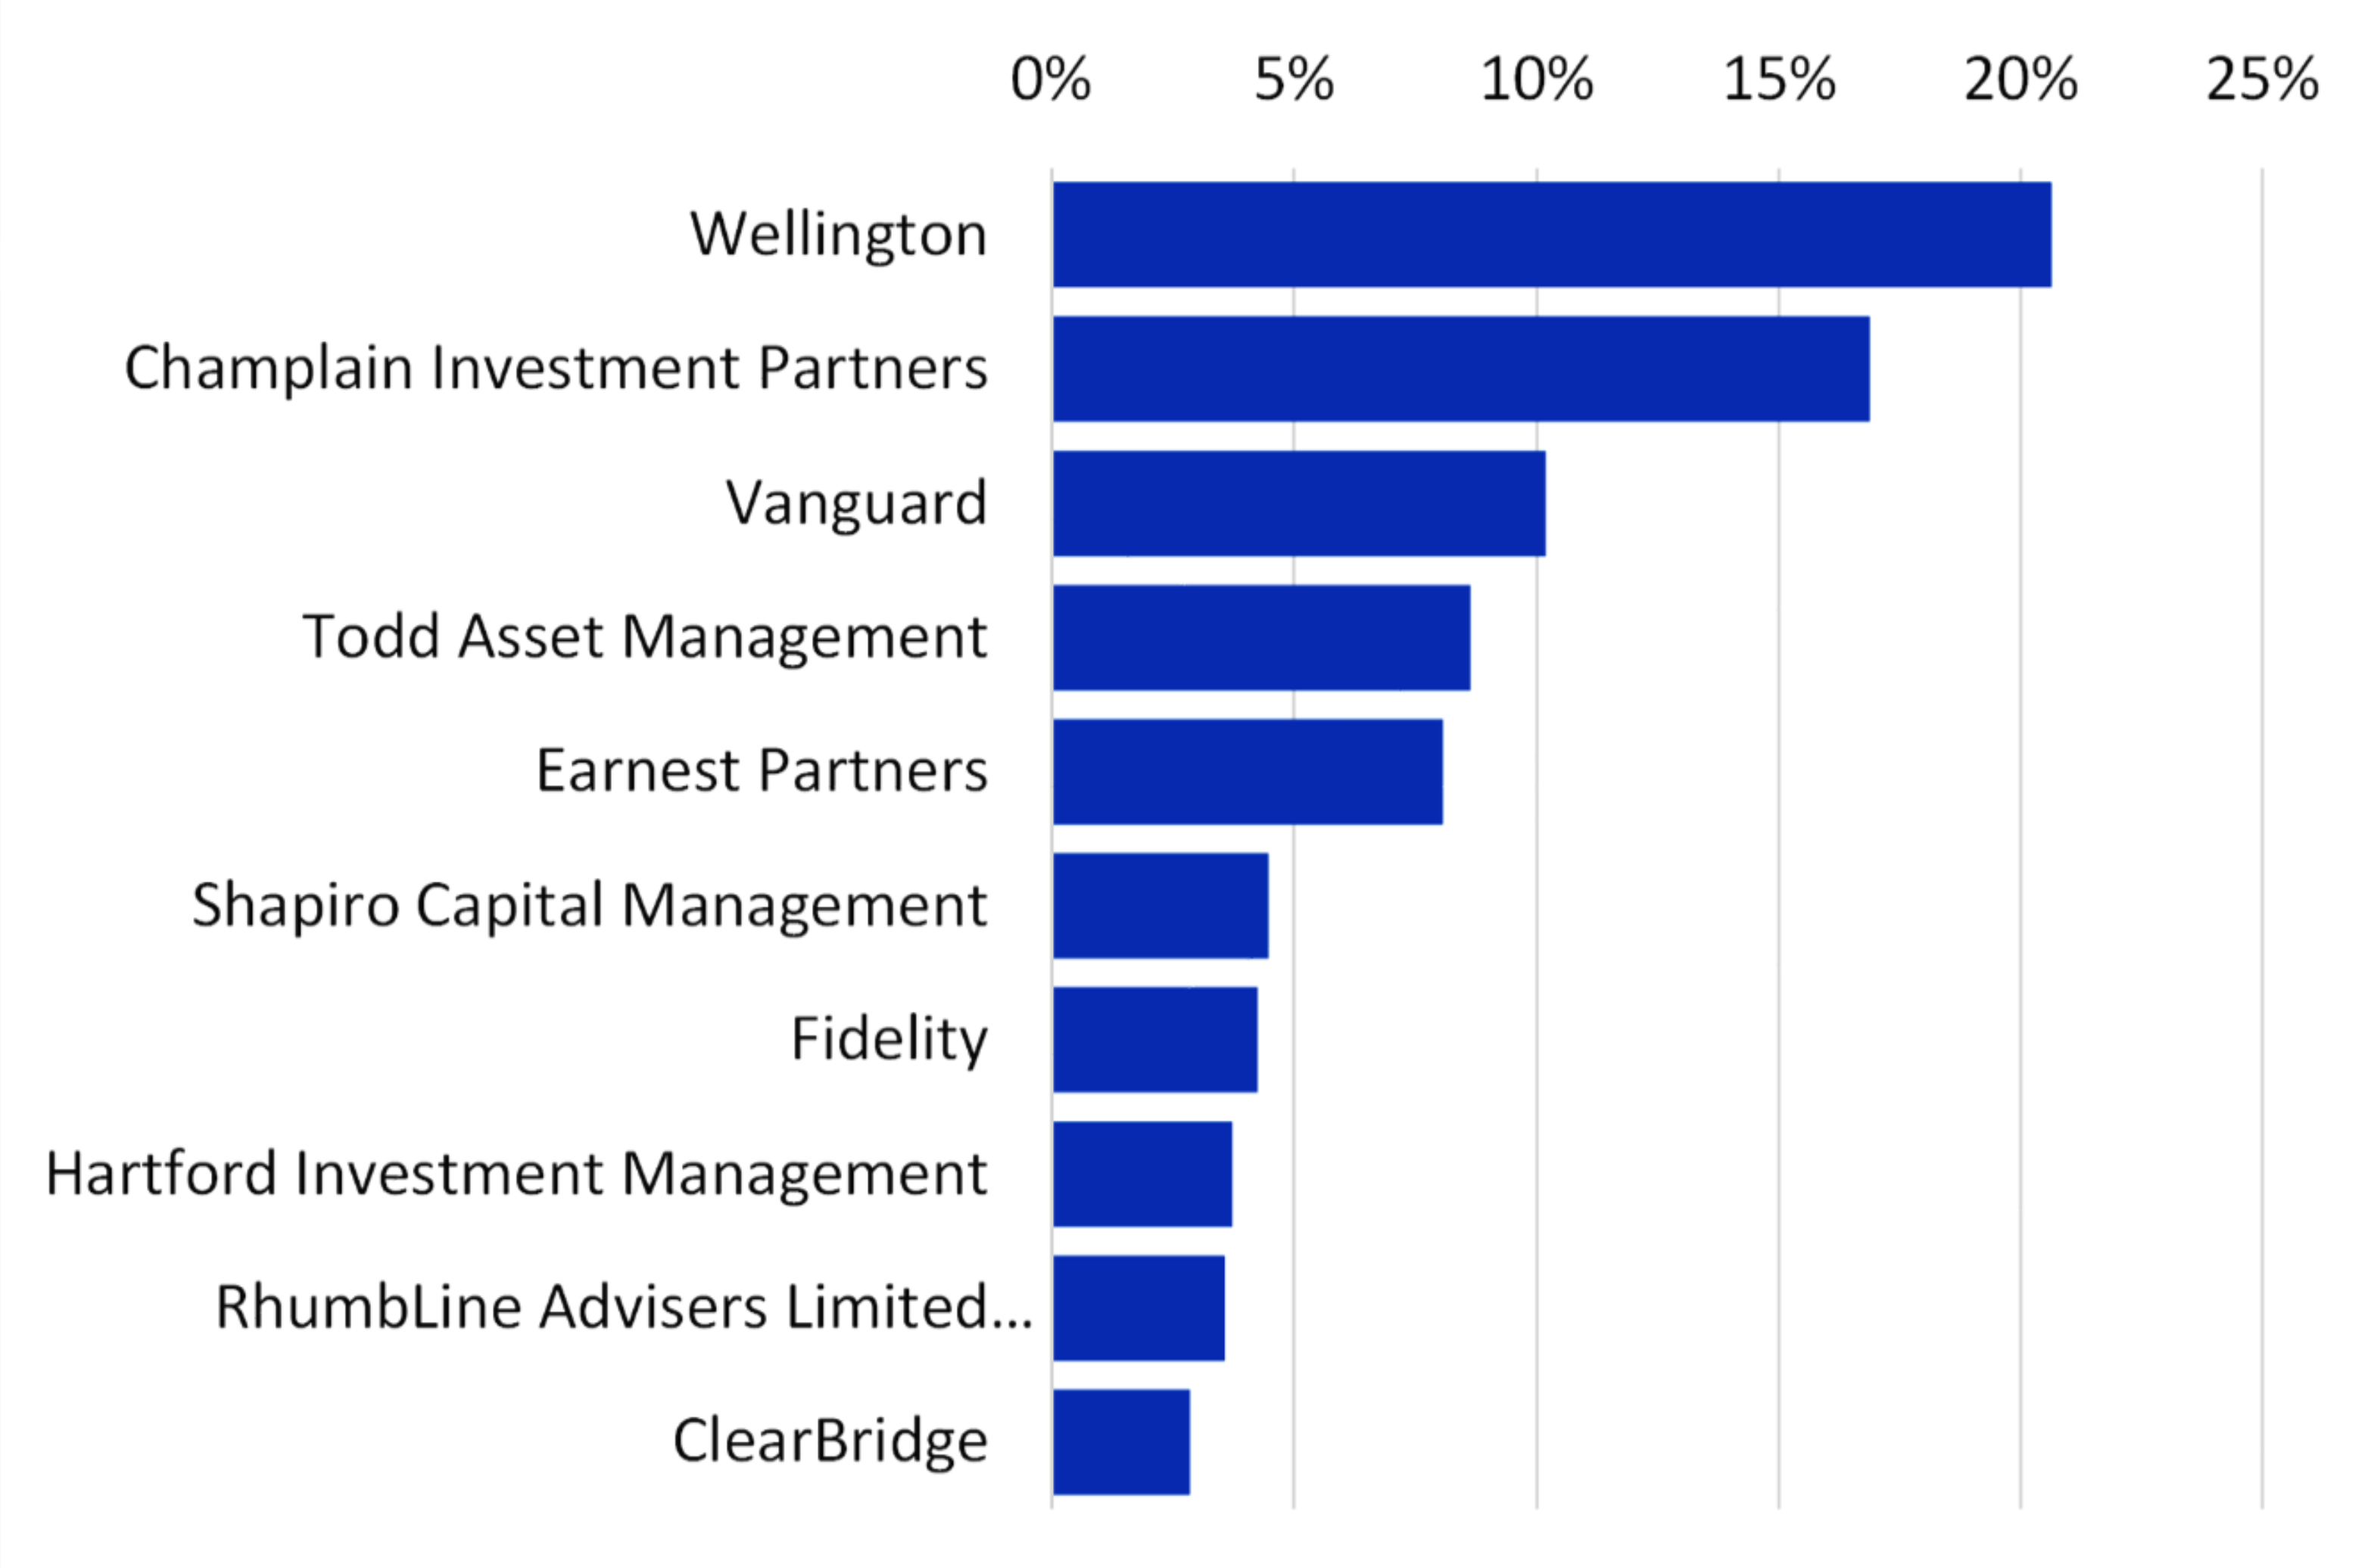
Market share in actively managed US mid-cap core is also highly concentrated. The top 3 market shareholders, Wellington, Champlain Investment Partners and Vanguard, make up 47.7% of the market.
Post-negotiated fees for US actively managed mid-cap core follow the trend of other caps for the ranking below growth and value. The median fee for US MCC is 56.97 bps for separate accounts and commingled vehicles.
The top buyers of actively managed US MCC during 2023 have been:
1. Endowments & Foundations
2. Taft-Hartley Defined Benefit
Actively Managed US Mid-Cap Value
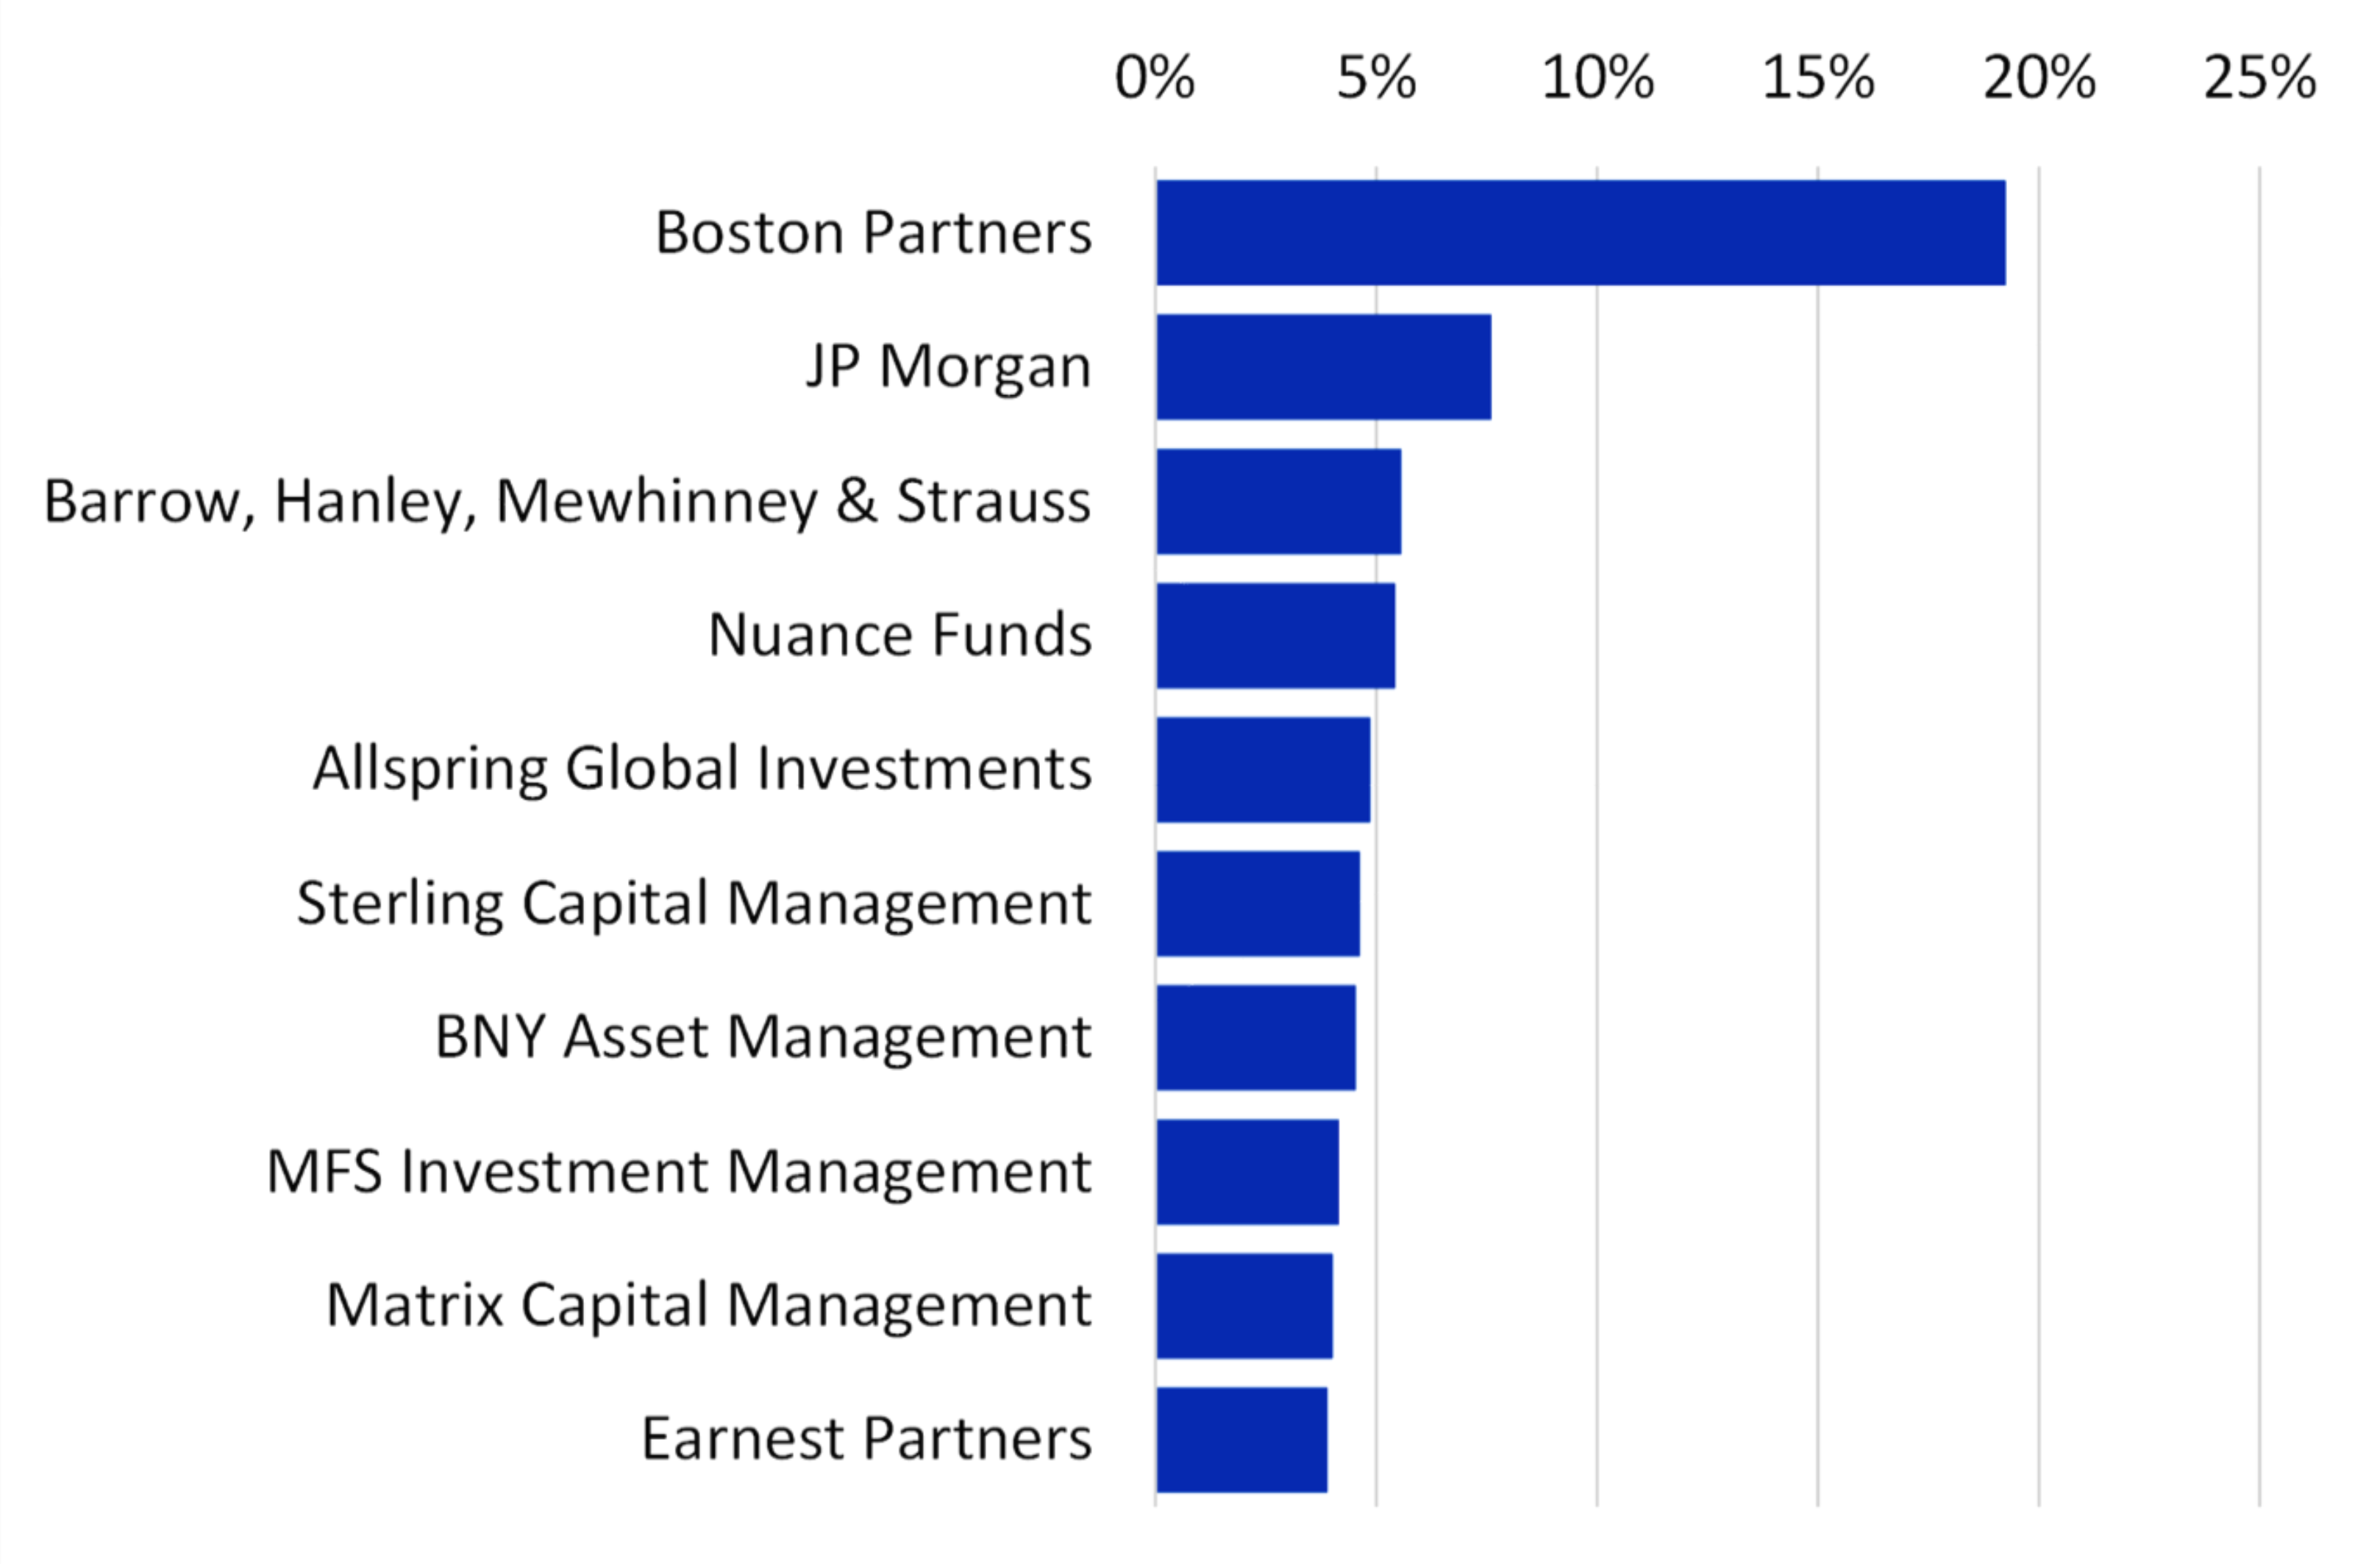
Market share in actively managed US mid-cap value is concentrated in a single player. Boston Partners leads in market share with double the share of the second asset manager, JP Morgan.
Post-negotiated fees for US actively managed mid-cap value are 69.00 bps. These fees are for separate accounts and commingled vehicles for institutional plans.
YTD 2023 saw manager replacements in US MCV. The top buyers were:
1. Endowments & Foundations
2. Public Defined Benefit
Actively Managed US Large-Cap Growth
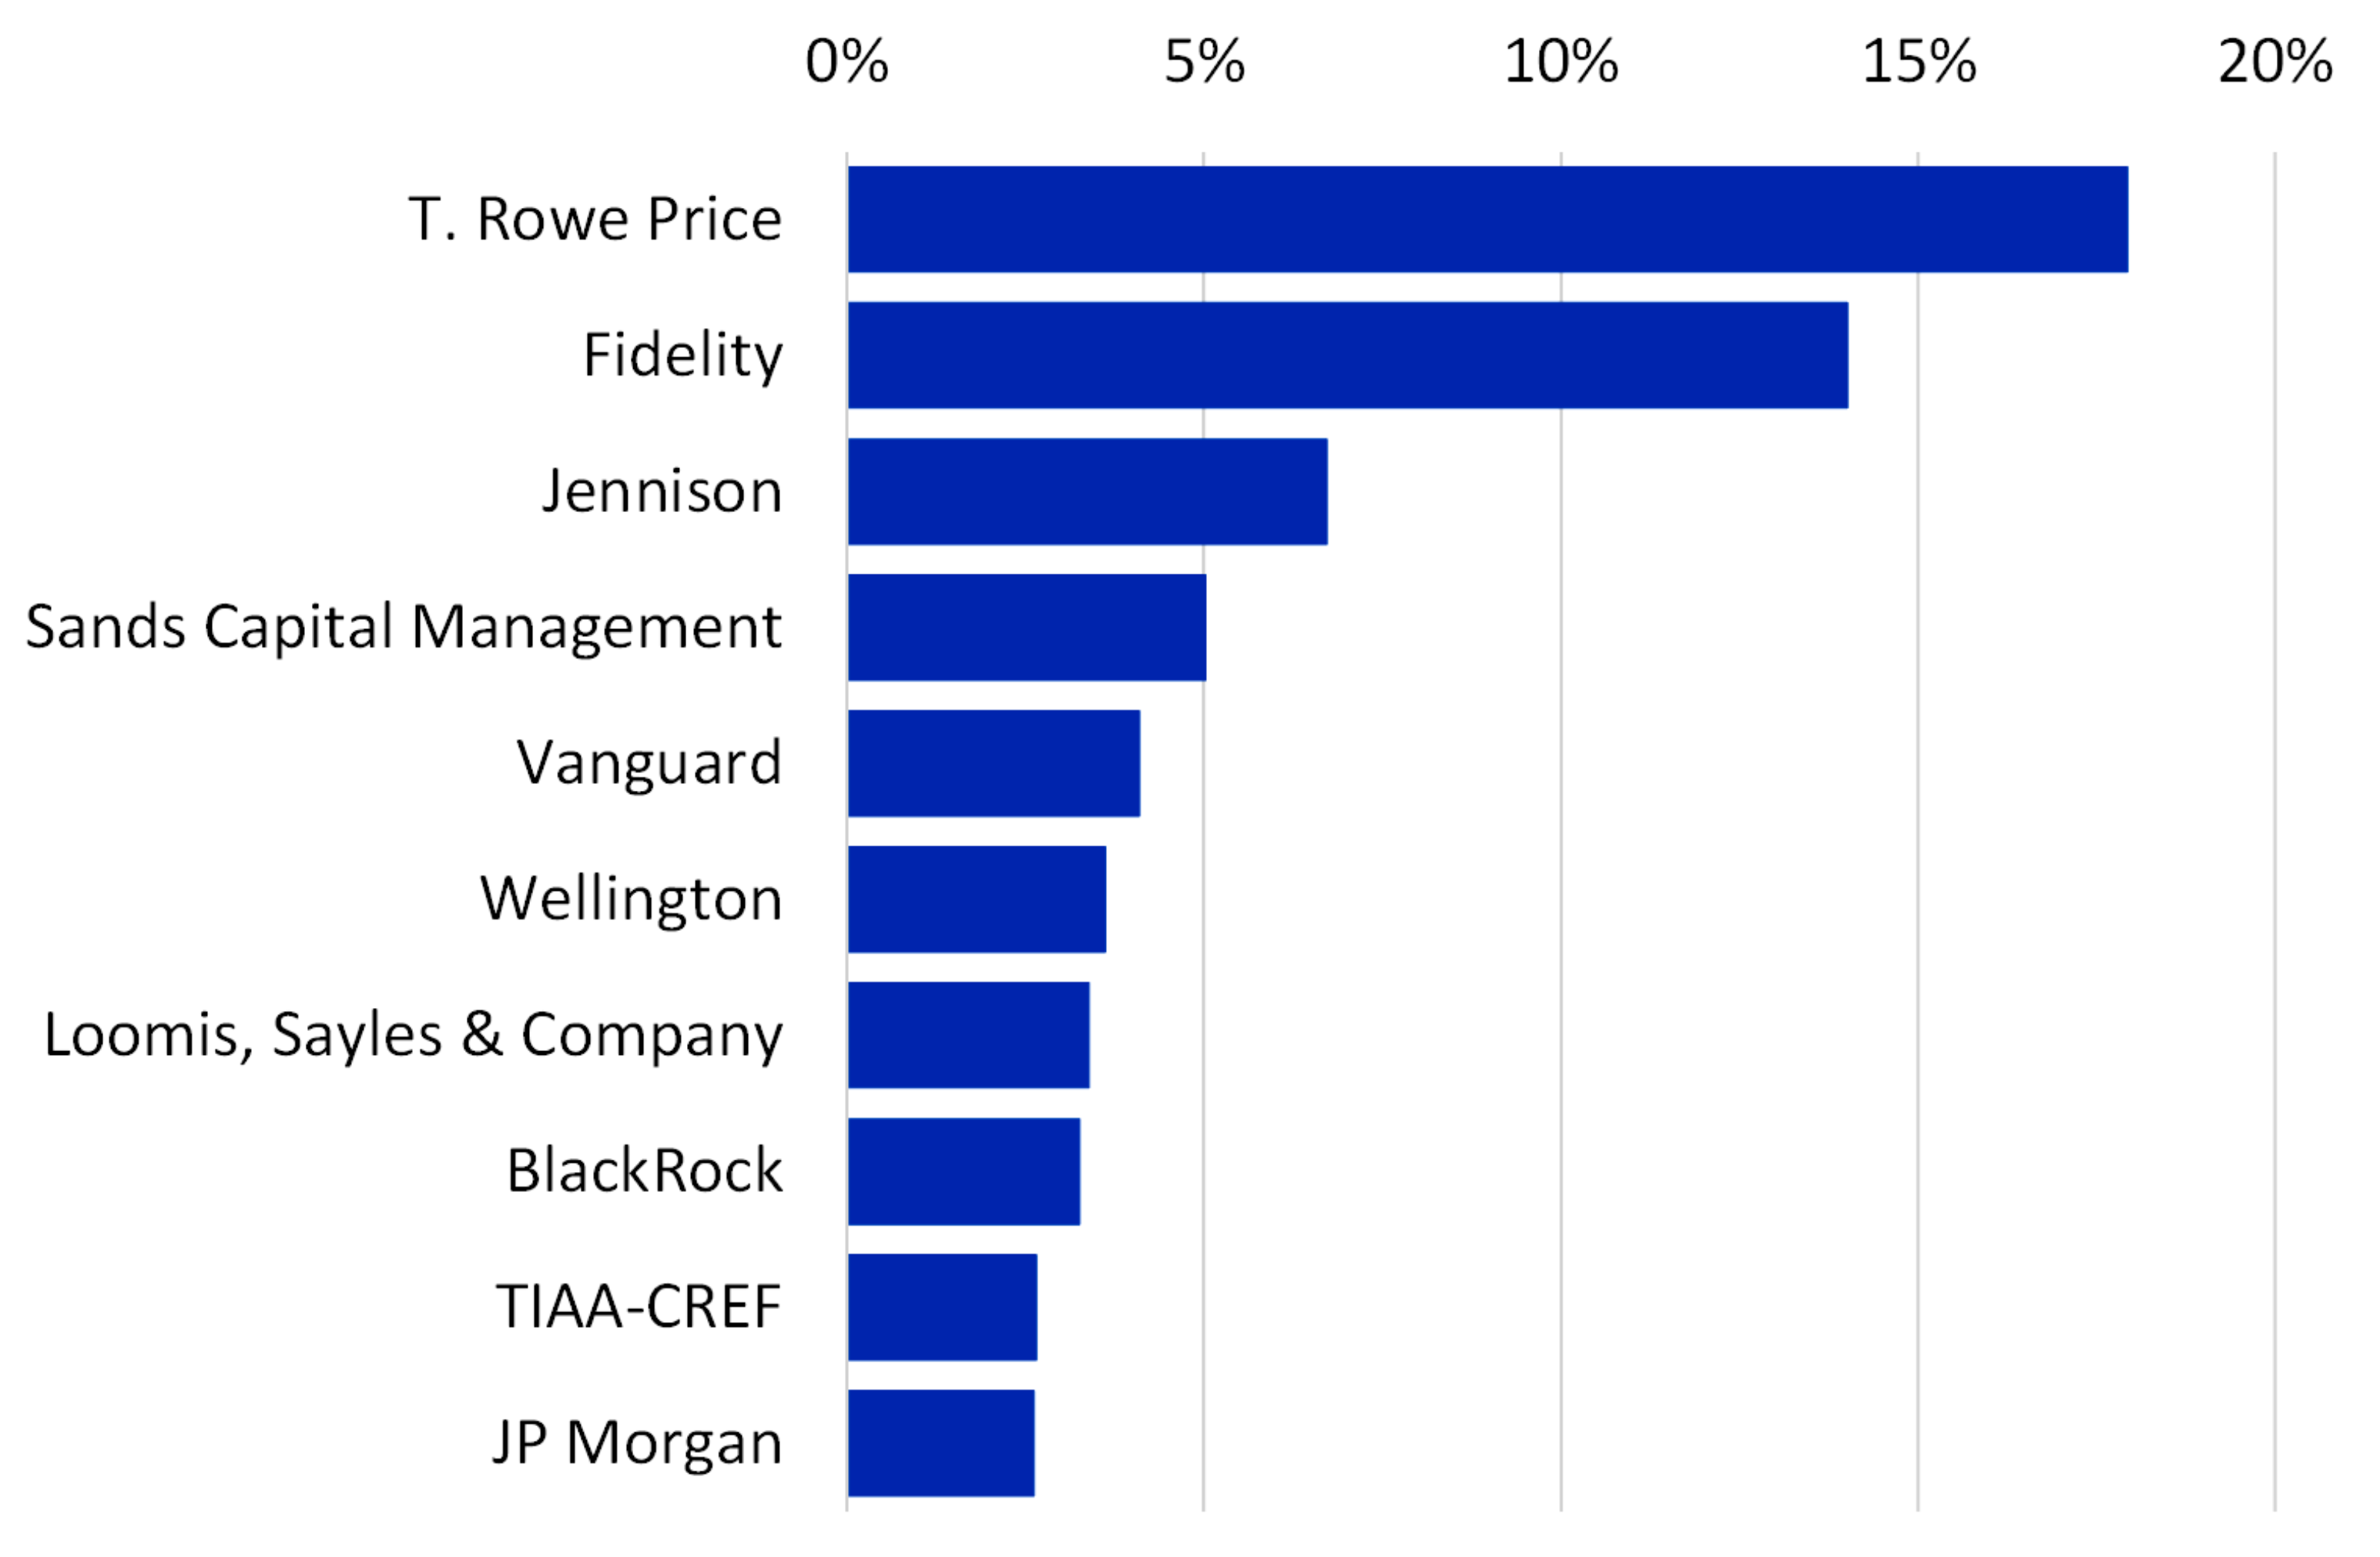
Market share in actively managed US LCG is dominated by a handful of managers. T.Rowe Price and Fidelity alone comprise 31.3% of US LCG market share. The amounts in US LCG are also much larger than mid-cap or small-cap. Large caps comprise 48.2% of the institutional actively managed equity market share. Small-caps make up 5.4%, mid-caps make up 2.7%, all caps make up 27.4%, SMID makes up 1.9%, and other caps make up 4.4% of the actively managed equity portion of institutional plans.
Fees to US actively managed LCG are a median 51.70 bps for separate accounts and commingled vehicles.
The top buyers in US actively managed SCG for YTD 2023 were:
1. Corporate Defined Benefit
2. Taft-Hartley Defined Benefit
Actively Managed US Large-Cap Core
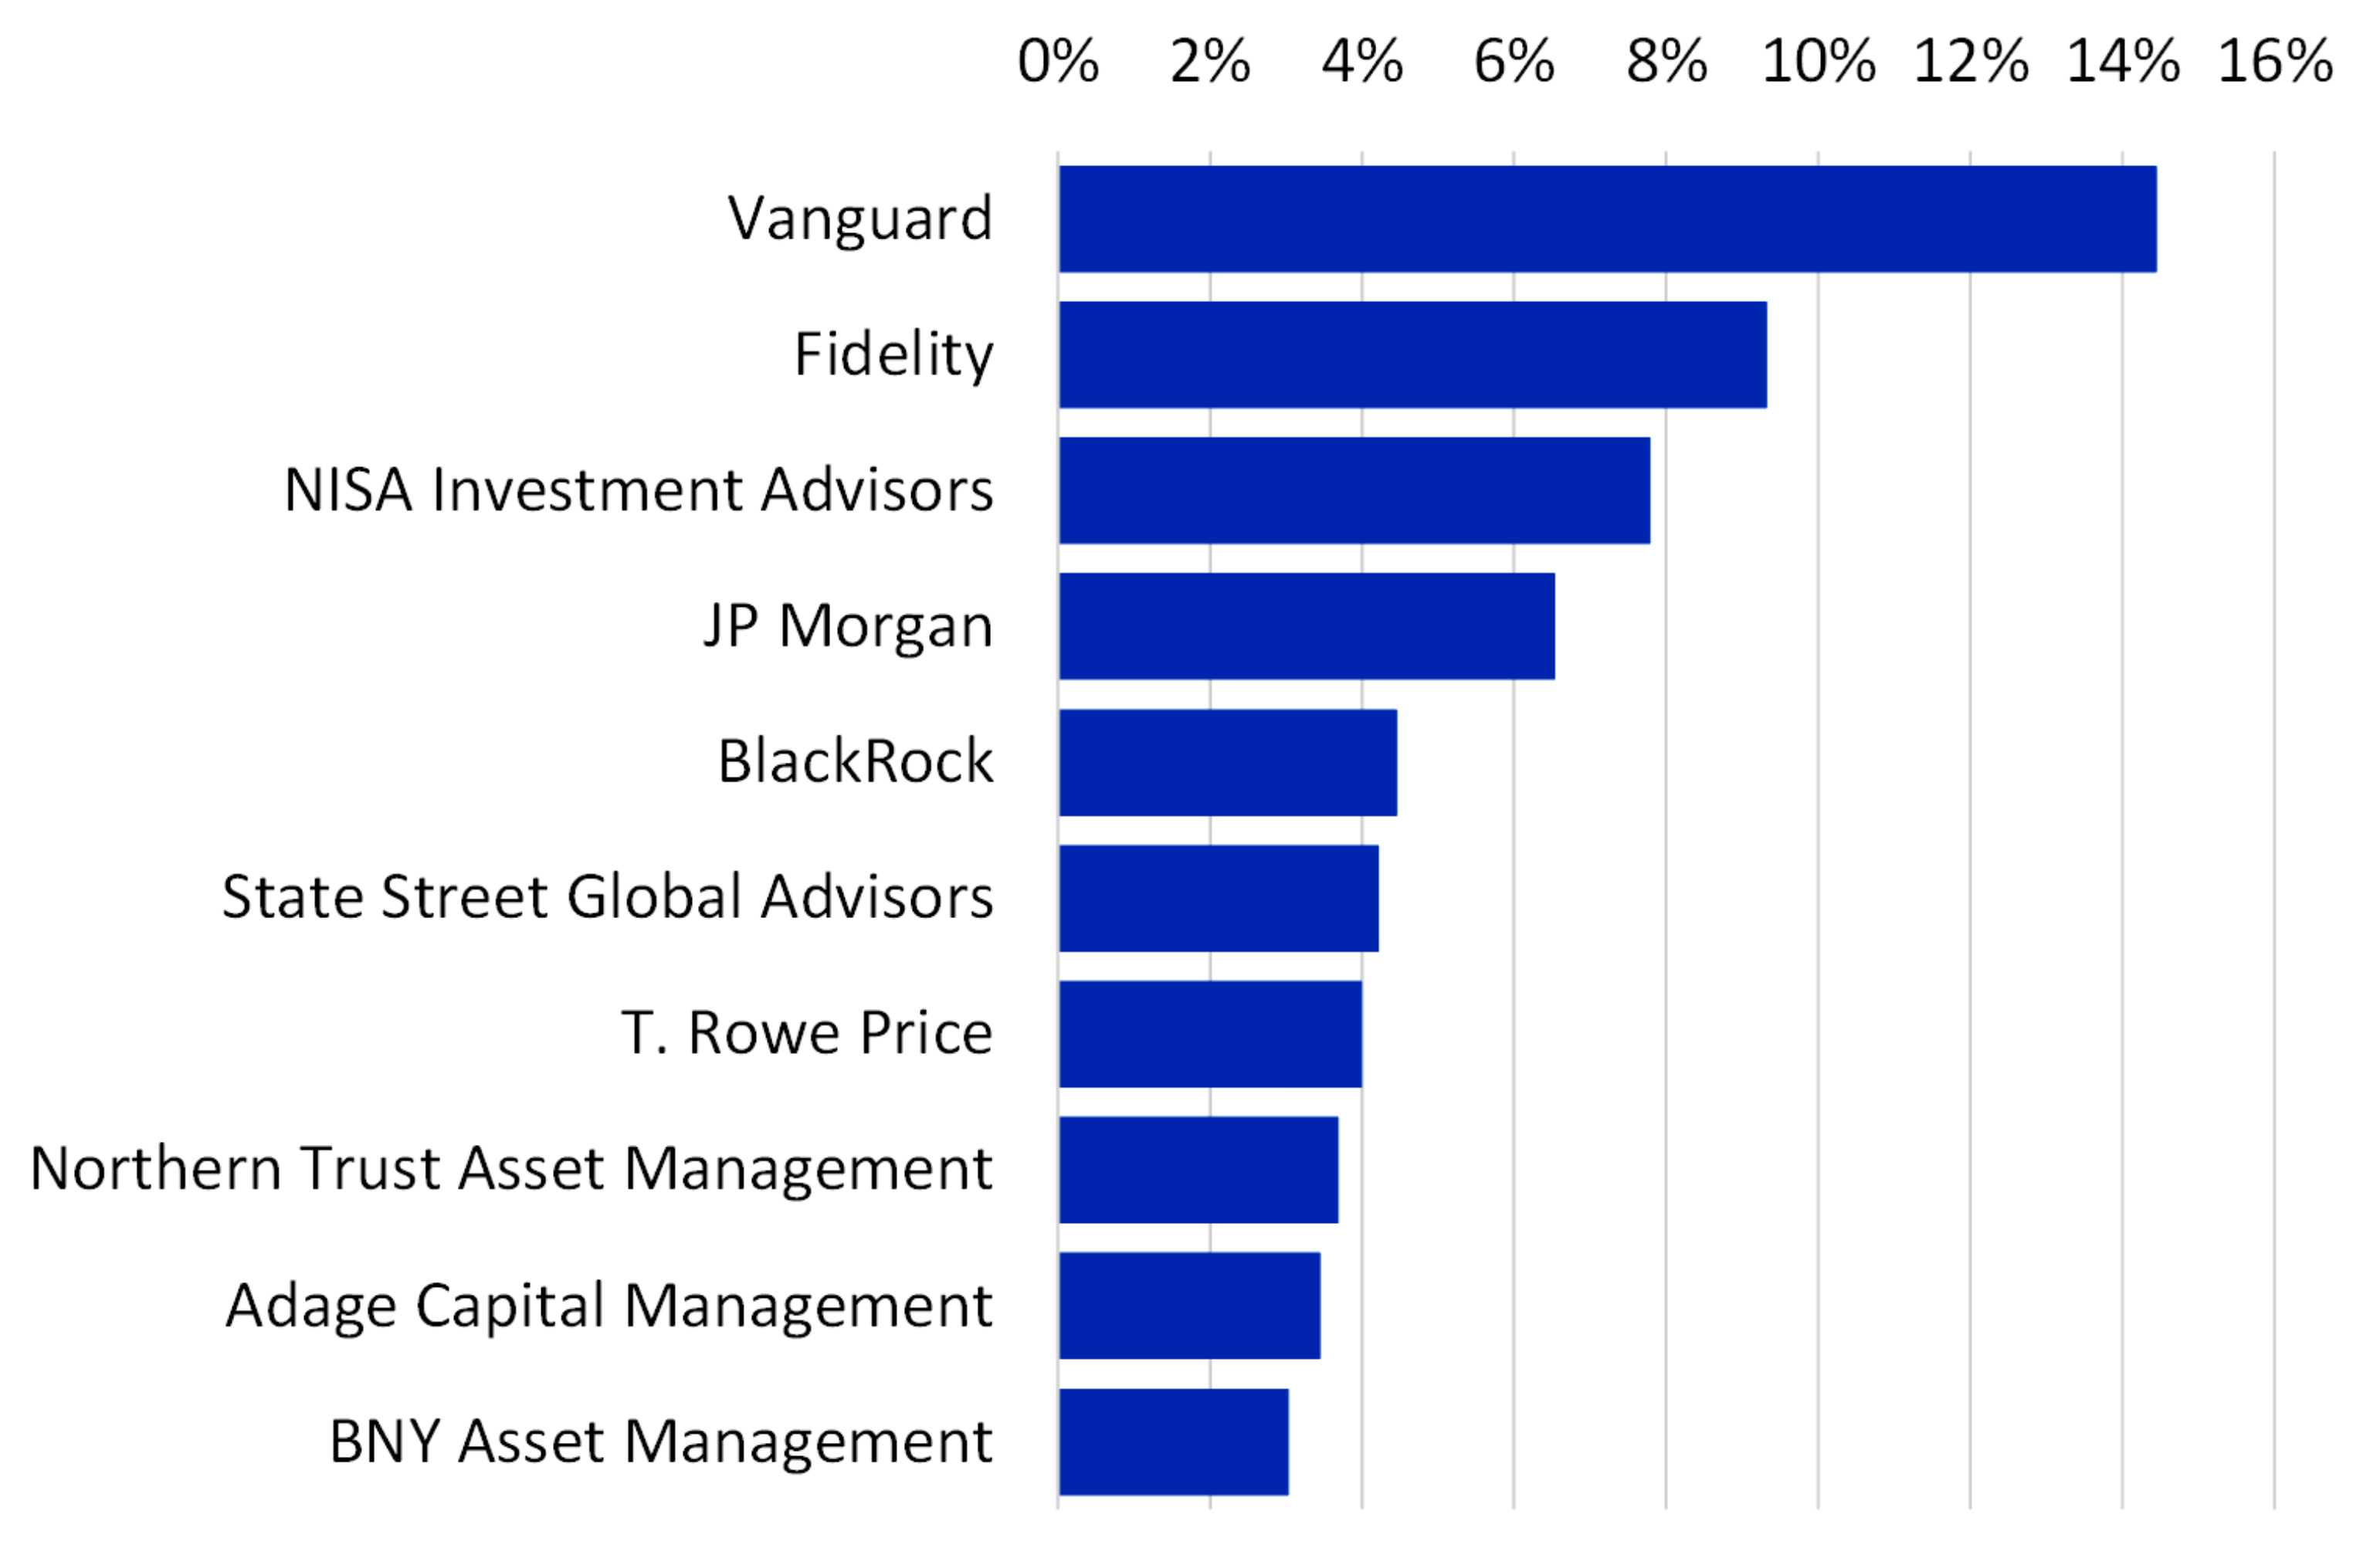
Actively managed US large cap core is the single largest asset pool in equity portfolios. Market share was fairly distributed among the top managers. Vanguard leads, followed by Fidelity and NISA. The top 10 managers do constitute 60.6% of the actively managed US LCC assets.
Fees to US LCC are the lowest of any style and cap of actively managed equity to institutional portfolios. Fees for active US LCC have a median of 44.16 bps for separate account and commingled vehicles.
The top buyers of actively managed US LCC for YTD 2023 were:
1. Public Defined Benefit
2. Corporate Defined Benefit
Actively Managed US Large-Cap Value
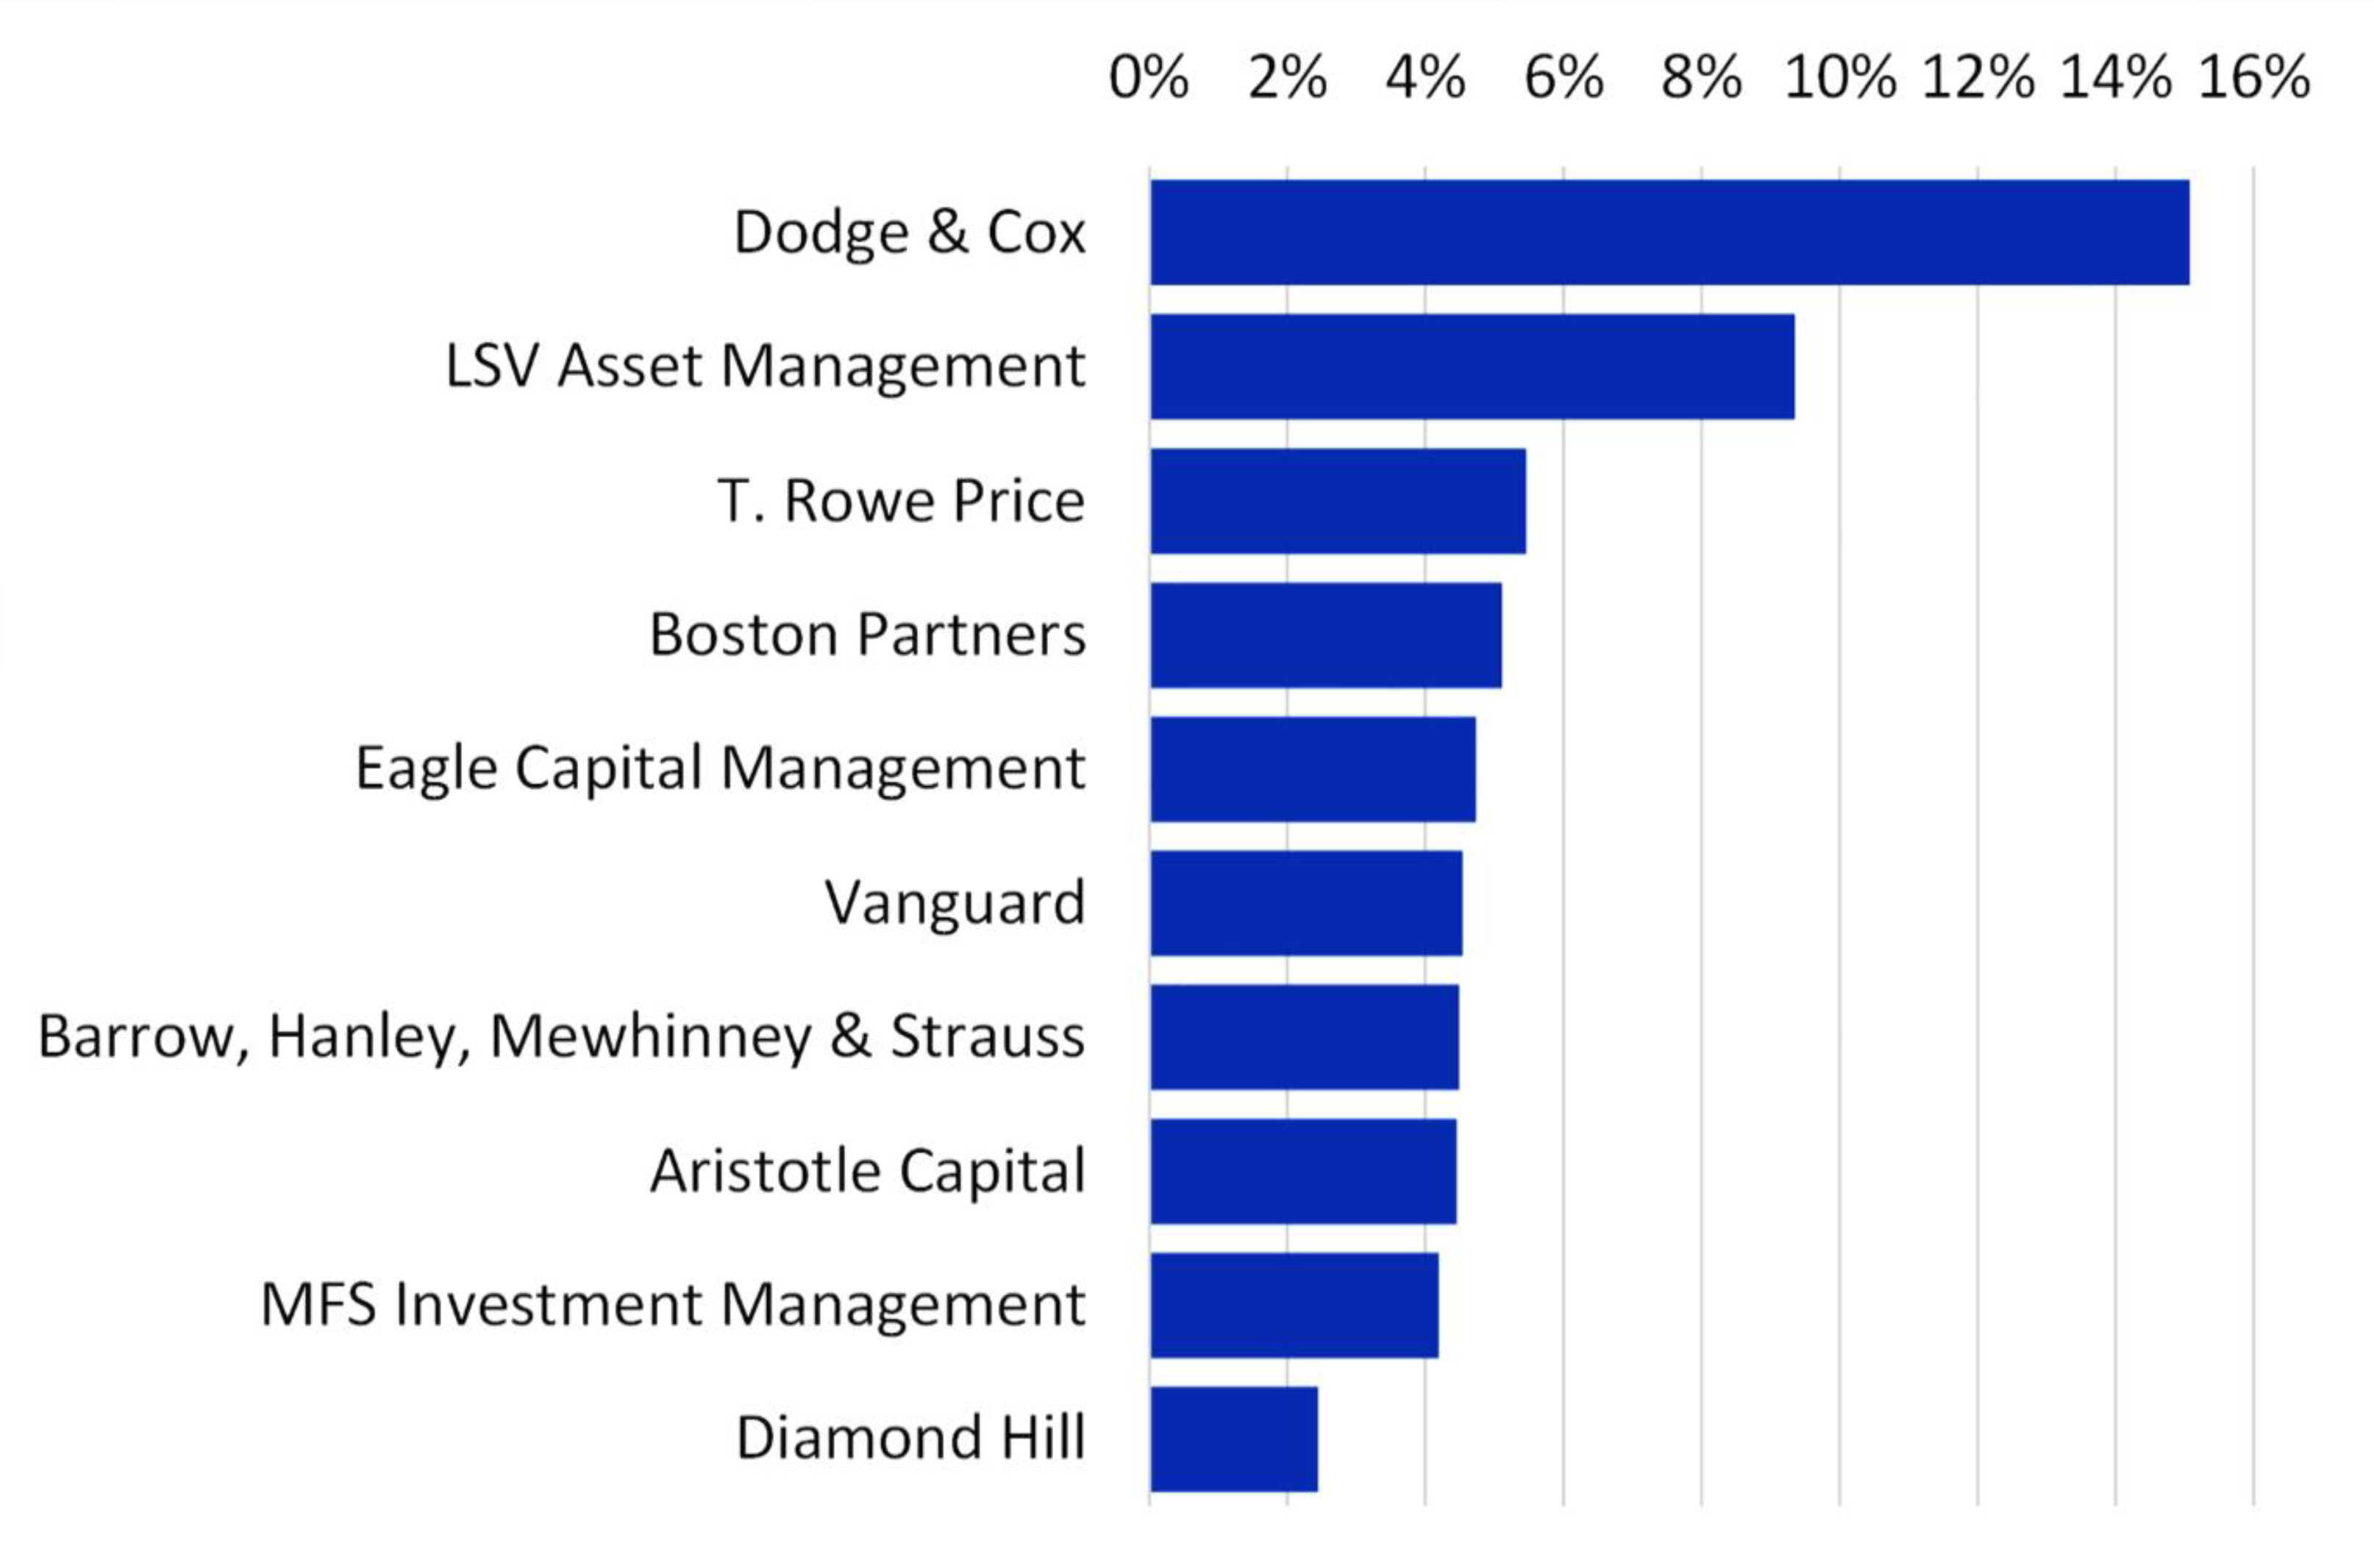
Market share in US actively managed LCV is a fairly normal concentration level. Dodge & Cox lead followed by LCV and T.Rowe Price. Dodge and Cox has 15% of the actively managed US LCV. The top 10 managers make up 59.8% of the total actively managed LCV.
Post-negotiated fees to US actively managed LCV were very similar to large cap growth. Fees for large cap value were a median of 51.60 bps for separate accounts and commingled funds. Large cap growth was very similar at 51.70 bps.
The actively managed US LCG buyers YTD 2023 were:
1. Endowments & Foundations
2. Public Defined Benefit
Operating reserve plans closely followed public DB. The operating reserve plans buying US LCG were fairly evenly split between Healthcare, E&F and Corporations.
Actively Managed US-Core/Core+ Debt
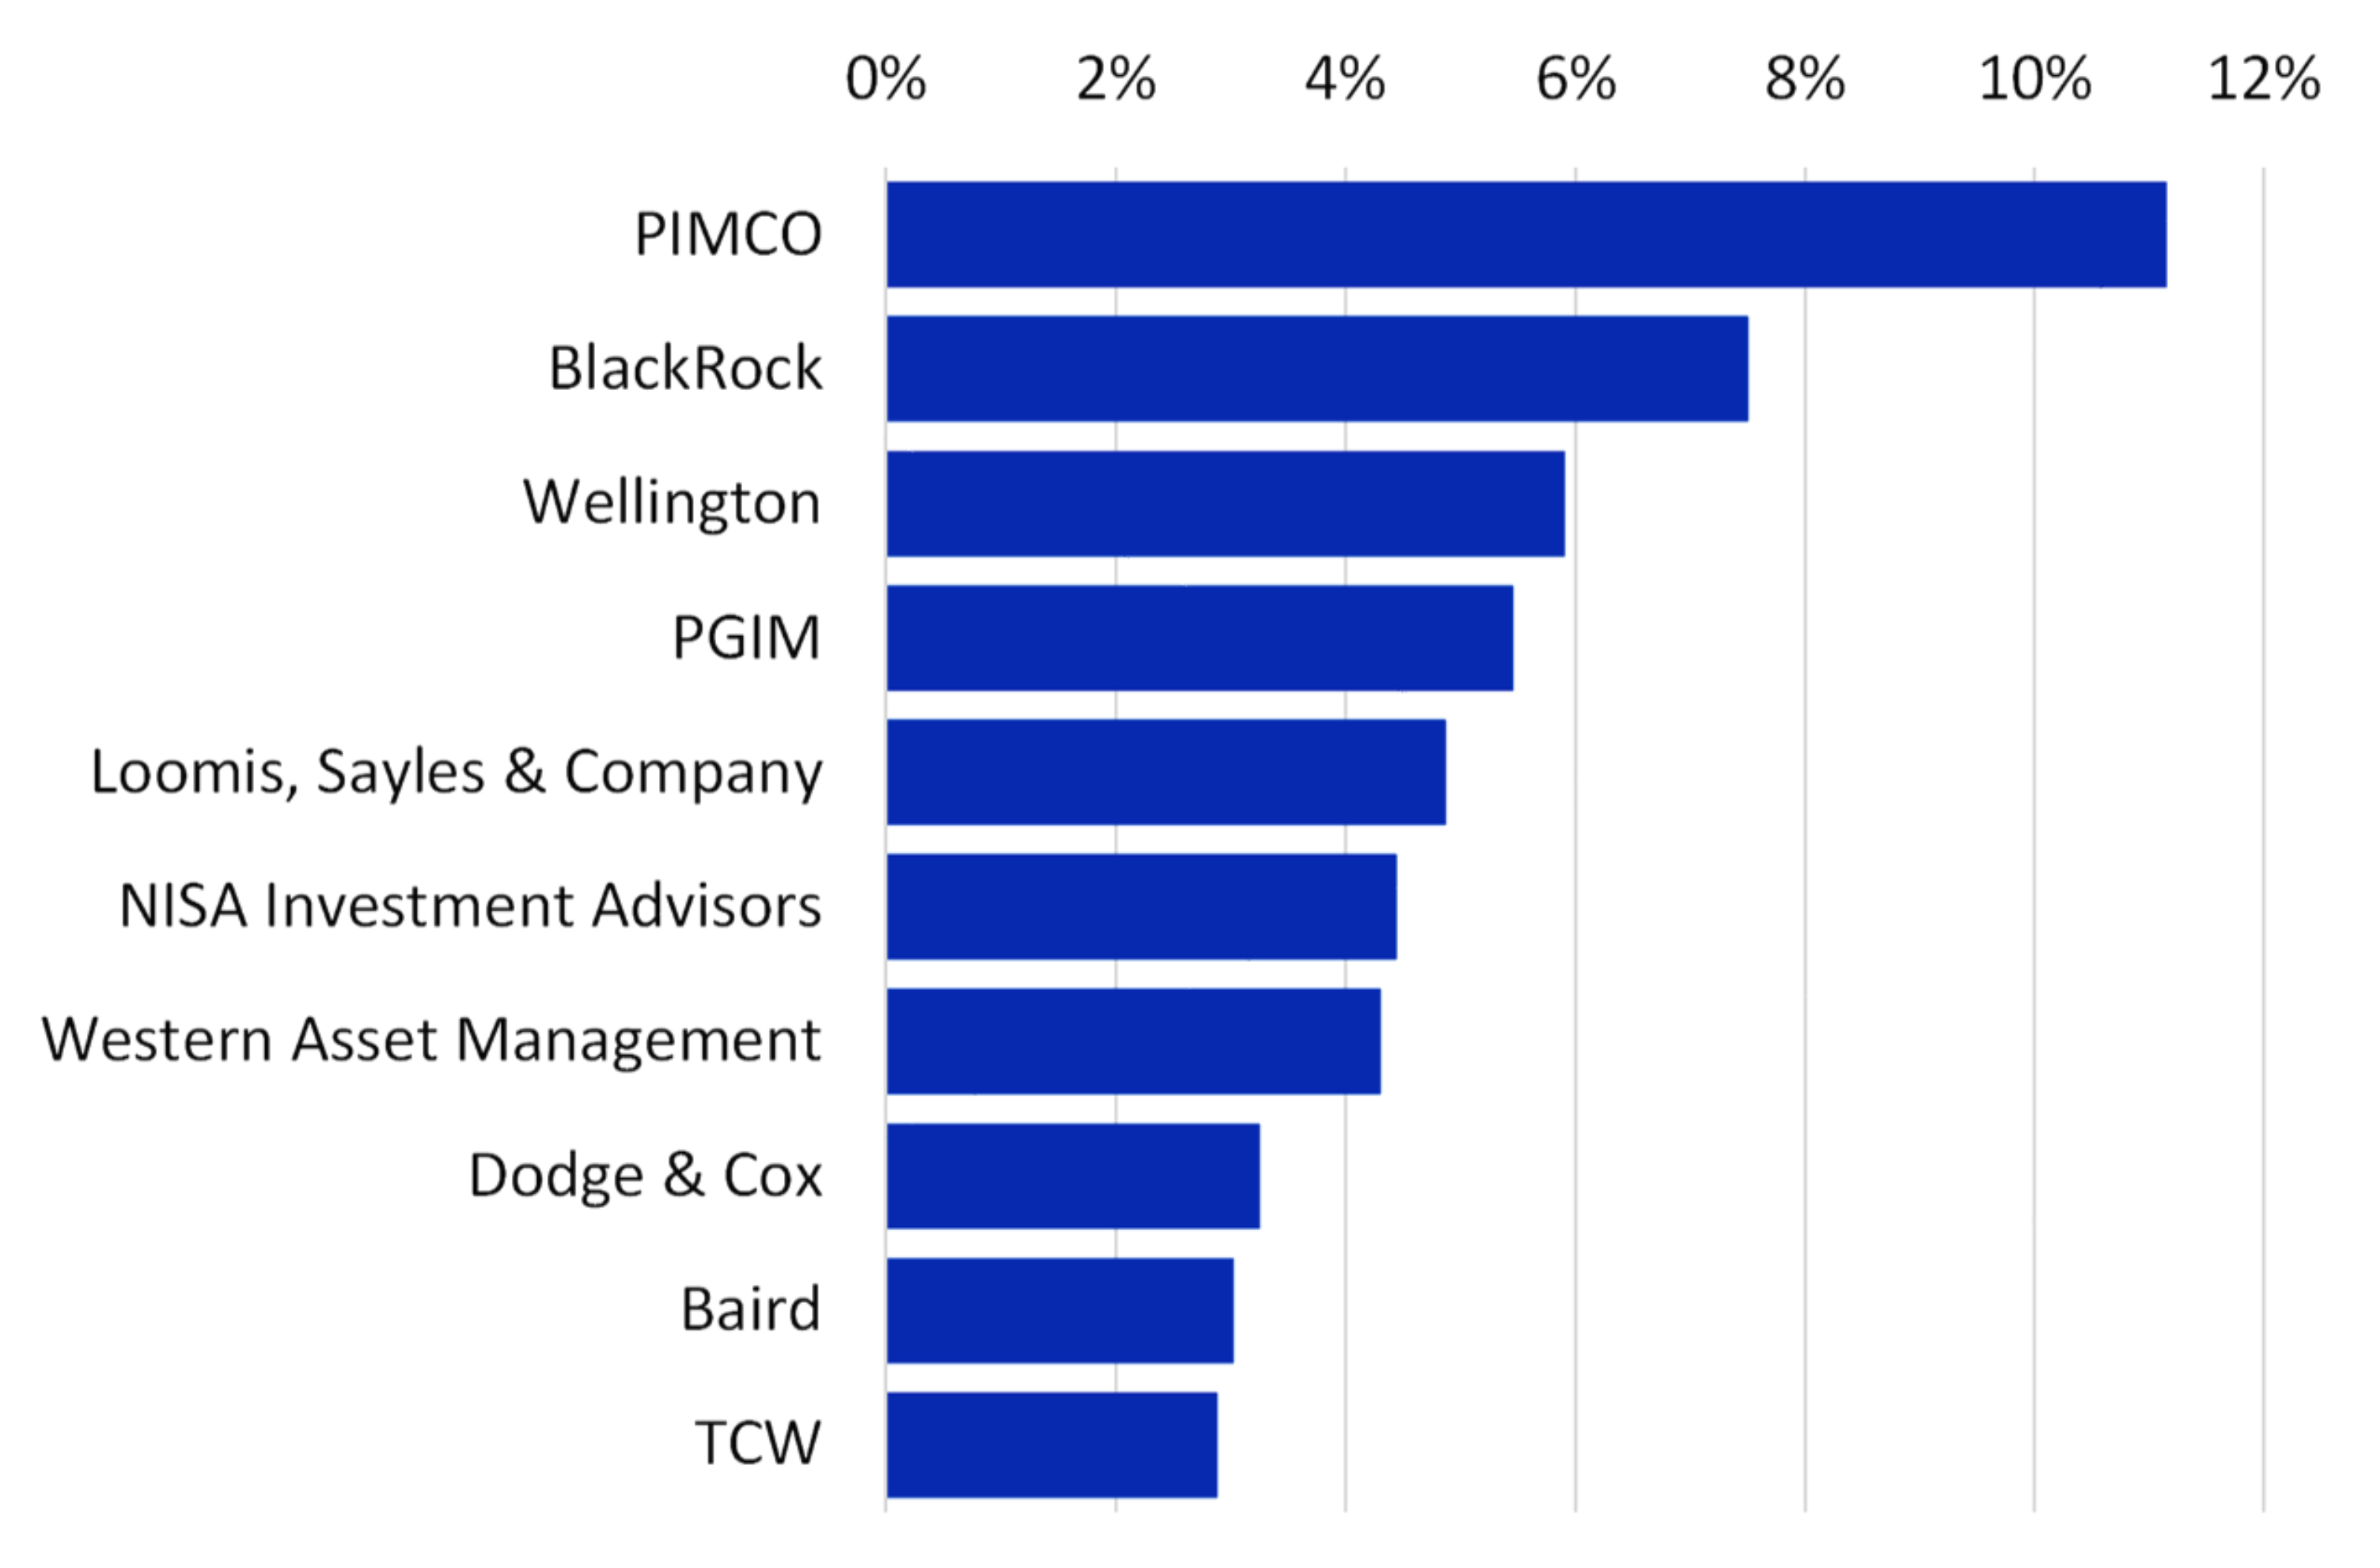
Market share in core and core+ debt continues to be led by some of the largest asset managers. PIMCO, BlackRock, and Wellington make up the top three market share holders in core and core+ in institutional plans.
Fees to core and core+ were lower than comparable equities. It is worth noting the range of fees paid. The median for separate accounts and commingled funds was 25.00 bps but some plans were paying over 60 bps.
Top buyers of core and core+ debt were overwhelmingly defined benefit so far in 2023:
1. Public Defined Benefit
2. Corporate Defined Benefit
In third place was a virtual tie, but distant from Public and Corporate DB. Third place was Health & Welfare for Taft-Hartley and Endowments & Foundations.
Actively Managed US High-Yield Debt
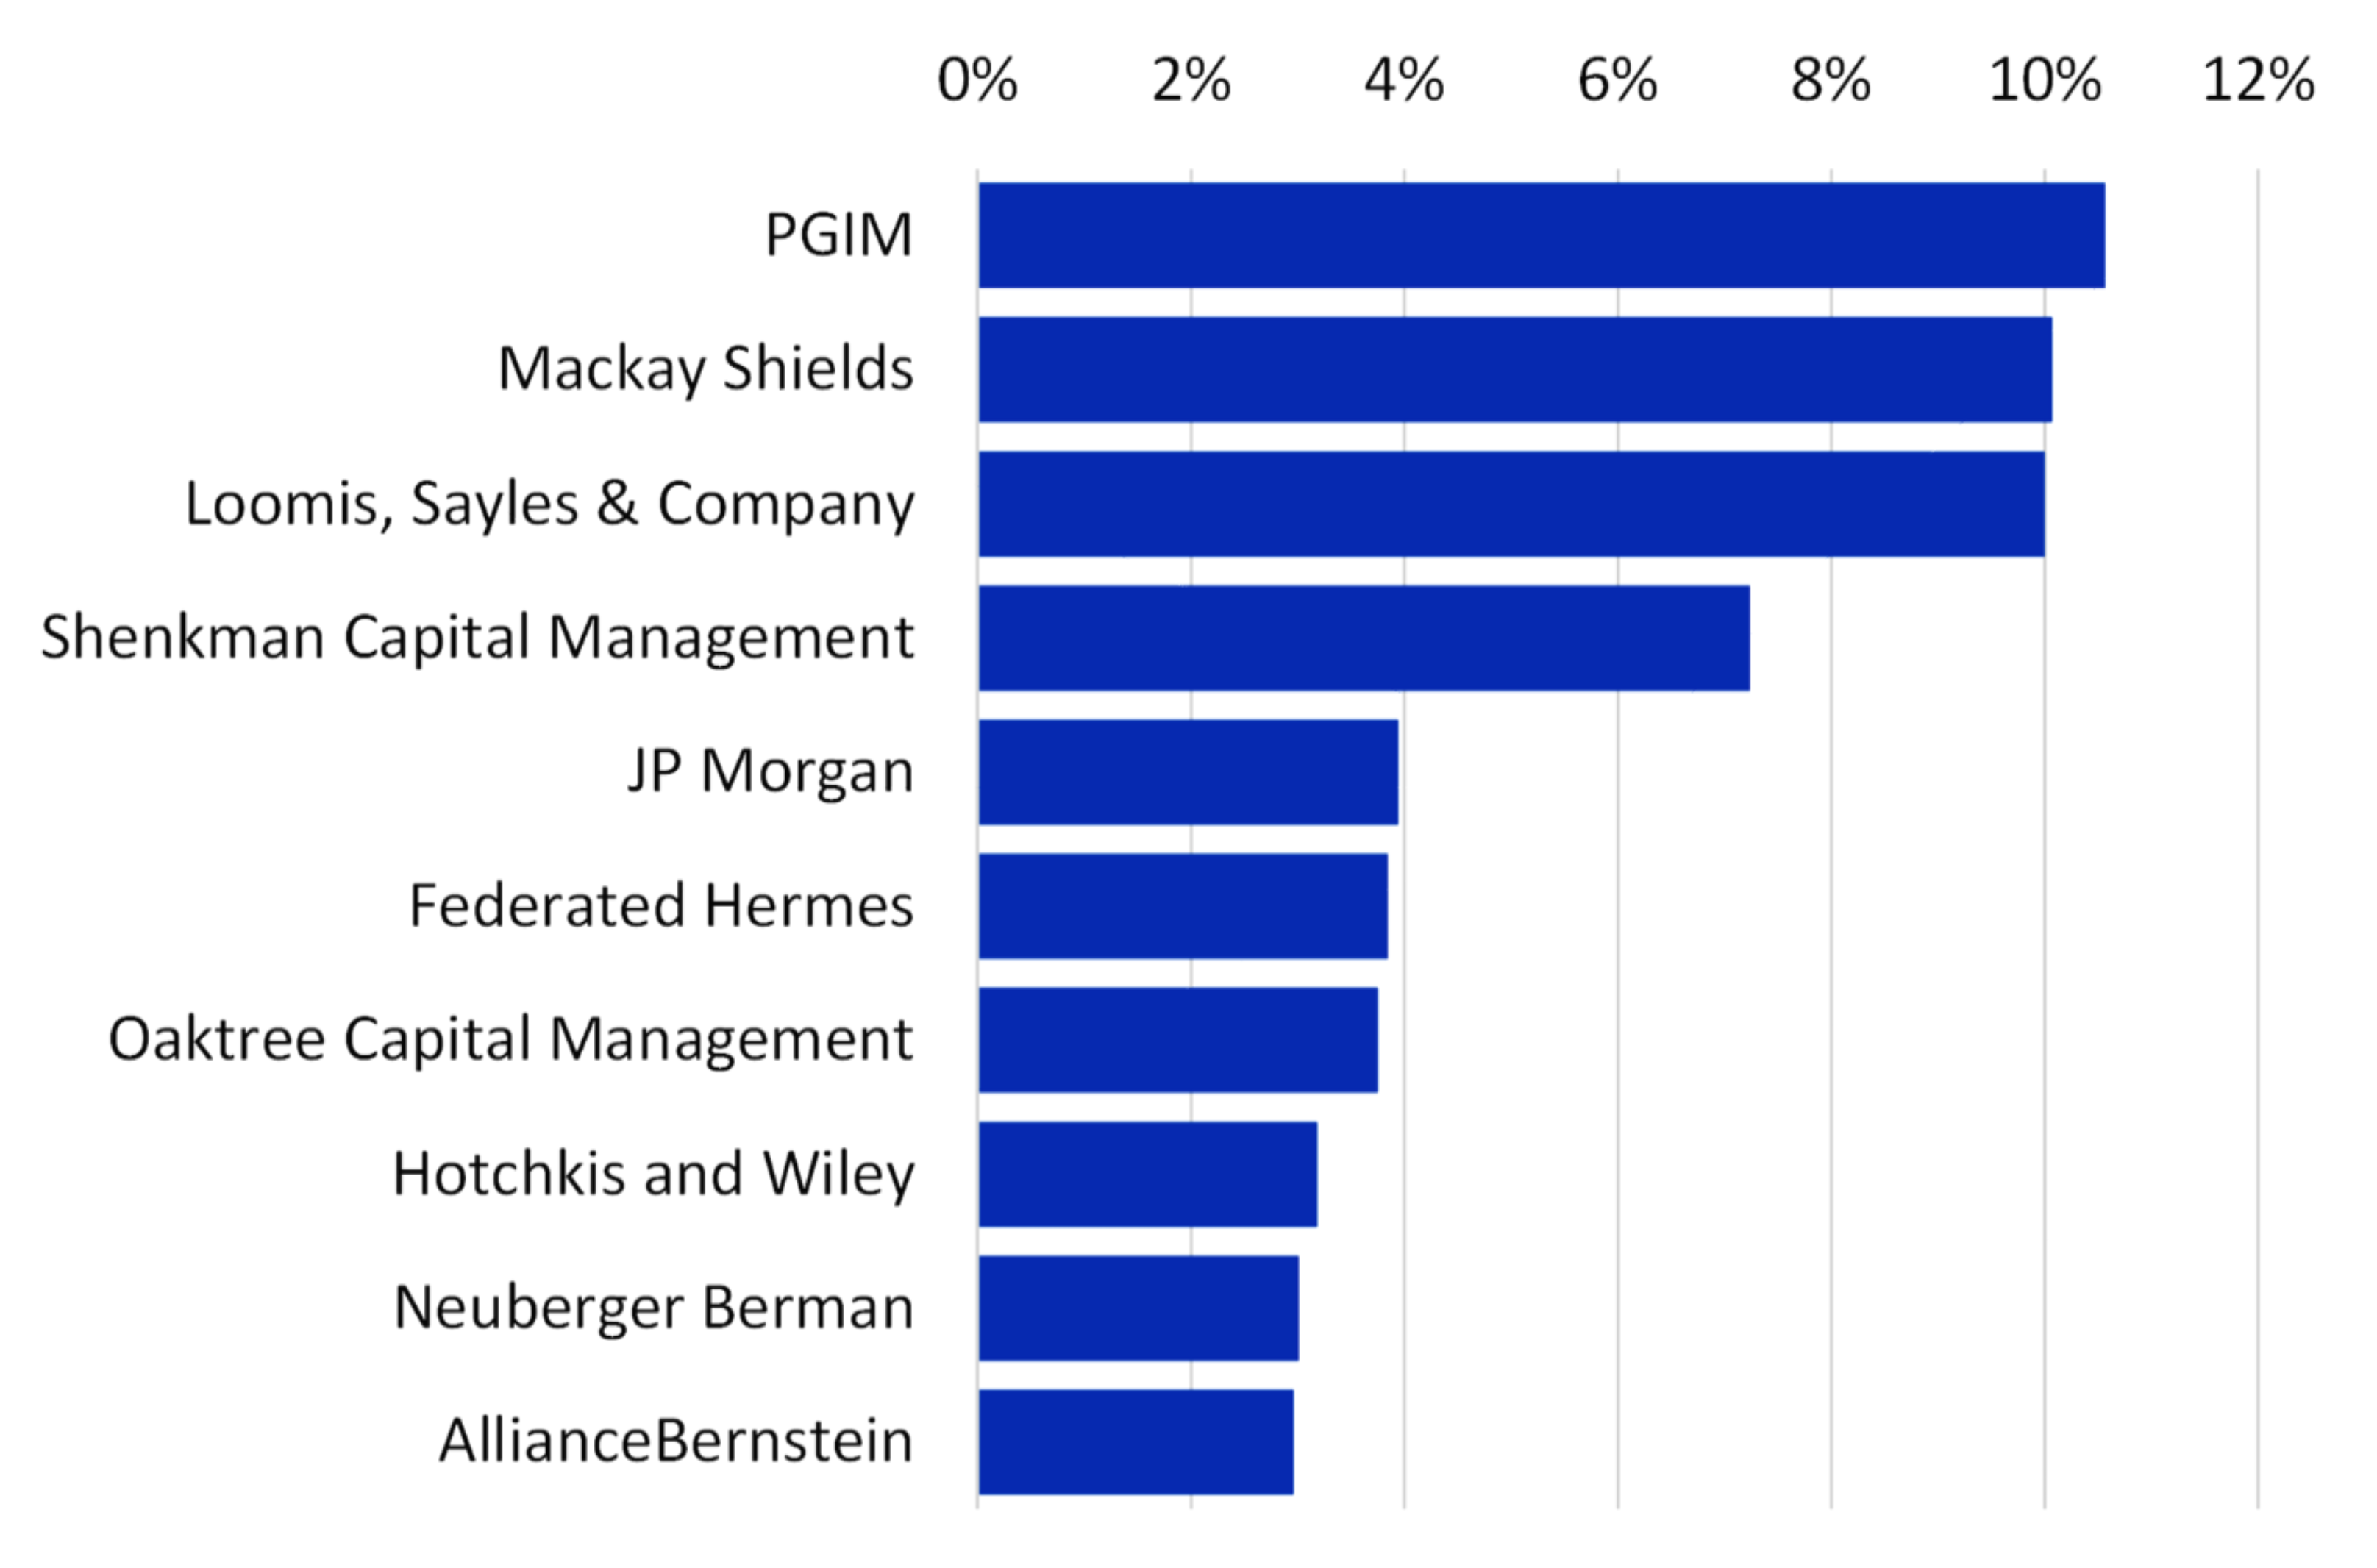
Market share in high-yield debt was led by PGIM. Mackay Shields and Loomis, Sayles trailed slightly. The high-yield market share is fairly distributed, with the top 10 managers making up 57.2% of all assets.
High-yield institutional fees have a median of 47.00 bps. This is for commingled and separate account vehicles in institutional plans.
Public Defined Benefit is the top leader in high-yield debt by a factor of 2X YTD 2023. The top two buyers of high-yield debt YTD 2023 were:
1. Public Defined Benefit
2. Operating Reserve (primarily Healthcare Operating Reserve)
Actively Managed US Long-Duration Debt
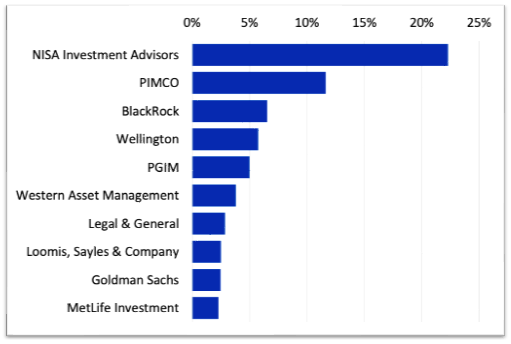
Market share in long-duration debt is led by NISA followed by PIMCO. Undoubtedly a large portion of the long-duration debt is government debt. Long-duration debt is concentrated. The top 10 managers make up 65.1% of the market share.
Long-duration debt sells for 23.00 bps for commingled and separate accounts to institutional plans.
Corporate Defined Benefit plans are the overwhelming buyer of long-duration debt YTD 2023. Corporate Defined Benefit plans bought approximately 4X the second buyer, Public Defined Benefit. The top buyers of long-duration debut YTD 2023 were:
1. Corporate Defined Benefit
2. Public Defined Benefit
Actively Managed US Short-Duration Debt
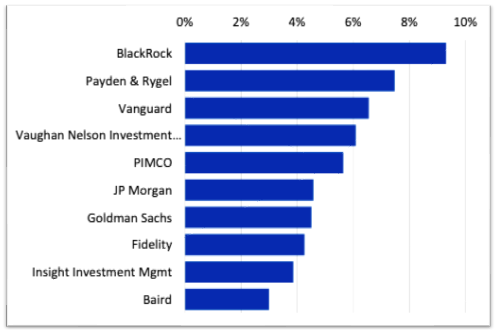
Market share in short-duration debt is less concentrated than in long-duration debt. BlackRock leads followed by Payden & Rygel and Vanguard. The top 10 managers of short duration debt make up 53.2% of the total market for short-duration debt.
The median bps for short-duration debt to institutional plans is 20.00 bps. However, the upward tail is fairly long. That means that most plans are paying nearly 20 bps, but a few plans are paying 50 & 60 bps.
The top buyers of short-duration debt in 2023 were:
1. Health & Welfare (these are primarily Taft-Hartley Health and Welfare plans)
2. Operating Reserve (these are primarily Healthcare Operating Reserve plans)
Actively Managed US Government & Treasury Debt
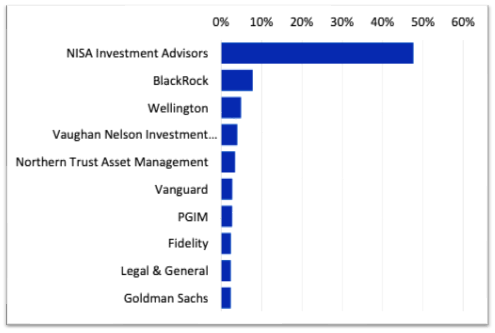
Market share in actively managed US government and treasury debt is highly concentrated. NISA controls 48% of the market.
Fees for US government and treasury debt to institutional plans have a median of 15.88 bps. This is for separate account and commingled vehicles.
YTD 2023 buyers of US government and treasury debt were:
1. Health and Welfare (primarily Taft-Hartley Health and Welfare)
2. Corporate Defined Benefit
Actively Managed US Municipal Debt
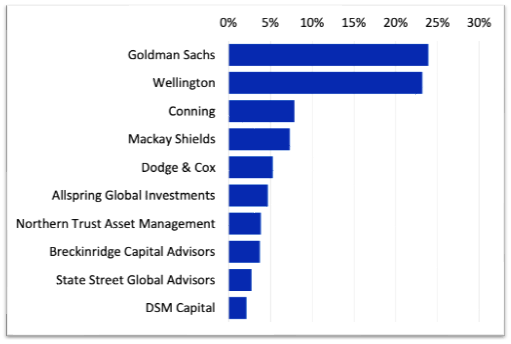
Municipal debt is a small fraction of all government and treasury debt. Two asset managers make up a large portion of the market for municipal debt. Goldman Sachs and Wellington each makeup over 23% of the market for municipal debt. The two managers combined make up 47.1% of the market.
Fees to municipal debt show a similar trend to all government debt. The median is near the lower end of the spectrum at 20.00 bps, while some plans pay over 60 bps.
High net worth plans really make up the only buyers of municipal debt in 2023.
Conclusion
The US actively managed equity market was not great for institutional asset managers in 2023. Most plans were buying debt in lieu of actively managed equity. However, there was a fairly large amount of manager replacement in the standard 9-box equity style categories.
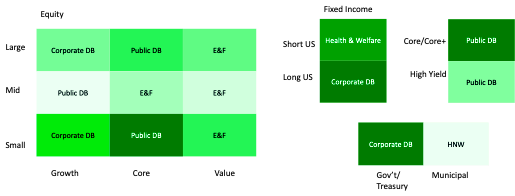
- Endowments & Foundations tended to prefer acquiring value equity in 2023. If you offer actively managed value equity, E&F are the largest and most likely buyers in 2023.
- Public DBs are consistently the buyers for actively managed core equity in 2023. If you are offering actively managed core equity, Public DB will be the largest and most likely buyers in 2023.
- Corporate DBs are consistent buyers for actively managed growth equity in 2023. If you are offering actively managed growth equity, Corporate DB are the largest and most likely buyers in 2023.
- All defined benefit plan types were more likely to buy debt than equity in the first three quarters of 2023
The color of the charts indicates the quantity of institutional assets won in the peer group. The name in the box is the top buyer YTD 2023.
Disclaimer
The material presented in this document is an assessment of the market environment as of the date indicated, is subject to change, and is not intended to be a forecast of future events or a guarantee of future results. This information should not be relied upon by the reader as research or investment advice regarding any funds or any issuer or security or similar.
This document contains general information only, does not consider an individual’s financial circumstances and should not be relied upon for an investment decision. Rather, an assessment should be made as to whether the information is appropriate in individual circumstances and consideration should always be given to consult a Financial Advisor before making an investment decision.
Confluence does not provide investment advice and nothing in this document should be considered any form of advice. Confluence accepts no liability whatsoever for any information provided or inferred in this document.
About Confluence
Confluence is a leading global technology solutions provider committed to helping the investment management industry solve complex data challenges across the front, middle, and back offices. From data-driven portfolio analytics to compliance and regulatory solutions, including investment insights and research, Confluence invests in the latest technology to meet the evolving needs of asset managers, asset owners, asset servicers, and asset allocators to provide best-of-breed solutions that deliver maximum scalability, speed, and flexibility, while reducing risk and increasing efficiency. Headquartered in Pittsburgh, PA, with 750+ employees in 15 offices spanning across the United Kingdom, Europe, North America, South Africa, and Australia, Confluence services over 1000 clients in more than 40 countries.
In this article:
- Actively Managed US Small-Cap Growth
- Actively Managed US Small-Cap Core
- Actively Managed US Small-Cap Value
- Actively Managed US Mid-Cap Growth
- Actively Managed US Mid-Cap Core
- Actively Managed US Mid-Cap Value
- Actively Managed US Large-Cap Growth
- Actively Managed US Large-Cap Core
- Actively Managed US Large-Cap Value
- Actively Managed US-Core/Core+ Debt
- Actively Managed US High-Yield Debt
- Actively Managed US Long-Duration Debt
- Actively Managed US Short-Duration Debt
- Actively Managed US Government & Treasury Debt
- Actively Managed US Municipal Debt
- Conclusion


