A look at volatility and value at risk
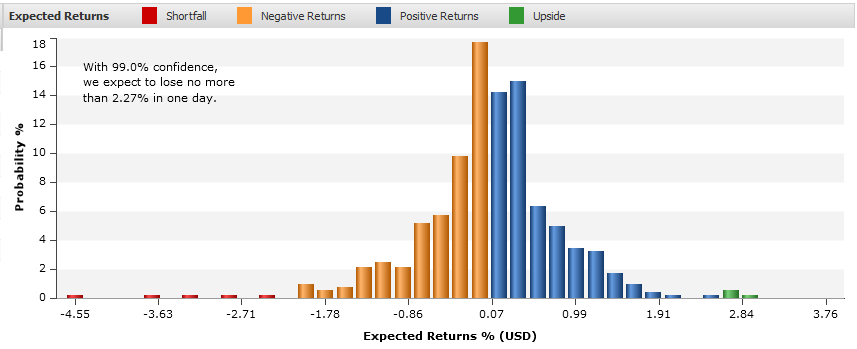
The starting point for most of our (StatPro) risk statistics is a set of over 500 different possible outcomes that a portfolio or security can expect to realize over a one-day horizon. This set of possible outcomes is called a distribution of expected returns and is presented as a histogram as below.
The two most common measures of risk today are volatility and value-at-risk (VaR): We define volatility as the standard deviation of all the possible outcomes around a mean; VaR is defined as the maximum probable loss given a confidence level and time horizon. It answers the following question: With a 99% confidence level, what is the most I can expect to lose over the next day? It corresponds to the expected outcome on the distribution that represents the confidence level. For example, if the confidence level is 99%, the corresponding outcome is the one that occupies the 99th percentile rank.
While the more popular measure of risk is volatility, VaR specifically focuses on expected loss. A stock can be volatile because of sudden gains and losses, but most investors are not averse to sudden gains. Investors are generally more concerned with loss and the consequences of the shape of the distribution, which is captured with VaR.
Read: New Insights for Asset Managers: How Technology Can Drive the Most Effective Middle Offices
The key to our methodology is our simulation model. To obtain the 500+ possible outcomes, we simulate what would happen to the price of a security given different market environments. These market environments are drawn from the preceding two-year window (or roughly 500 different environments). We ‘simulate’ prices rather than simply taking prices from history because the behavior of securities changes over time. A bond today will behave differently from how it performed a year ago. For this reason, our methodology is called historical simulation. The advantage of this methodology is that it is more robust and easier to understand than competing approaches. There are no parametric assumptions in correlation structures and decay factors that need to be made. The focus is on a reliable and stable methodology that can be easily explainable.
The solution
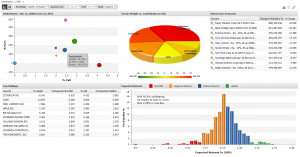
The risk dashboard in StatPro Revolution was designed to be intuitive for both fund investors and fund managers. In one glance, both audiences can see where the risk/return trade-off is, which sectors and securities contribute the most to VaR, and how the portfolio may perform during stressed environments.
What may be meaningful for managers is the shape of the expected distribution. Since the distribution histogram is clearly displayed, any latent risk lurking at the tails is explicitly shown and is captured in a measure called expected shortfall, which is the average of all the losses beyond the confidence level. During the first half of 2008, for example, many structured products such as ABS and CDO exhibited negatively skewed distributions.


