January 2024
Factor Performance Analysis
Quality, Momentum, and Size equities kick off 2024
by:
Market Background
As a result of this persistence, the factor trend has stayed relatively consistent from December to January, captured by the emphasis on Momentum this month. The largest change observed was the reversal from Volatility to Quality stocks globally. 2023 was an exciting year for volatile equities, but as markets moved into the final month of the year and now the beginning of 2024, investors are rewarding net profit margins, gross profit-to-asset ratios, and stability within both earnings and sales growth over Volatility.
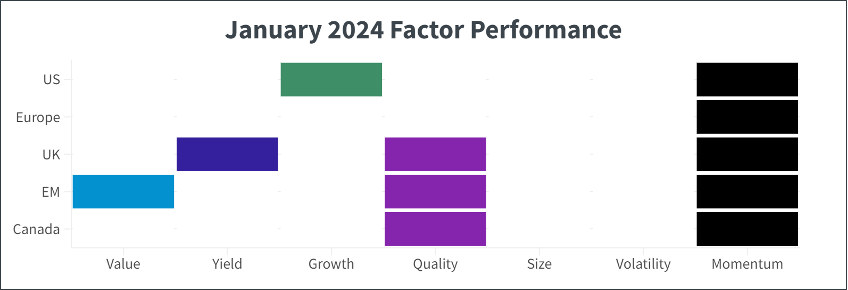
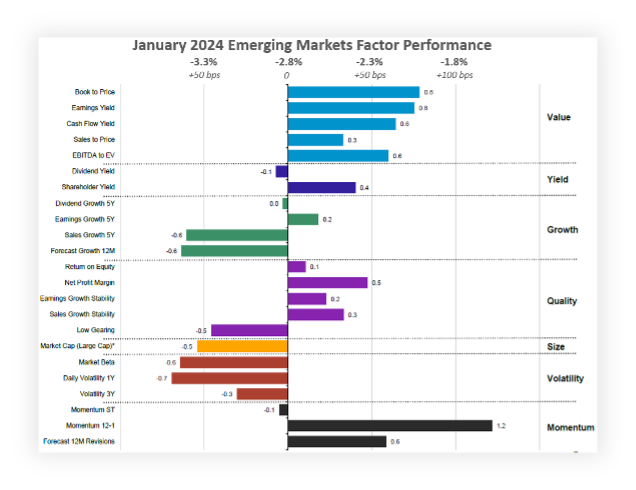
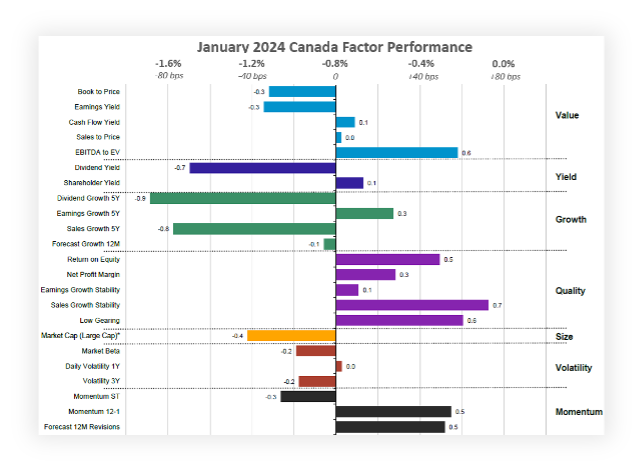
Europe’s factor premium and discount were marginal this month. Still, notably, Value underperformed for the first time in months there and in the UK, both of which had favored Value equity consistently for the last couple of years. Although Value underperformed, high-yield stocks held their ground throughout the month in these regions. Growth and specific Quality metrics were favored in the US, but the Quality outperformance was more prominent in UK, Canada, and Emerging Markets.
Crude oil peaked at $78/barrel in January, and although it decreased to $71/barrel by month’s end, the price has climbed back to the $75/barrel mark as of the first week of February.
Gold surged in Q4 alongside most equities and risk-on assets, rising from the $1850-$1950/t.oz range to breaking $2,000/t.oz and stabilizing above that price point throughout January. After increasing by 40% in Q4, alternative risk-on assets like Bitcoin stabilized above the $40,000/BTC mark, opening and closing the month at $42,000/BTC.
Factor Summary
- US Equities: Growth and Momentum outperformed.
- European Equities : Momentum outperformed.
- UK Equities: Yield, Quality, and Momentum outperformed.
- Emerging Market Equities: Value, Quality, and Momentum outperformed.
- Canadian Equities: Quality and Momentum outperformed.
US Equities
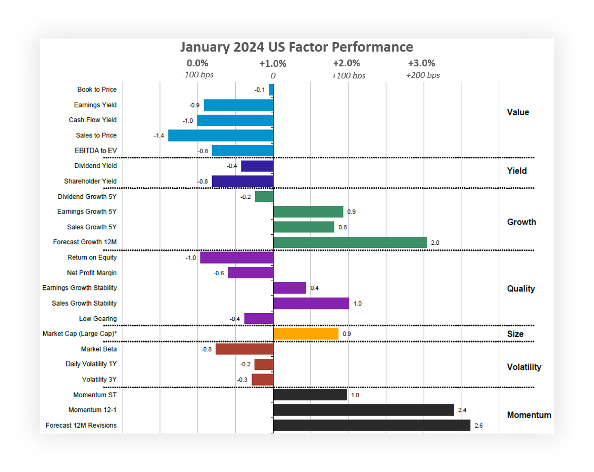
Quality subfactors, particularly sales growth stability and earnings growth stability, outperformed by bps 40-100 bps as well, and large caps outperformed the market again by 90bps, indicating how narrow the US equity market is with the interest in AI and the tech sector. On the other hand, Value and Yield stocks underperformed yet again, lagging the market by 80-140bps. Alongside forecast growth, momentum drove the US market in January as we saw repeating trends to the last quarter, and even six months.
Apart from the reversal in volatility, all other factors closely reflect the 6-month trend, thereby contributing to the robust monthly momentum observed over the past year. This momentum, captured by the 12-1 Momentum indicator, highlights the consistency of performance trends. From a macroeconomic perspective, the persistence in Growth’s outperformance could be linked to positive economic data, as consumer spending, manufacturing, non-farm payrolls, and consumer confidence all hit a yearlong high in January.
The Magnificent 7 drove the US Growth surge in January, led by Nvidia (+24%); and Meta (+10%). Outside of that, Eli Lilly (+10%), Netflix (+15%), AMD (+13%), and Super Micro Computer (+86%) all had strong forecast earnings growth over the next 12 months.
Source: Investment Metrics, a Confluence company.
European Equities
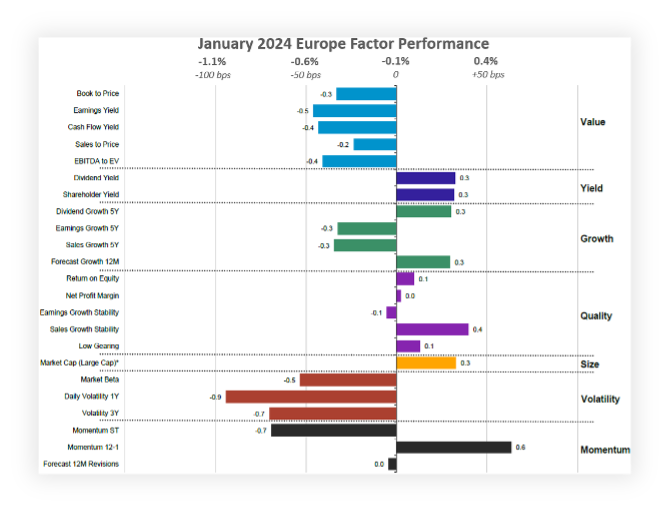
Similarly to the US, both sales growth stability, monthly momentum over the last year, and forecast growth over 12 months outperformed, but to a much smaller extent, as European equities tend to have smaller factor premiums than their American counterparts. Likewise, Volatility also underperformed after a strong trend in 2023.
Europe had overtaken the US in the disinflation race last year, a trend which may have persisted into 2024 as the Euro Zone’s inflation rate slightly decreased to 2.8%. While the US hasn’t posted CPI data for January as of this report, their December rate of 3.4% would need to decrease significantly to beat Europe’s to the 2% target. Likewise, after hitting a high of 2.96% in October, the German 10-year Bund hit a low of 1.89% on December 27th before closing January out at 2.31%.
Key drivers of high-Quality European stocks with stable sales growth this month include German weapons manufacturer Heckler & Koch (+15%); French lottery organizer Francasise des Jeux (+12%), Italian bank Banca Popolare Di Sondrio (+18%) and Siemens Energy (+14%).
Source: Investment Metrics, a Confluence company.
UK Equities
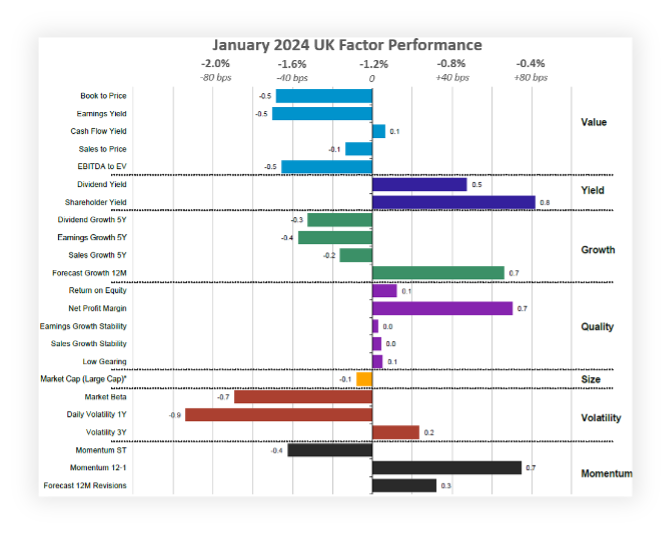
The UK market’s performance shadowed that of other Developed Markets again this month, decreasing by 1.2%, underperforming European equities by roughly 1% and US equities by 2%.
Examining economic indicators, the unemployment rate decreased slightly from 4.0% to 3.9%, the S&P Manufacturing PMI and the S&P Construction PMI both slowed their contraction but continued shrinking for the fifth consecutive month. Retail sales also fell by 3.2% in December, but this was partly due to a higher revised figure for November, indicating shoppers purchased gifts earlier in the 2023 holiday season. However, when examining the full year, retail sales have hit their lowest point since 2018, declining by 2.8% for the year.
British stocks with a strong net profit margin that outperformed this month include pharmaceutical company Indivior (+16%); videogame label Team17 Group (+45%); financial software provider Alfa (+22%), and biopharma company GSK PLC (+8%), the latter of which has returned over 41% in the past 3 months.
Source: Investment Metrics, a Confluence company.
Emerging Market Equities
Emerging Markets equities that outperformed consistently on a monthly basis over the last year, captured by the Momentum 12-1 subfactor, include Indian energy company Oil & Natural Gas Corporation (+23% in January, +40% in the last three months); another Indian energy firm Reliance Industries (+10% in January, +25% in the last three months); Indian automobile manufacturer Tata Motors (+13% in January, +41% in the last three months); Indian tech firm HCL Technologies (+8% in January, +24% in the last three months) and Indian utilities company NTPC Limited (+2% in January, +36% in the last three months).
Source: Investment Metrics, a Confluence company.
Canadian Equities
A notable trend in Canada, like in other Developed Markets, was the outperformance of stocks with solid Quality fundamentals. The trend here was stronger in Canada, where all Quality subfactors outperformed, particularly stocks with a favorable return on equity, low debt/equity ratios, and, most profoundly, stable sales growth.
Stocks with a steady sales growth stability in the region that outperformed include companies like tech company Constellation Software (+11% in January, +38% in the last three months), energy firm Cameco Corp (+10% in January, +17% in the last three months); Fairfax Financials (+14% in January, +29% in the last three months); food and drug retailer George Weston Limited (+2% in January, +18% in the last three months) and materials company Ivanhoe Mines (+8% in January, +40% in the last three months).
Source: Investment Metrics, a Confluence company.
Appendix: How to read the charts
For example, for the book-to-price factor, we determine the period’s performance of the basket of stocks with the highest book-to-price values, relative to the total market. Each factor is analyzed independently, market and fundamental data are adjusted to enable sector-average (within each country) relative data to be used, and the performance measurement isolates the factor’s contribution to return.
Disclaimer
The information contained in this communication is for informational purposes only. Investment Metrics, a Confluence company, is not providing legal, financial, accounting, compliance or other similar services or advice through this communication. Recipients of this communication are responsible for understanding the regulatory and legal requirements applicable to their business.
About Confluence
For more information, visit: confluence.com

