Institutional Defined Benefit Plan Targeting
Confluence helped an Asset Management firm define a debt distribution strategy based on client types and sizes, moving to LDI with the Prism Analytics platform.
Situation
The core mission of this multinational asset management company is to provide excellent investment performance to its clients through active decision-making. They select companies with responsible and durable business models, those that are evolving to survive and thrive through the challenges ahead. They are a leading specialist in impact investing for clients who want to maximize positive change.
Challenge
This multinational client recently approached Confluence with a unique proposition. They wanted to sell their debt products to plans that were adopting a liability-driven investment (LDI) structure. LDI is a popular strategy among well-capitalized institutional plans, such as pension funds and insurance companies. These plans have long-term financial obligations. LDI aims to match the cash flows generated by assets to the cash flows required by liabilities. This attempts to minimize the risks that could affect returns, such as market volatility. LDI is a form of asset-liability management (ALM), which considers the assets of a plan in the context of its liabilities.
LDI is suitable for situations where future liabilities can be estimated with some degree of accuracy. An example is payouts to pensioners in defined benefit plans. LDI usually involves hedging the plan’s exposure to changes in interest rates and inflation using bonds and derivatives. LDI-managed plans can fund their obligations through the cash generated by investment activity. They have the assets to generate the amount of cash needed to meet their obligations. LDI can help the plan achieve their objective of meeting its obligations while reducing risk.
Debt strategies are often employed in an LDI structure, as debt provides a perceived lower risk and consistent cash flow that matches the long-term liabilities of pension plans and insurance companies. However, debt also has a lower return profile, which may not be sufficient to cover the funding gap of underfunded pensions. LDI is similar to an endowment in the sense that it only spends the cash generated from the investments, but unlike endowments, LDI has to deal with the low-risk expectations that come with providing for pensioners.
The proportion of debt in an LDI structure can vary depending on the type and size of the plan. Typically, pensions allocate around 30% of their assets to debt, although some may have a lower allocation. Pensions that are underfunded may need to take on more risk to generate the returns necessary to meet their obligations. LDI-managed obligations can have up to 100% debt allocation.
To solve this complexity, the asset management firm wanted to determine the plan type and size with a higher chance of adopting an LDI structure. This would mean a greater need for the debt products that the firm provides. Targeting and selling to those who are more likely to buy is a sound business growth strategy.
Targeting and selling to those who are more likely to buy is a sound business growth strategy.
Analysis
The first step to helping this multinational asset management company was to understand which plans were most likely to move to an LDI structure. Moving to an LDI structure usually involves purchasing fixed-income products. The Confluence and Asset Management firm’s team needed to understand which client type would be the best option.
Four client types were analyzed:
- Endowments & Foundations (E&F)
- Public Defined Benefit (Public DB)
- Taft-Hartley Defined Benefit (Taft-Hartley DB)
- Corporate Defined Benefit (Corporate DB)
We assumed most of the plans moving to LDI were DB, but we wanted to verify that assumption. The client was searching for plans that had a larger than normal fixed income allocation. However, this allocation needed to be less than 100%. At 100% fixed income allocation, the plan has already transitioned to LDI, therefore not a target opportunity. Those with 100% fixed income allocation would only be a manager replacement target, not LDI.
The client was searching for plans that had a larger than normal fixed income allocation but less than 100%.
Endowments & Foundations
Using Prism Analytics, E&F was analyzed first to create a baseline of what an institutional plan was doing to move to a more debt oriented structure. Interestingly, there were a few E&F plans with 100% of the plan made up by debt. The proportion of E&F plans with 100% debt allocations was higher than that of public DB plans.
The following chart highlights the percentage of plans and assets in each of the debt allocation buckets.
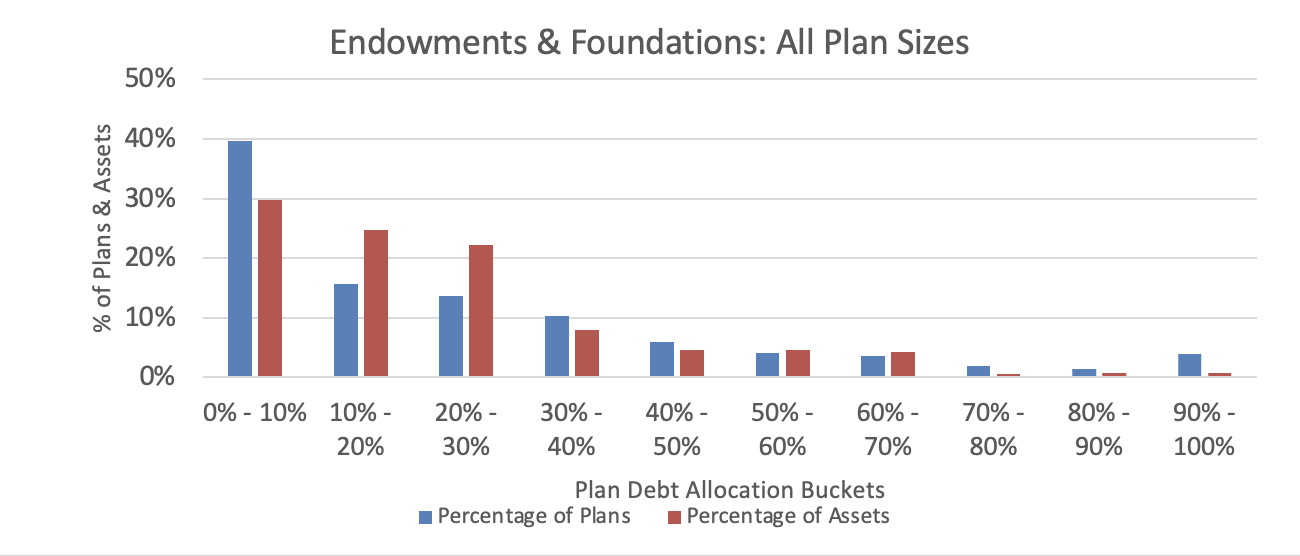
Fig 1. The percentage of plans and assets in each of the debt allocation buckets.
The vast majority of E&F plans had below a 30% allocation to debt, signified by the blue bars. There were a few plans with 40%-80% allocations that signify a movement to LDI. However, the assets in the plans with 40%-80% of the plan allocated to debt, were smaller. Smaller E&F plans were more likely to pursue a 100% debt structure. It is probably not surprising to learn that E&F is not a great place to pursue opportunities if a debt manager seeks to capitalize on LDI trends.
Public DB
Public DB was the second client-type considered but was quickly abandoned. There simply were not many public plans in the greater than the average but less than 100% debt allocation buckets. In fact, there were very few Public DB plans in the 90%-100% bucket. This signified plans that have already gone LDI. The few plans that were at the 90%-100% debt allocation were small, with very few assets.
The client’s goal was to market their debt products to plans that were shifting to an LDI structure.
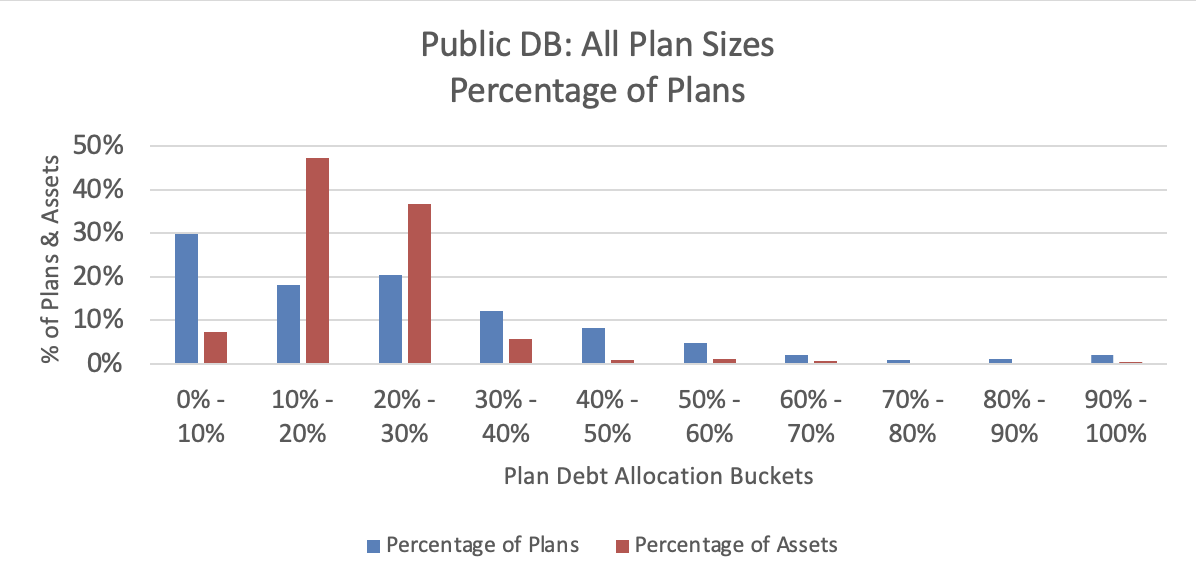
Fig 2. Few of the Public DB Plans moved beyond a 40% allocation to debt.
Public DB
Smaller public DB plans, with less than $500M, had a higher chance of moving to LDI than larger ones. This was similar to E&F, where smaller plans also had higher debt allocations.
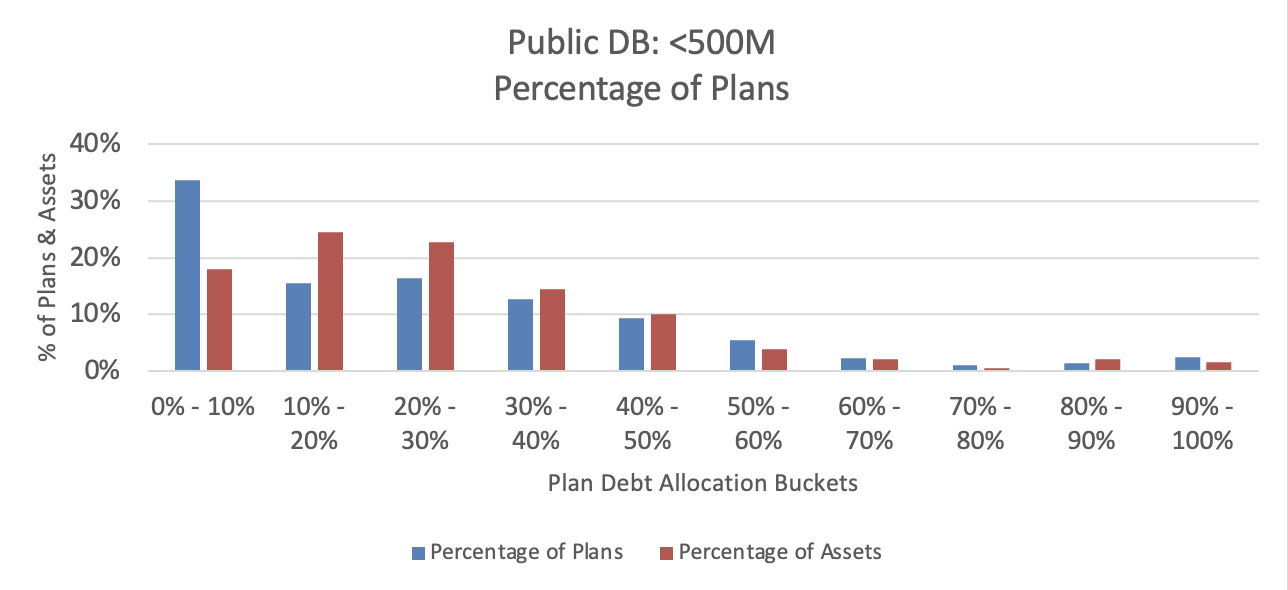
Fig 3. Smaller Defined Benefit Plans had a higher change of moving to a higher debt allocation.
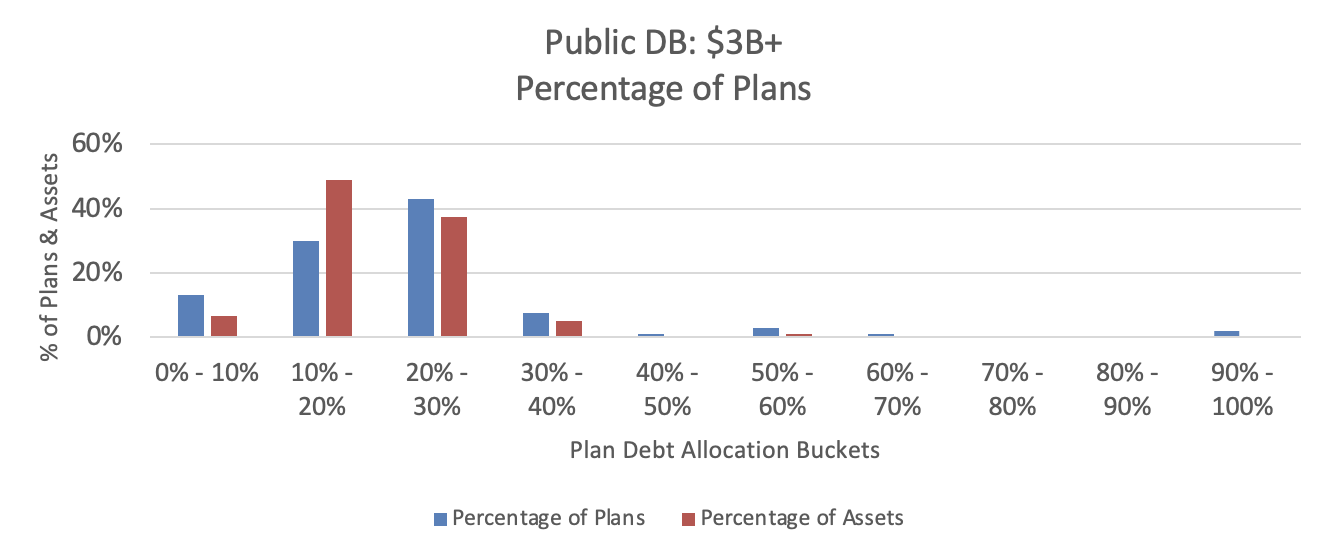
Fig 4. The public DB plans with more than $3B, hardly ever moved to 100% debt allocation.
Taft-Hartley DB
Taft-Hartley DB plans were the third client type tested. The analysis looked for plans that had more debt allocation than average but not 100% debt allocation. The client’s goal was to market their debt products to plans that were shifting to an LDI structure.
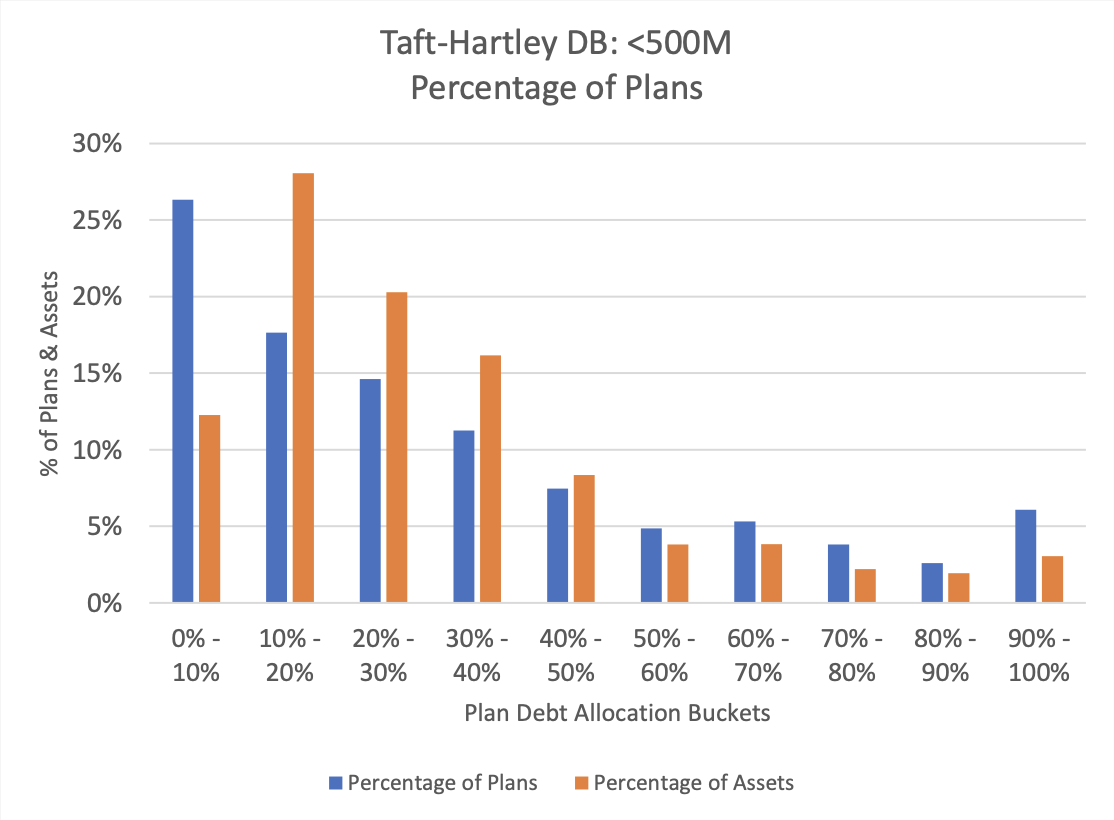
Fig 5. Smaller Defined Benefit Plans had a higher change of moving to a higher debt allocation.
More Taft-Hartley DB plans were moving to LDI than Public DB plans. Interestingly, the plans moving to LDI were across the size spectrum. Plans under $500M in AUM were the most likely to employ LDI strategies. But plans up to $3B were also likely to move to LDI. The only segment that did not appear to be moving to LDI was the over $3B segment.
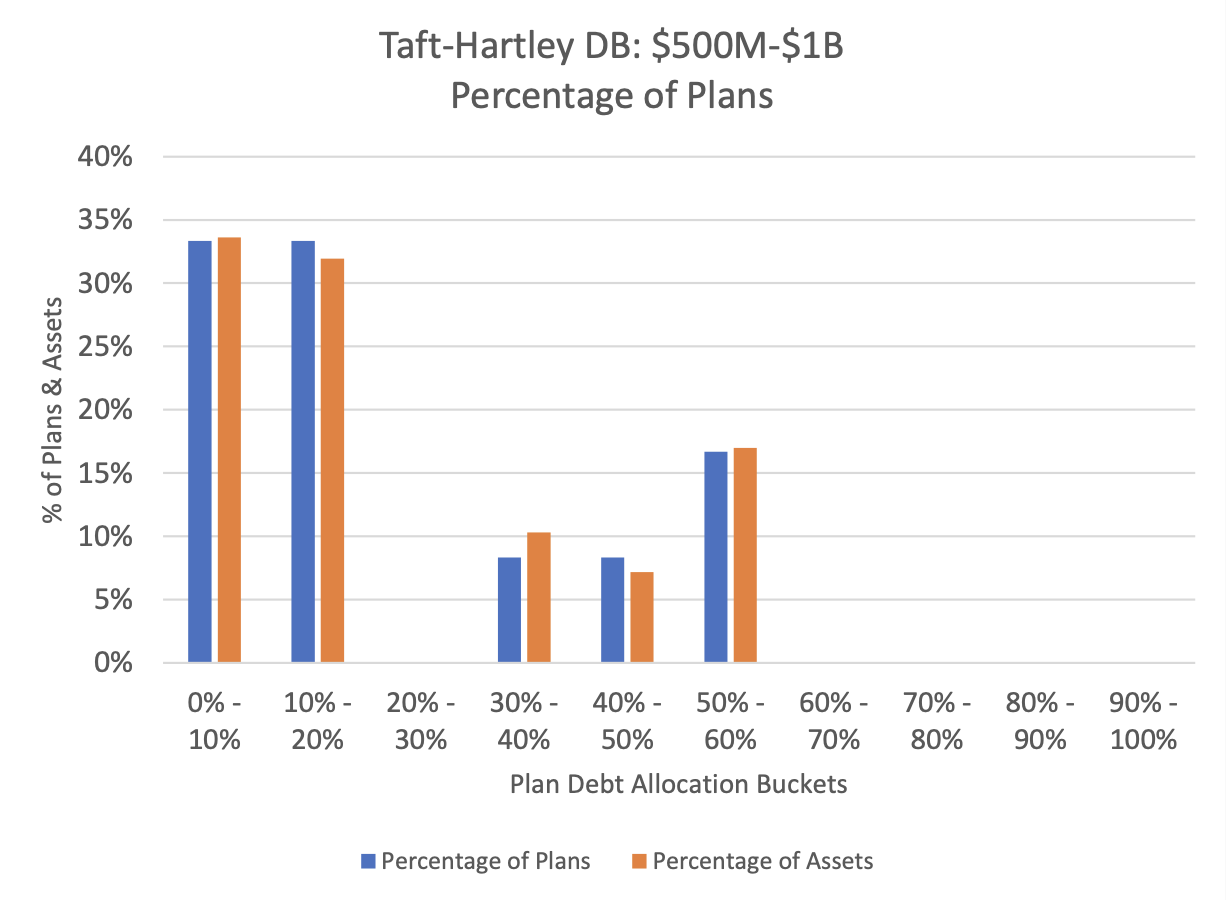
Fig 6. The Taft-Hartley DB plans, between $500M and $1B were moving to LDI.
Taft-Hartley DB
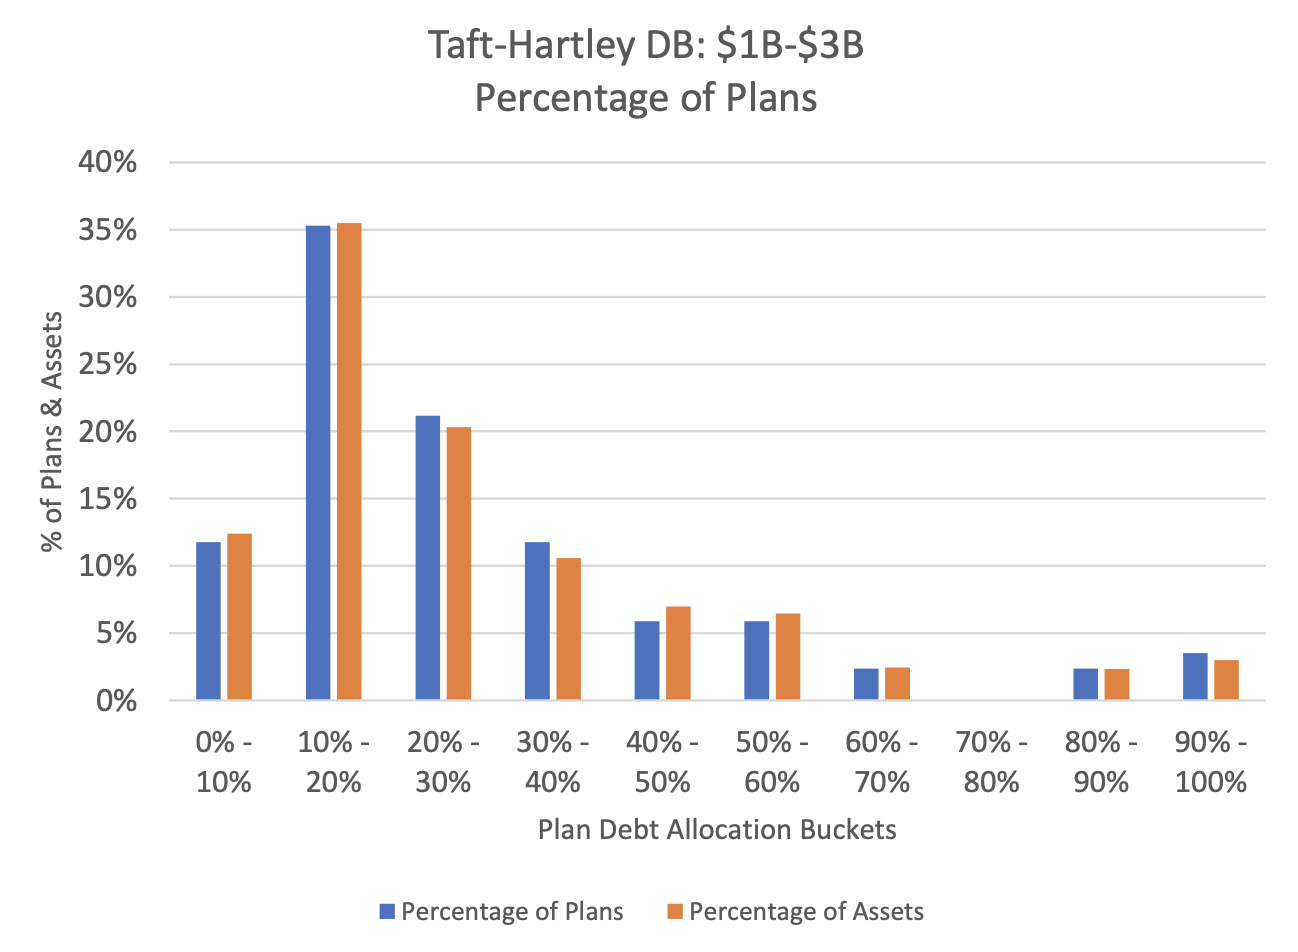
Fig 7. The Taft-Hartley DB plans, between $1B and $3B were moving to LDI.
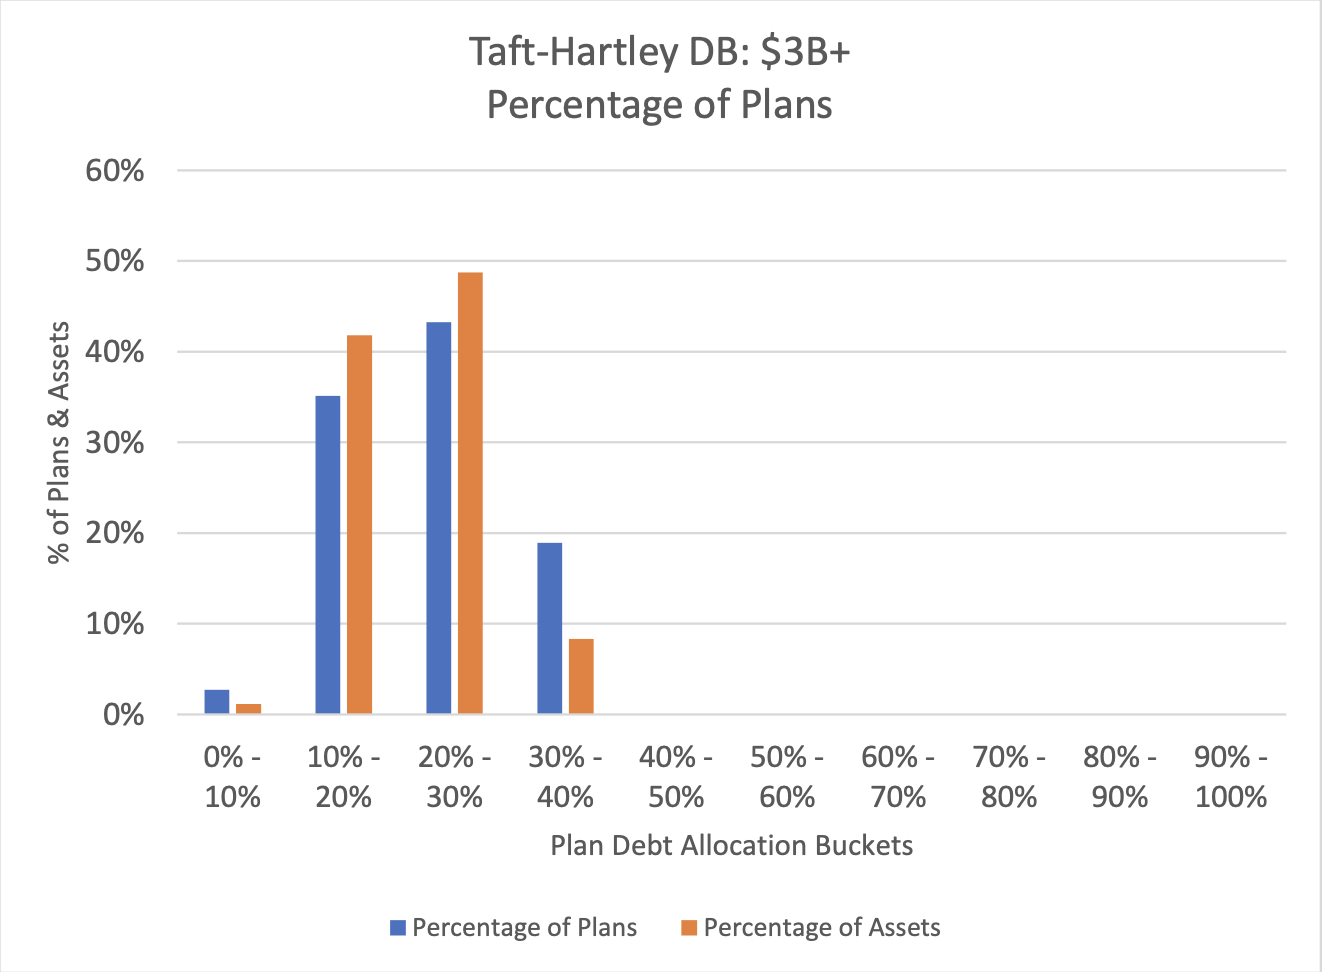
Fig 8. The Taft-Hartley DB plans greater than $3B were the least likely to move to LDI.
Corporate DB
Corporate DB was the final DB plan to analyze. The goal was still to find plans with greater than average debt allocation but under 100% allocation. The asset management firm was targeting plans that could be moving to LDI because of higher debt allocations.
Corporate DB turned out to be the most likely to move to LDI. A large percentage of plans appear to be on their way to LDI, and a large percentage already fully debt-allocated. The larger corporate DB plans were more likely to be moving to LDI than the smaller plans. This is the opposite of what we saw in public DB plans. Corporate DB plans below $500M were fairly evenly spread across the debt allocation spectrum, with the exception of 0-10% debt allocation. There was a large quantity of sub $500M corporate DB plans with 0-10% allocation to debt.
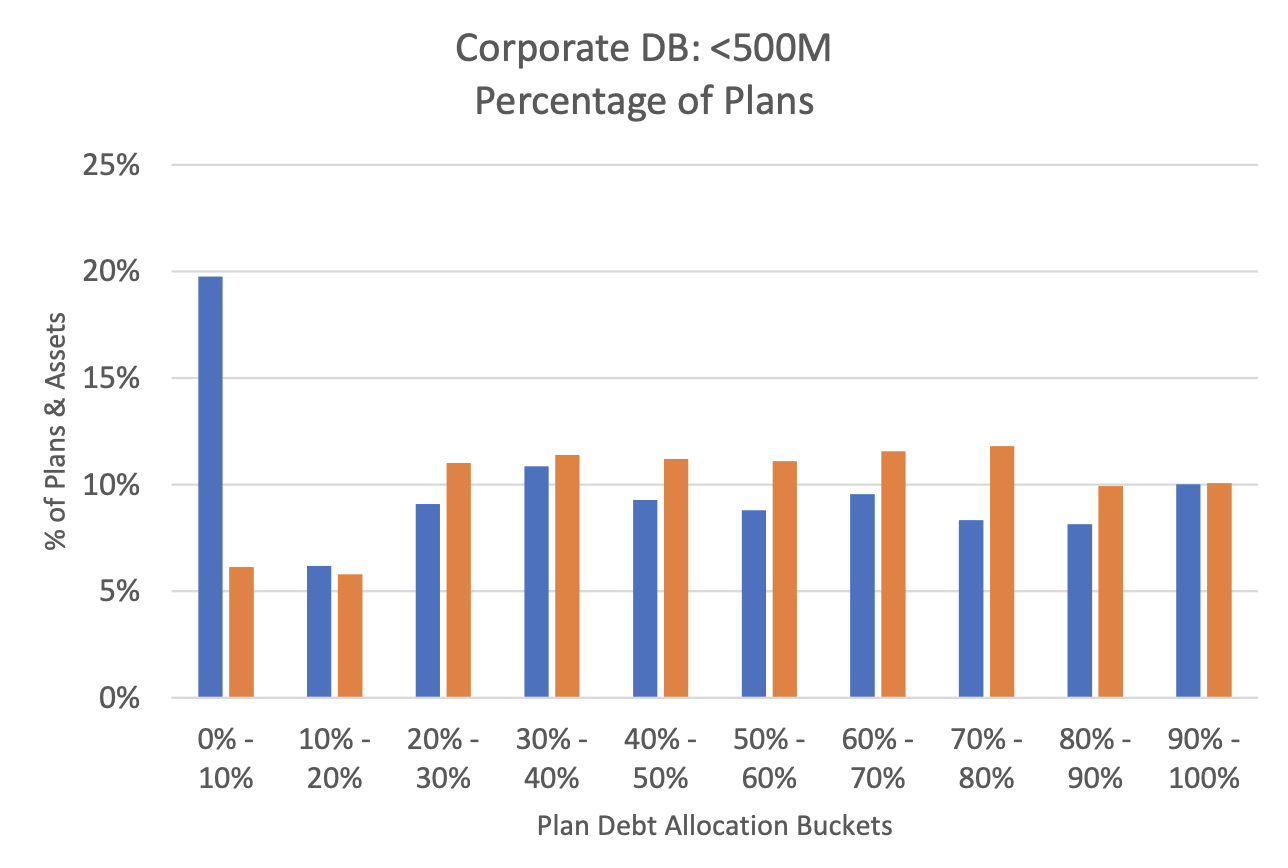
Fig 9. Corporate Define Benefits plans under $500M were evently spread across the debt allocation spectrum.
Corporate DB plans were 45% allocated to debt as of 3Q 2023. That meant the target audience was plans with >45% debt allocation but less than 100% debt allocation. The quantity of Corporate DB plans below $500M that were not moving to LDI was significant. Above $1.5B AUM for corporate DB was also less likely to be moving to LDI. The sweet spot was corporate DB plans between $500M and $1.5B in size.
The larger corporate DB plans were more likely to be moving to LDI than the smaller plans
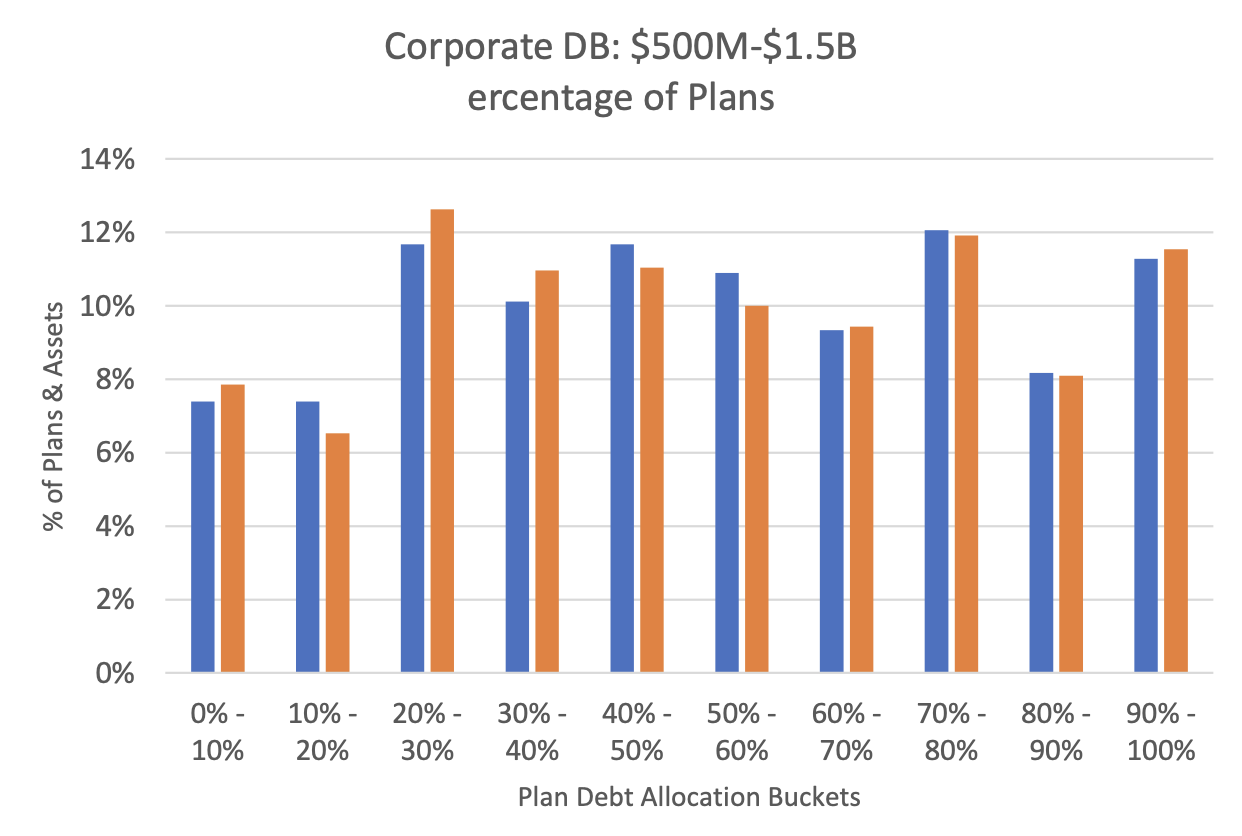
Fig 10. Corporate Define Benefits plans between $500M and $1.5B were the most likely to move to LDI.
Conclusions
The client was looking to sell their debt strategy to plans moving to Liability Driven Investing. The rationale was that clients moving to a fully LDI structure would have more assets available to debt managers.
The first step was understanding which plan types were moving to LDI. This was determined by looking at debt allocations. The target audience was a debt allocation above the norm but below 100% allocation.
Four client segments were examined:
| # | Category | Norm debt allocation | # Plans |
|---|---|---|---|
| 1 | Foundations & Endowments | 22% | 4.5k |
| 2 | Public DB | 20% | 1.5k |
| 3 | Taft-Hartley DB | 25% | 1k |
| 4 | Corporate DB | 45% | 2k |
Within each client type, the quantity and size of plans in each bucket were examined. Confluence’s Prism Analytics tracks roughly 15,000 institutional plans. About 9,000 of those plans are E&F, Public DB, Taft-Hartley DB, or Corporate DB.
The Corporate DB segment between $500M and $1.5B had the highest likelihood of having above the normal debt allocation yet below 100%. A few Foundations & Endowments were moving to LDI, however, the E&F plans moving to 100% debt allocation were typically smaller plans. Very few public DB plans were moving to 100% debt allocation, which is typical in an LDI structure. Those public DB plans that were moving to LDI were typically very small. A few Taft-Hartley DB plans were moving to LDI, however, the counts were low. The Taft-Hartley DB plans moving to LDI were also smaller. Corporate DB saw movement to 100% debt allocation across the plan size spectrum. However, corporate DB plans between $500M and $1.5B were the most likely.
Stay Ahead of Trends
With the help of Prism Analytics, this global investment firm could identify and target the most promising prospects for their debt solutions. They could improve their sales efficiency and success rate by focusing on the plans that were most likely to buy their liability-driven investment (LDI) structure. This way, they could continue to deliver excellent investment performance to their clients through active decision-making.
This is just one example of the types of analysis Prism Analytics can provide to Institutional Investment firms to see emerging trends before they become trends. The comprehensive reporting capabilities cover all major plan types and asset classes. Prism Analytics leverages PARis data, providing asset managers with unique market insights sourced from consultants.
Asset Manager Institutional groups can not only identify buyer segments to understand who is currently buying their firm’s investment types but also:
- Track Winning Managers: Determine which managers are securing mandates.
- Analyze Fee Structures: Examine fees by asset class, client type, plan type, and investment vehicle.
- Monitor Asset Flows: Track asset flows by channel.
- Assess Market Share: Measure market share by manager and mandates won and lost.
- Identify Market Leaders: Discover top market shareholders.
Data & Methodology
Confluence works with 80% of the top 20 institutional consultants in the United States, as ranked by AUA. The data contained in this report is an aggregation of approximately 15,000 plans. The data is all contained in Prism Analytics. The data is input into Confluence’s PARis platform by consultants. Approximately 9,000 or the 15,000 plans within Prism Analytics are classified as Foundations and Endowment, public DB, Taft-Hartley DB and corporate DB.
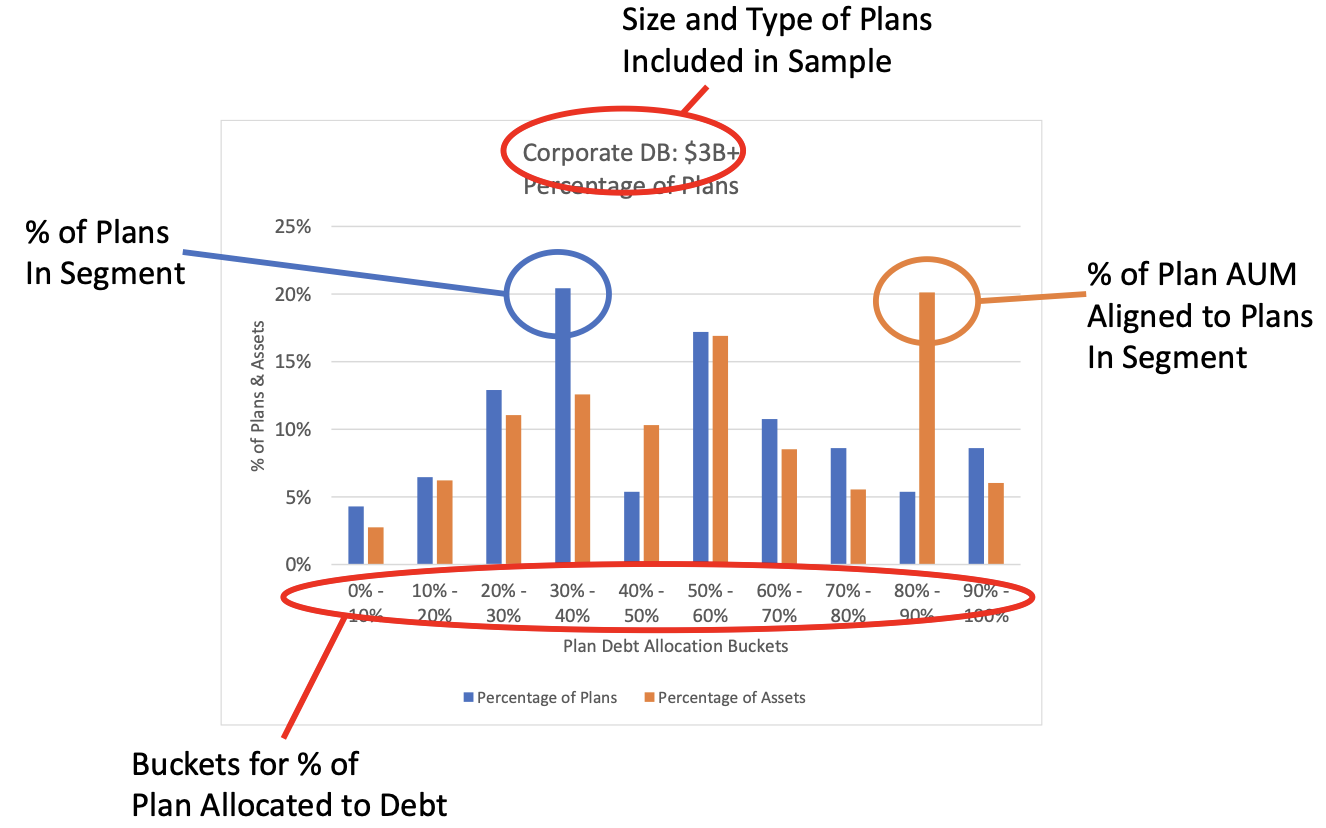
Each of the charts can be read using the following legend
About Confluence
Confluence is a leading global technology solutions provider committed to helping the investment management industry solve complex data challenges across the front, middle and back offices.
From data-driven portfolio analytics to compliance and regulatory solutions, including investment insights and research, Confluence invests in the latest technology to meet the evolving needs of asset managers, asset owners, asset servicers, and asset allocators to provide best-of-breed solutions that deliver maximum scalability, speed and flexibility, while reducing risk and increasing efficiency. Headquartered in Pittsburgh, PA, with 750+ employees in 15 offices spanning across the United Kingdom, Europe, North America, South Africa, and Australia, Confluence services over 1000 clients in more than 40 countries.