Report
Institutional Client Lifetime Revenue Report
Confluence’s first-of-a-kind analysis tool empowers users to explore our extensive dataset, conduct valuable research, and generate reports like this to assist asset managers in evaluating revenue retention, quantifying opportunities, and precisely valuing accounts.
by:
Executive Summary
Confluence’s first-of-a-kind analysis tool, available later this year, was used to create a new Institutional Client Lifetime Revenue report. This report aggregates and anonymizes over 30,000 plans and $7.5T dollars of institutional assets. We work with 80% of the top AUA institutional consultants (as ranked by P&I), to track plan policies, actual allocations and asset flows into thousands of institutional plans across the institutional client and plan type spectrums. Users will soon be able to use this tool to generate their own insights that institutional asset managers can benchmark against their peers. This will help them to determine if they are holding onto or losing revenue, help them better quantify opportunities and more accurately value client lifetime revenue.
Investment consultants currently use Confluence’s PARis platform, part of Investment Metrics, to report returns, policies, fees and exposures to plans. Because of the breadth and depth of data in Confluence’s solutions, we see a myriad of trends on private and public plans that most do not have access to. Private plans do not typically disclose information and public plans may disclose only some of this information. Confluence’s platform data can be refined down to the individual plan level with a much more granular breakout providing additional insights beyond the learnings below.
In this new report, based on our soon-to-be-launched Confluence analysis tool, plans are bucketed into several high-level groups. Every number is calculated from the bottom-up. There is no sampling or extrapolation.
To effectively promote their investment products or services and establish relationships with clients and consultants, investment managers often have many questions regarding sales, marketing, and consultant relations. Many questions are not properly addressed due to a lack of information or lack of data points because mandate opportunity information is not publicly available. These same investment managers have limited resources to expend chasing new opportunities.
Questions that often arise for institutional asset managers are:
- What opportunities for new accounts are available?
- Am I retaining accounts for higher or lower durations than peers?
- What matters most for retaining accounts and assets?
- Do I have the right vehicle for the client segment?
- If multiple vehicles are an option, what vehicle should I lead with for a plan?
- Am I chasing the highest profitability opportunities?
Highlights
Account durations or stickiness vary by plan sponsor type. The lifetime values consider the median fees for the vehicle, the asset class and the client type. Taft-Hartley defined benefit, separate account, debt accounts were almost 3X as sticky as the least sticky category: public defined benefit, mutual fund, debt accounts. Stickiness is defined as the duration that an investment manager holds the specific account.
- Debt and equity are very comparable in stickiness. The stickiness trend is clearly defined across client types, but the trend is mixed across asset classes.
- Mutual funds were generally the least sticky and paid the highest fees. This is not always the case by plan sponsor type.
- Commingled funds generally sit between separate accounts and mutual funds on both stickiness of accounts and fee BPS for those accounts.
- Separate accounts are the least expensive and generally the stickiest accounts.
- Foundations & Endowments are the least sticky plan type overall.
- Foundations & Endowments also opt for the least sticky vehicle, mutual funds, more than defined benefit plans.
Lifetime of Accounts Across the Industry
Durations by plan type, asset class and vehicle vary. That variance is no surprise to an asset manager as they know some accounts are stickier than others. The stickiness is impacted by a million factors including performance, employee turnover, market conditions, specific plan conditions, investment policy statements, vehicle and plan type. This report examines plan type, asset class and vehicle type.
Many asset managers know the longevity of accounts they manage but they may not know the longevity of institutional accounts across the industry. The chart below highlights the mean in years of stickiness of assets by plan sponsor type.
No trend is seen in asset classes, but we do see a clear trend in plan sponsor types.

Average Duration of Account by Client Type, Asset Class and Vehicle in Years from 2010-2022
The lifetime of separate accounts ranges from 6.5 years to over 10 years. While no trend is seen across asset classes, a clear trend is seen across plan sponsor types. Taft-Hartley is the stickiest. Public DB is the second stickiest.
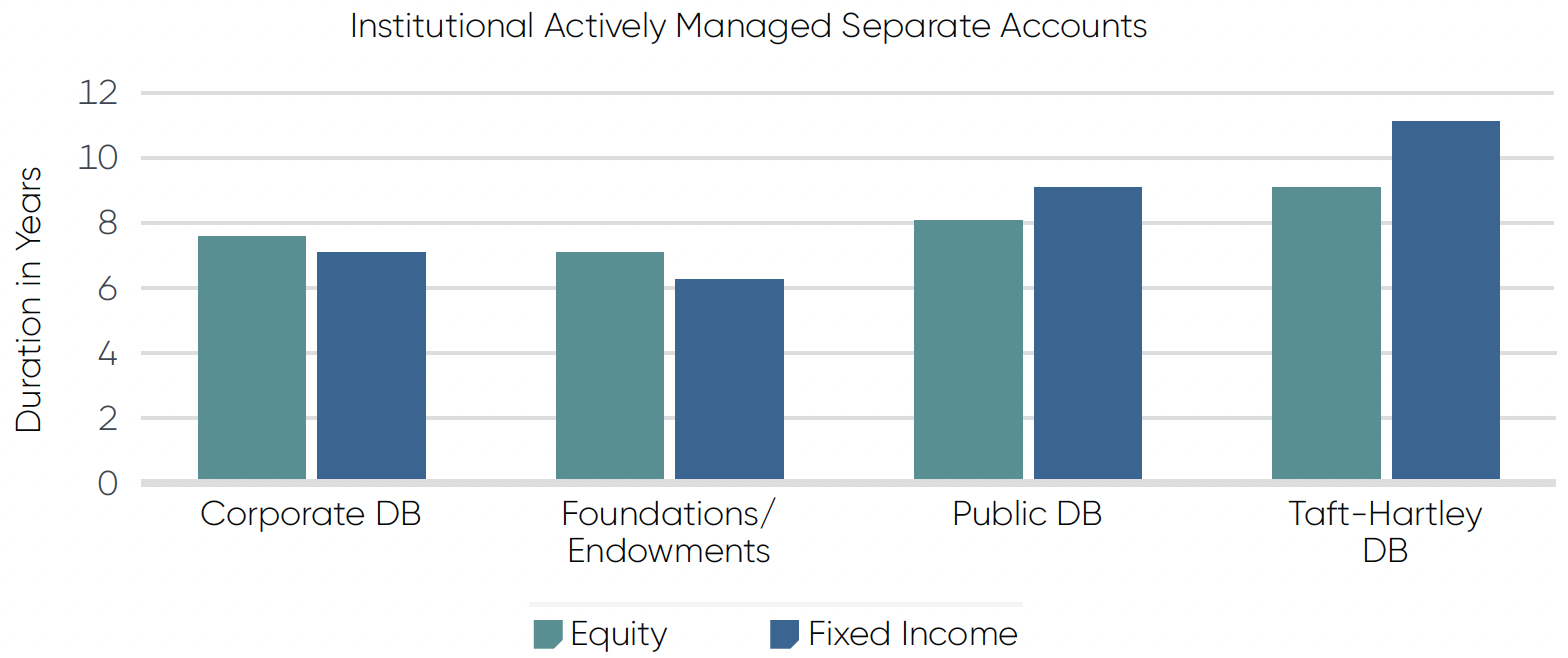
Actively Managed Mutual Fund Duration in Years
A very similar trend emerges when looking at the mean durations of commingled funds. Taft-Hartley and public DB lead for stickiness again. The trend is reversed between Foundations & Endowments and corporate DB. Foundations & Endowments are the least sticky client type for commingled funds in both equity and debt.
Taft-Hartley is once again the stickiest.
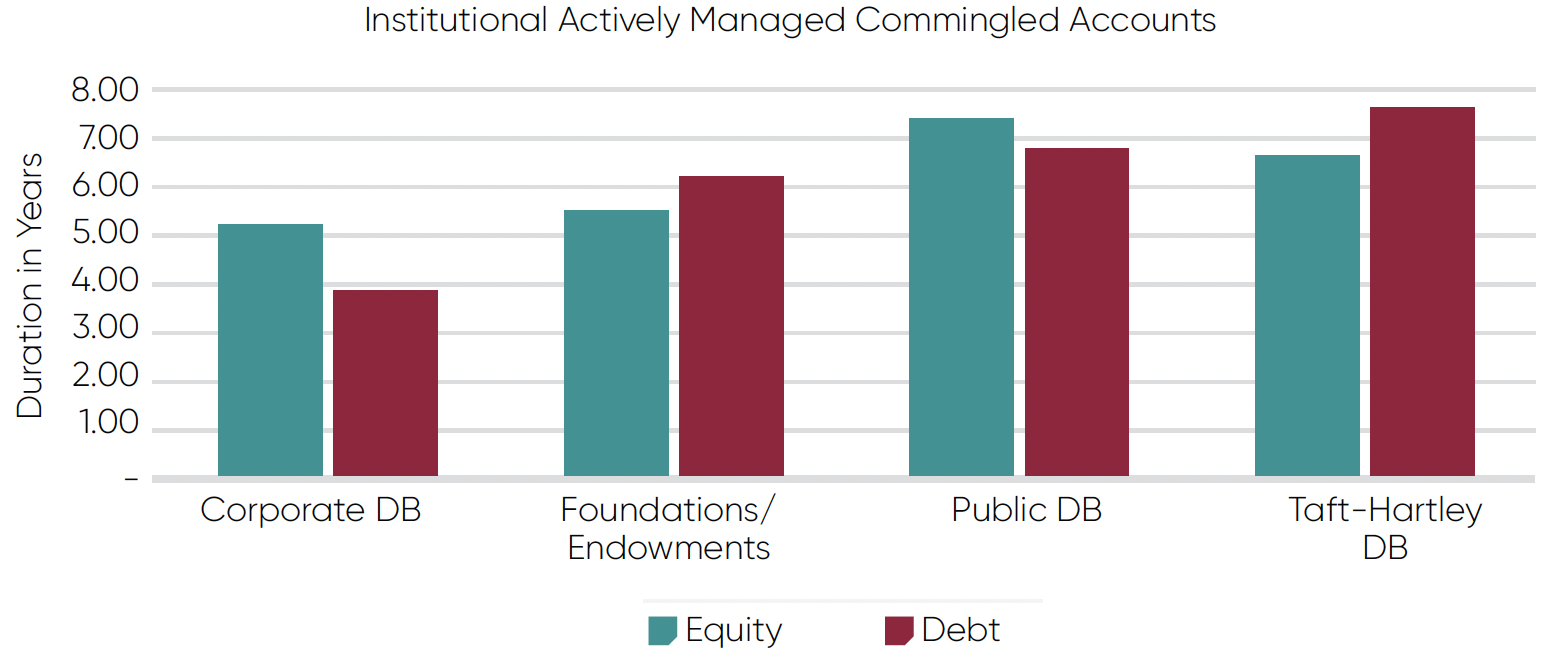
Actively Managed Commingled Duration in Years
Actively managed mutual funds paint a slightly different picture. Public DBs turn over actively managed institutional share class mutual fund accounts the quickest. Taft-Hartley is once again the stickiest.
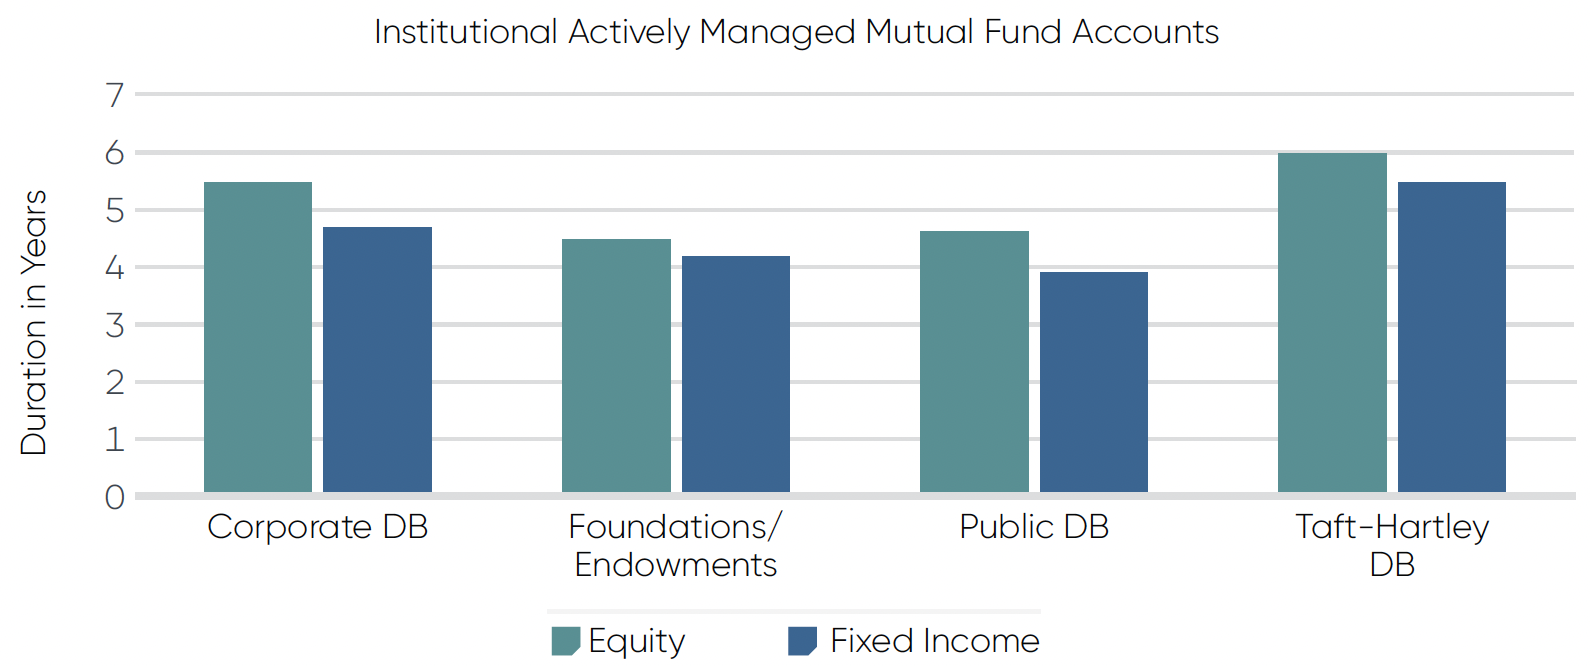
Actively Managed Mutual Fund Duration in Years
Corporate DB and Foundations & Endowments are the least sticky. The same overarching trends are seen in both equity and debt accounts. There are a few nuances where mutual fund longevity exceeds commingled fund longevity. However, the trend is clear in that mutual funds are the least sticky, followed by commingled and separate accounts. Institutional asset managers can use this information to benchmark internal operations and if they are holding onto or losing revenue relative to peers. A dollar saved pays the same as a dollar won.
Institutional asset managers can learn if they are holding onto or losing revenue relative to peers.
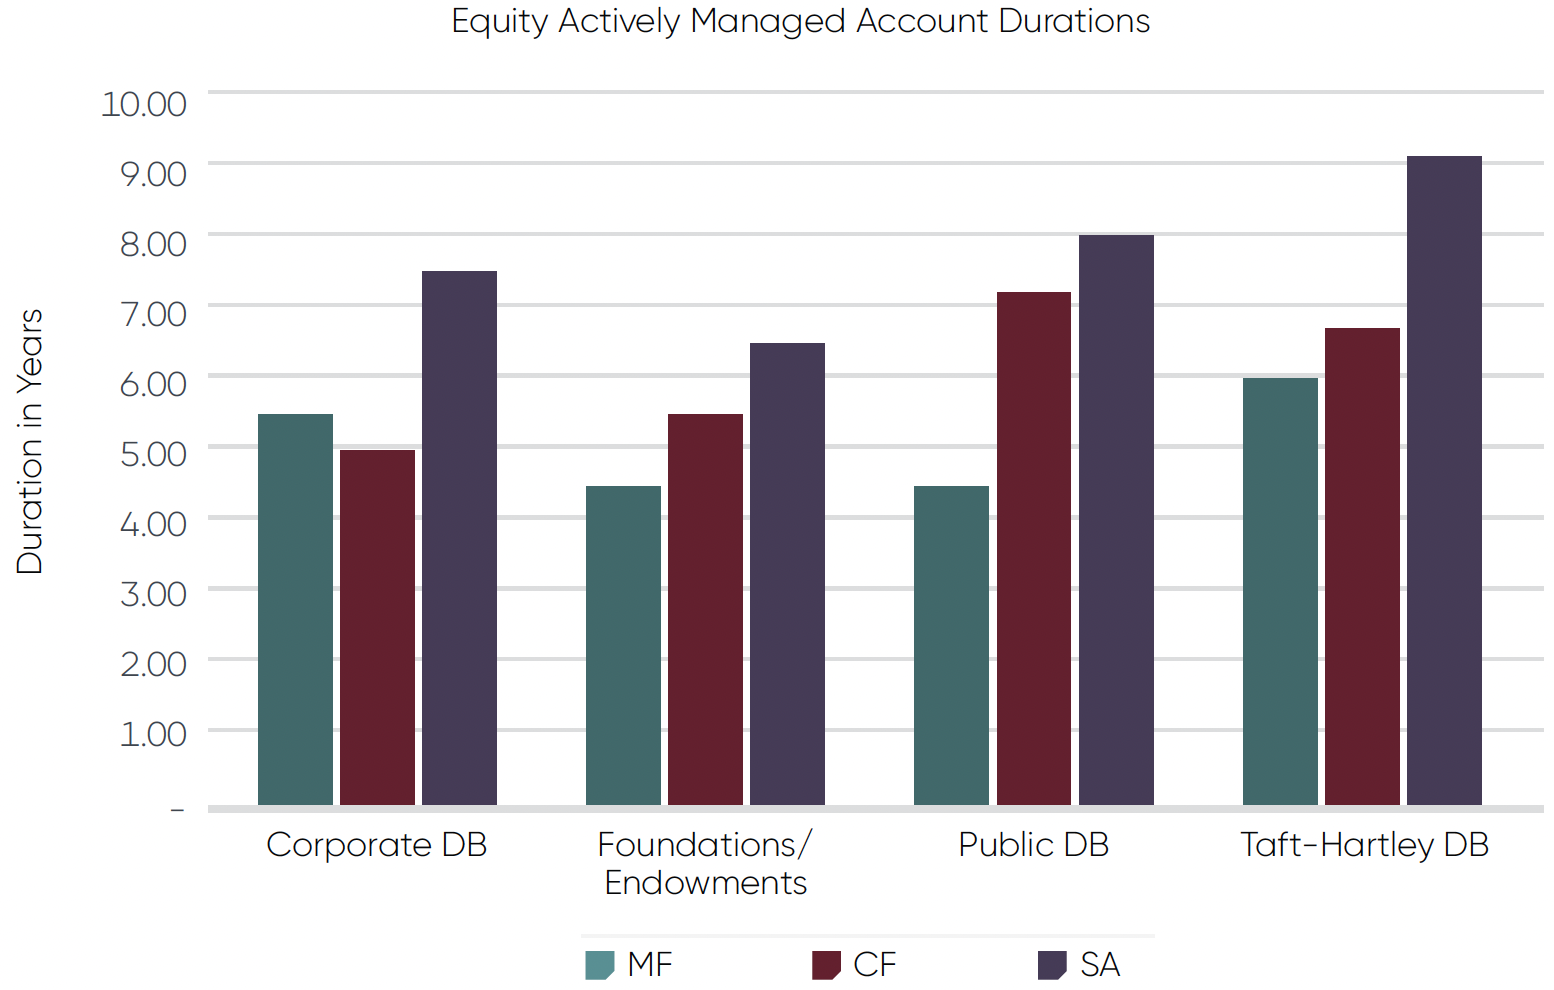
Equity Actively Managed Durations in Years by Client Type
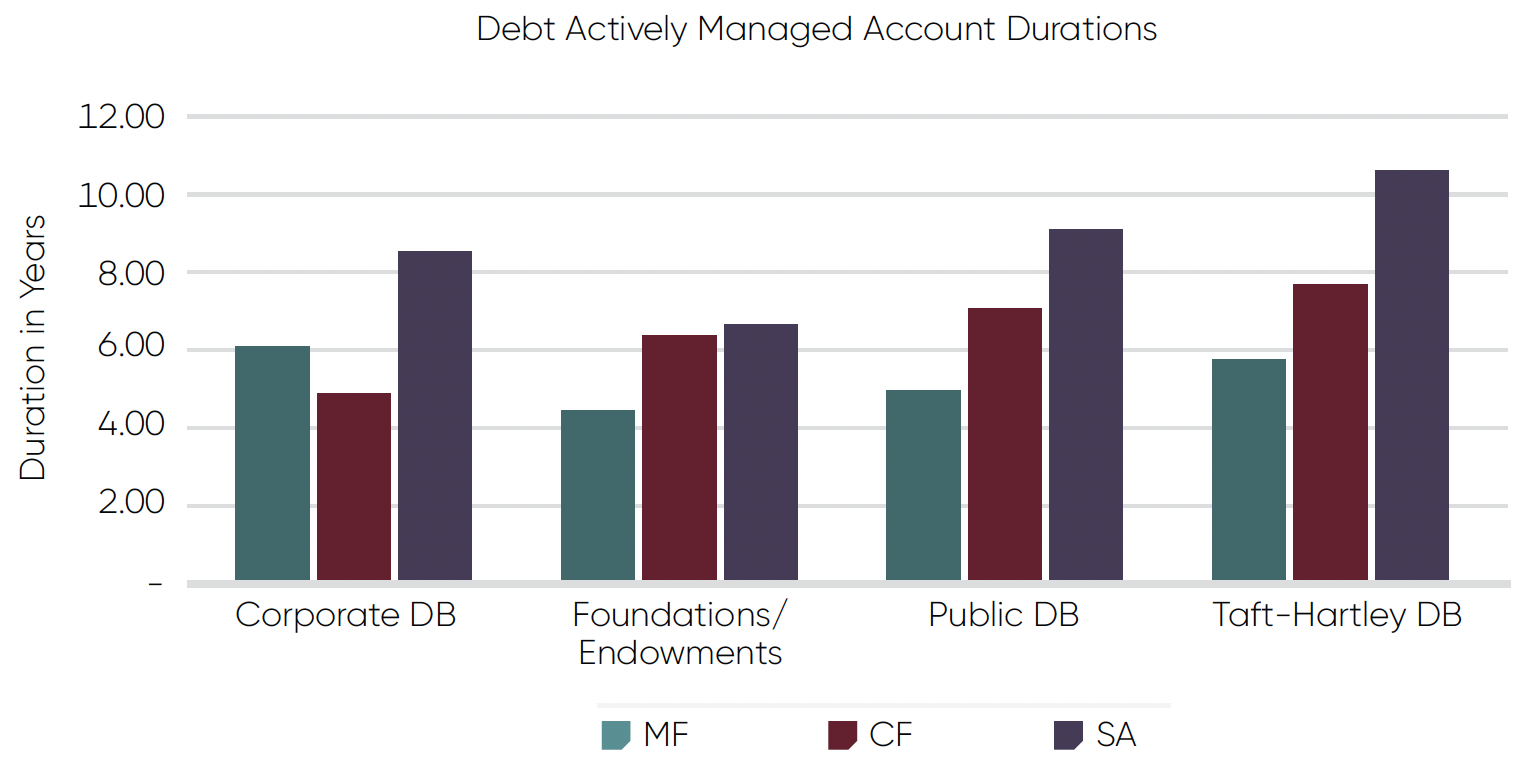
Debt Actively Managed Durations in Years by Client Type
Value
The Confluence analysis tool also determined that management fees by asset class, vehicle and plan type can also vary similarly to durations. Management fees typically move in the opposite direction from asset class stickiness. The ‘Fees in BPS of Existing Account’ chart below shows that mutual funds are the most expensive on both the debt and equity sides. Comingled funds are in the middle and separate accounts are typically the least expensive. The trends in fees are also pretty conclusive across debt and equity. Actively managed equity is priced nearly double actively managed debt.
The trends of fee BPS by client type are much less pronounced. This may be more of a function of other factors than just client type. A deeper analysis of more than simply equity vs debt is needed. This report assumes that every plan type pays the same for mutual funds.
Mutual funds are more likely to be included in smaller plans. When the same smaller plans opt for separate accounts, they usually pay higher fees for those separate accounts. Smaller mandates often result in larger fee BPS relative to peers. The average tracked corporate DB plan in the report is $690M, public DB plans are $1B, Foundations & Endowments plans are $127M and Taft-Hartley DB plans are $319M.
Actively managed equity is priced nearly double actively managed debt.

Fees in BPS of Accounts existing Dec-2022
Assets by Vehicle Distribution
The assets are not evenly distributed by vehicle or by client type. Certain types of clients invest in vehicles differently. Foundations & Endowments are much more likely to employ the higher priced mutual funds. Corporate DB and public DB are virtual mirror images of each other in terms of dispersion of AUM by asset class. Taft-Hartley DB is similar to corporate and public DB for equity vehicle selection but closer to foundations & endowments for debt vehicle selection.

Percentage of Account AUM by Client and Asset Class Dec-2022
Taft-Hartley DB debt is the key spot for maximizing longer term consistent growth. Accounts in this space are the stickiest, especially on the debt side. Commingled funds are a great way to grow in the public DB space. However, the corporate DB space shows that commingled funds are not nearly as strong and consistent revenue generating.
Taft-Hartley DB debt is the key spot for maximizing longer term consistent growth.
Client Lifetime Value
Mixing the durations and fees gives us a unique picture of client lifetime value. Using the Confluence analysis tool to examine vehicles and account longevities, allows asset managers and Investment Consultants to determine:
- Where they need to have a vehicle available to meet market demand.
- What opportunities they can focus on to maximize client lifetime revenue.

Lifetime Account Value in 000’s
All client lifetime values are assumed to be for a $10M mandate. The number is in thousands of dollars and is the total value of the mandate over the typical duration that the asset manager has the account. The lifetime values consider the median fees for the vehicle, the asset class and the client type.
Taft-Hartley DB debt is the key spot for maximizing longer term consistent growth. Accounts in this space are the stickiest, especially on the debt side. Commingled funds are a great way to grow in the public DB space. Commingled funds do not provide nearly as strong or consistent revenue generation in the corporate DB space.
Conclusions
Predicting revenue and cash flow for asset managers is challenging. Part of the challenge is that the longevity and revenue is partly driven by factors completely out of asset managers’ control. This report is just one example of the types of insights we can provide with the soon-to-be-launched Confluence analysis tool. This report sheds light on the typical durations and fees of the institutional asset management industry so that asset managers can better quantify opportunities and accurately value the client lifetime revenue and value of accounts.
- Taft-Hartley DB accounts should be prized as they typically represent the stickiest accounts with the longest duration cash flow with a resultant highest lifetime value.
- Foundations & Endowments skew more toward mutual funds for equity and especially debt.
- These mutual funds typically pay higher fees, but the lifetime value does not offset commingled funds for Foundations & Endowments.
- Commingled funds represent the lowest revenue opportunity of the vehicles examined for corporate DB plans.
Asset managers need a million factors to be favorable for mandate longevity. This report and other insights from Confluence can help managers gain early insights to stay ahead of the curve.
Data & Methodology
Combining account duration with actual post-negotiated fees shows unique opportunities for institutional asset managers. The durations were of accounts that closed from 2010-2022 on Investment Metrics’ PARis platform. All durations are in years. The account needed to be closed so that we could measure the full duration from first funding to termination. We measured those account durations by plan sponsor type, by asset class and by invested vehicle type. Fees were examined based on actual post-negotiated fees, not listed fees, and by vehicle. It was assumed that all plan sponsor types received the same mutual fund fees. All accounts were actively managed. Passive accounts were excluded entirely as passive fees and passive account durations can significantly skew the results. Passive accounts have significantly lower fees than active accounts. Passive mutual funds may also be used as a temporary holding account to give the plan market exposure when the account is between managers skewing the durations. Client lifetime value was modeled on a $10M account from the first day the account was funded to when it was terminated.
Disclaimer
The material presented in this document is an assessment of the market environment as of the date indicated; is subject to change; and is not intended to be a forecast of future events or a guarantee of future results. This information should not be relied upon by the reader as research or investment advice regarding any funds or any issuer or security or similar.
This document contains general information only, does not consider an individual’s financial circumstances and should not be relied upon for an investment decision.
Confluence does not provide investment advice and nothing in this document should be considered any form of advice. Confluence accepts no liability whatsoever for any information provided or inferred in this document.
About Confluence
Confluence is a leading global technology solutions provider committed to helping the investment management industry solve complex data challenges across the front, middle and back offices. From data-driven portfolio analytics to compliance and regulatory solutions, including investment insights and research, Confluence invests in the latest technology to meet the evolving needs of asset managers, asset owners, asset servicers, and asset allocators to provide best-of-breed solutions that deliver maximum scalability, speed and flexibility, while reducing risk and increasing efficiency. Headquartered in Pittsburgh, PA, with 750+ employees in 15 offices spanning across the United Kingdom, Europe, North America, South Africa, and Australia, Confluence services over 1000 clients in more than 40 countries. For more information, visit www.confluence.com.
