Any discussion on risk-adjusted performance measures must start with the grandfather of all risk measures the Sharpe Ratio or Reward to Variability which divides the excess return of a portfolio in excess of the risk free rate by its standard deviation or variability.
Most risk measures are best described graphically, a measure of return in the vertical axis and a measure of risk in the horizontal axis as shown below.
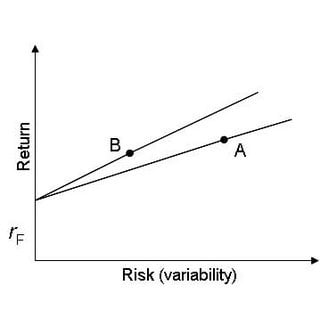 Ideally if investors are risk averse they should be looking for high return and low variability of return, in other words in the top left-hand quadrant of the graph. The Sharpe ratio simply measures the gradient of the line from the risk free rate (the natural starting point for any investor) to the combined return and risk of each portfolio, the steeper the gradient, the higher the Sharpe ratio the better the combined performance of risk and return.
Funds are ranked in order of preference with the Sharpe ratio but it is difficult to judge the extent of relative performance. M2; first proposed by Leah Modigliani and her grandfather Professor Franco Modigliani (1997) offers an alternative risk-adjusted return using the Sharpe ratio of the portfolio but calculated at the risk of the benchmark thus allowing direct comparison.
Investment statistics can either be grouped as Sharpe type combining risk and return in a ratio, risk adjusted returns such as M2 or descriptive statistics which are neither good nor bad but provide information about the pattern of returns of the portfolio manager. The first moment of a return series is the mean, the second moment is the variance, the third moment is skewness and the fourth moment kurtosis. Kurtosis measures the weight of returns in the tails or the peakedness of a return distribution. Investors should prefer high average returns, lower variance or standard deviation, positive skewness and lower kurtosis. The adjusted Sharpe ratio suggested by Pezier (2006) explicitly rewards positive skewness and low kurtosis (below 3, the kurtosis of a normal distribution) in its calculation and thus potentially removes one of the possible criticisms of the Sharpe ratio.
The regression statistics b (or systematic risk), r (correlation) and R2 are descriptive statistics. Jensen’s alpha is often misquoted as the portfolio manager’s excess return above the benchmark, more accurately it the excess return adjusted for systematic risk.
Treynor ratio or Reward to Volatility is similar to Sharpe ratio, the numerator (or vertical axis graphically speaking) is identical but in the denominator (horizontal axis) instead of total risk we have systematic risk or volatility as calculated by beta. Although well known the Treynor ratio is less useful precisely because it ignores specific risk.
The appraisal ratio first suggested by Treynor & Black (1973) is similar in concept to the Sharpe ratio but using Jensen’s alpha, excess return adjusted for systematic risk in the numerator, divided by specific risk not total risk in the denominator.This measures the systematic risk adjusted reward for each unit of specific risk taken.
In the same way that absolute return and absolute risk are combined in Sharpe ratio excess return and tracking error (the standard deviation of excess return) are combined in the information ratio, although given the need of an appropriate benchmark less useful for hedge funds.
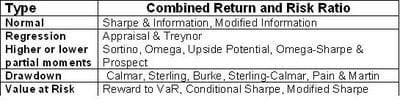
The Sharpe, appraisal, Treynor and information ratios are familiar measures used by the industry for decades. More recently hedge funds have encouraged the use of further risk measures designed to accommodate the risk concerns of different types of investors. These measures can be categorised as based on normal measures of risk, regression, higher or lower partial moments, drawdown or value at risk (VaR).
Predominately hedge fund management styles are designed to be asymmetric in their return patterns. If successful this leads to variability of returns on the upside but not on the downside. Investors are less concerned with variability on the upside but of course are extremely concerned about variability on the downside. This leads to an extended family of risk-adjusted measures reflecting the downside risk tolerances of investors seeking absolute not relative returns.
Standard deviation and the symmetrical normal distribution are the foundations of Modern Portfolio Theory. Post-modern Portfolio Theory recognises that investors prefer upside risk rather than downside risk and utilises semi-standard deviation.
Downside risk measures the variability of underperformance below a minimum target rate. The minimum target rate could be the risk free rate, the benchmark or any other fixed threshold required by the client. All positive returns are included as zero in the calculation of downside risk or semi-standard deviation.Downside potential is simply the average of returns below target, upside potential the average of returns above target.
In their article “A Universal Performance Measure” (2002) Shadwick & Keating suggest a gain-loss ratio, Omega (W) that captures the information in the higher moments of a return distribution implicitly adjusting for both skewness and kurtosis; dividing upside potential by downside potential.
A natural extension of the Sharpe and Omega is suggested by Sortino (1991) which uses downside risk in the denominator. Total risk has simply been replaced by downside risk, portfolio managers will not be penalised for upside variability but will be penalised for variability below the minimum target return.
The upside potential ratio suggested by Sortino, Van de Meer & Platinga (1999) can also be used to rank portfolio performance and combines upside potential with downside risk. Even “Prospect Theory” the fact that investors dislike losses far greater than they like gains can be built into a Sharpe like measure in the form of the Prospect ratio.
If value at risk is your preferred measure of risk then, of course, there is a Sharpe type measure that replaces standard deviation with VaR in the denominator; called reward to VaR. VaR does not provide any information about the shape of the tail or the expected size of loss beyond the confidence level. In this sense it is a very unsatisfactory risk measure; of more interest is conditional VaR otherwise know as expected shortfall, mean expected loss, tail VaR or tail loss which takes into account the shape of the tail. Historical simulation methods which make no assumptions of normality are particularly suitable for calculating conditional VaR. The conditional Sharpe ratio replaces VaR with conditional VaR.
Perhaps the simplest measure of risk in a return series from an absolute return investor’s perspective, wishing to avoid losses, is any continuous losing return period or drawdown. The average drawdown is the average continuous negative return over an investment period, three years being a typical period of measurement for comparison purposes.
The maximum drawdown not to be confused with the largest individual drawdown is the maximum potential loss over a specific time period, typically three years. Maximum drawdown represents the maximum loss an investor can suffer in the fund buying at the highest point and selling at lowest.The Calmar ratio is a Sharpe type measure that uses maximum drawdown rather than standard deviation to reflect the investor’s risk. In the context of hedge fund performance it is easy to understand why investor’s might prefer the maximum possible loss from peak to valley as an appropriate measure of risk.
The Sterling ratio replaces the maximum drawdown in the Calmar ratio with the average largest drawdowns.
Similar measures including the Pain ratio and the Ulcer Performance ratio incorporate the duration and depth of drawdowns since the previous high water mark. The range of combined risk and return measures available for hedge fund investors is almost limitless.
With so many similar ratios the natural question to ask is “which is the best measure to use?” In fact Eling & Schuhmacher (2006) have published an article “Does the Choice of Performance Measure Influence the Evaluation of Hedge Funds” which concludes that most of these measures are all highly correlated and do not lead to significantly different rankings. Both the question and their article to some degree miss the point, risk like beauty is in the eye of the beholder, the investor most decide ex-ante which measures of return and risk best reflect their preferences and choose the combined ratio which reflects those preferences. One, and only one, of the above ratios are most likely to reflect the preferences of the investor. Care should also be taken to ensure hedge funds are not hiding volatility by using smoothed valuations. Consistent valuation criteria must by applied each month, although Global Investment Performance Standards (GIPS) do not require that specific risk measures are used they do require documented policies and procedures for valuations consistently applied and are therefore valuable and a source of comfort for any potential investor.
{{cta(‘8980c915-99fe-48c6-923a-b11ef9628047’)}}
Disclaimer: The information contained in this communication is for informational purposes only. Confluence/StatPro is not providing, legal, financial, accounting, compliance or other similar services or advice through this communication. Recipients of this communication are responsible for understanding the regulatory and legal requirements applicable to their business.