The days of single digit VIX are over
 The week of February 5th 2018 definitively answered the question of when volatility would return to global markets. Most market observers had the intuition, correctly, that the return of volatility would coincide with a fall in equity markets. However, beyond that it’s worth reminding ourselves exactly what VIX measures and what relationships VIX may have with global asset classes going forward.
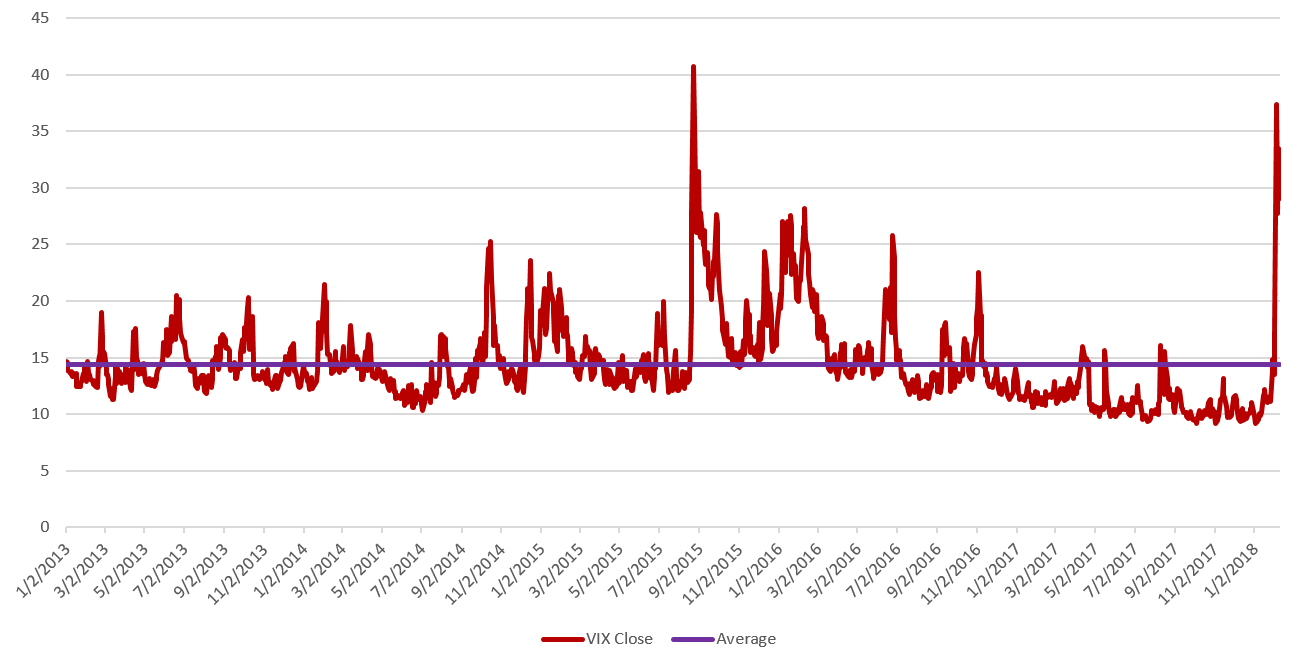
On January 11th 2018 when we published the first piece in our Global Risk Outlook series, titled Measuring the impact when market volatility returns, the VIX was hovering around 10, closing at 9.88 that day. The VIX ended the week of February 5th at 29, after seeing levels as high as 50 intraday during the week.
Volatility itself is a quantity which is not directly observable, though there are many ways to make good estimates of its current level. In the risk world we have devised methods to measure volatility with processes using historic returns and varying return weighting schemes. Measuring volatility like this is an ex-post exercise and is a measure (or estimate) of realized volatility.
To predict future, or ex-ante, levels of volatility we can look to option markets where the prices paid for options imply a future level of volatility at the horizon of the option maturity. This is called implied volatility and is precisely what the VIX measures with respect to near-term options on the S&P 500 index.
To get a feel for a VIX level of 10 we can use the same methods we use for Value at Risk. A VIX level of 10 means 10% annualized implied volatility, or 0.63% standard deviation, and a 95% two-tailed confidence level of +/- 1.23%. This implies the S&P 500 will have five days out of each 100 with returns greater than +/- 1.23% . The long-run average of the S&P 500 volatility is ~15%, or five days out of each 100 with returns greater than +/- 1.85%.
Option market estimates of implied volatility can differ from eventual realized volatility levels, especially as market regimes shift, and long-held short volatility trades need to be covered. This is the likely explanation for the sharp VIX spike to 50 observed on February 5th, which would otherwise indicate five days out of each 100 with S&P returns greater than +/- 6.17%.
Fig. 1: VIX price vs historical average, 2013 – February 9, 2018
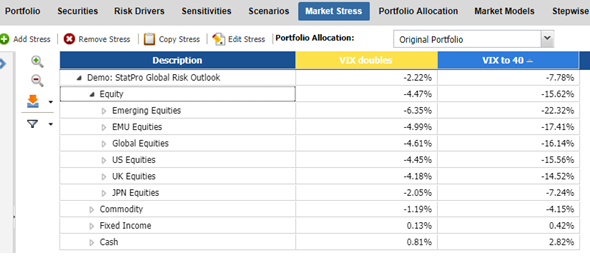
Recall from the previous Global Risk Outlook article, we ran two forward-looking stresses simulating the VIX. One for a VIX doubling from current levels, our moderate case, and one for the VIX going to 40, our stressed markets case.
Fig. 2: Market Stress results from “Measuring the impact when market volatility returns”, January 11, 2018 (Source: StatPro)
The realized returns for February 1st to close on the 8th (VIX 33):
Fig. 3: Actual returns for Global Risk Outlook portfolio (Source: StatPro)
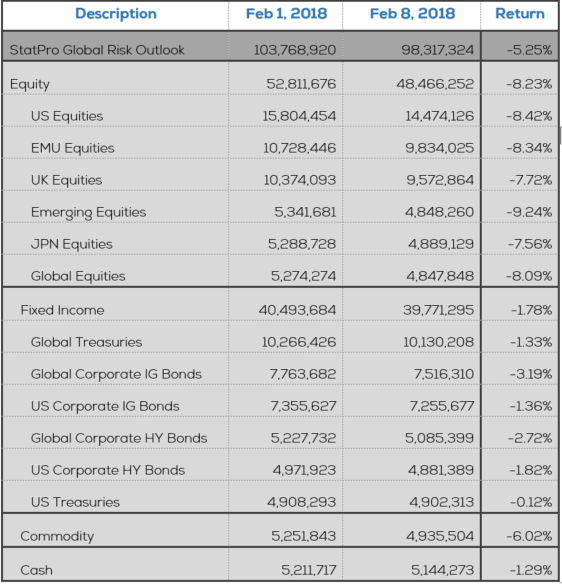
The portfolio return for the period ending February 8th was -5.25%, a level between our moderate and stressed markets predictions. More interesting however are the changing asset class relationships reflected in the returns:
- Emerging market equities were predicted to sell off the most, but instead have only sold off on par with global developed equities.
- US Treasuries were down marginally over the period, thus contributing to losses rather than serving as a hedge. This sharp rally in treasury yields preceding the market turmoil is perhaps the leading candidate for the root cause of the volatility.
- US corporate HY bonds were down marginally at 1.82%, indicating the long-credit environment, from the low volatility regime, remained somewhat resilient in the US.
- Commodities sold off sharply and were not a safe haven in this environment.
We can quantify these changing relationships by looking at the correlation structure between the VIX and portfolio asset classes.
Fig. 4: Changes in correlations to VIX (Source: StatPro)
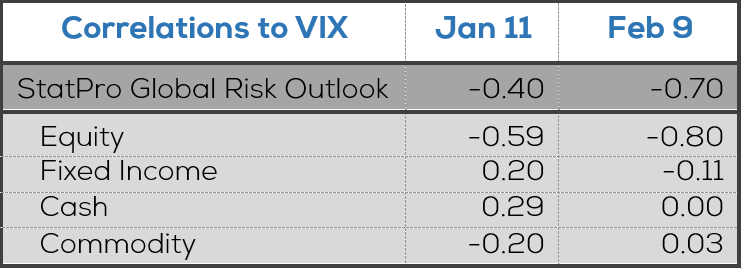
In mid-January the correlation between VIX and our diversified fixed income portfolio was positive, meaning that if the VIX price increased (more equity volatility) then the prices of fixed income would offset equity losses. However, the updated 100-day look-back shows correlations have become negative for fixed income and near zero for cash and commodities.
The impact of this volatility resurgence is yet to be determined. February 6th 2018 saw the short volatility trade and equity bull gain back a significant share of the losses, and most market insiders see the past few business days as healthy volatility instead of a panicked correction. However, losses to the Global Risk Outlook portfolio over the period demonstrate the importance of monitoring portfolio stresses, scenarios, betas, and correlations along with performance to ensure that your portfolio risk framework reflects market realities in changing regimes.
{{cta(‘f543e487-b4d2-495c-a07a-cfa4a233f17e’)}}