Trade tensions as a result of the tariffs between the US and China, political and economic instability with Russia, and the underperforming Brazilian economy require us to assess potential risk exposures we have to these countries.
 According to the United Nations Conference on Trade and Development, which publishes a World Investment Report yearly, four of the top five countries by foreign direct investment (FDI) are defined as developing or transitional economies. First on the list, the United States, is developed, followed by China, Hong Kong, Brazil, and Singapore which are developing. Other developing economies making the top 20 are India, Mexico, Russia, Indonesia, and South Korea. It is interesting to note that although these are popular investment regions, these countries are not always the safest or easiest economies to do business in. The World Bank publishes the Doing Business report which ranks the world’s economies on 10 sub-indices ranging from investor protection to tax rates to the electric grid, and Brazil, Russia, and China do not even crack the top 30. Russia is the ‘easiest’ of the three, coming in at 35, while China and Brazil fall out of the top 50 at 78 and 125, respectively.
Case
Our Global Risk Outlook portfolio has direct exposures through the Emerging Equities and Global High Yield books, but what are the true all-in exposures to Brazil, Russia and China and are there unintended exposures we are not aware of? How exposed are we to market downturns in Brazil, Russia and China?
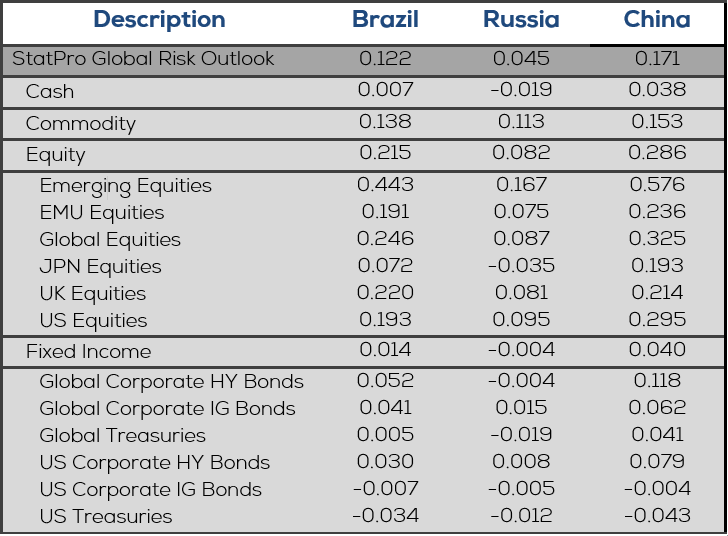
StatPro Revolution’s Alpha module is able to answer this using the user-friendly Market Model suite, which we will use to diagnose portfolio betas to the three countries and then run correlated market stresses using these betas. Alpha uses a unique and interpretable method of regressing tradable market indices against each level of your portfolio. These can be used to verify a fund’s investment objective or to uncover hidden risk factors. We can perform a country risk exposure analysis by adding a country index representing each of China, Russia and Brazil to our model. The resulting betas are below:

Fig. 1: Single Factor Betas to Brazil, Russia and Chinese Indices
We see that Brazil and China have meaningful betas of 0.122 and 0.171 to the overall portfolio as well as the commodities, equities and emerging equities books; while the overall exposure to Russia is minimal. If you compare the average betas to each sub portfolio, the Brazilian Index betas are three times larger than Russia’s while China’s are nearly 5.5 times larger on average. Now that we know our sensitivity to the three country indices, we need to compare them to a baseline exposure. In lieu of a position level look-through we will use country breakdown of a commonly used Emerging Market ETF.

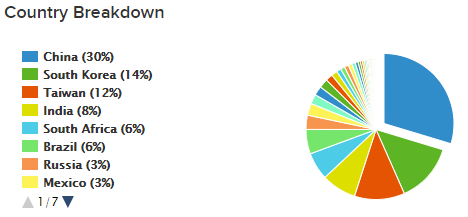
Fig. 2: By country breakdown of leading Emerging Market ETF
If you were to buy this ETF for exposure to Emerging Markets, China would contribute 30% of the exposure, while Russia and Brazil come in at 6% and 3%, respectively. Of course the market value is not a 1:1 comparison to betas, it is enough for us to raise some flags. You can see that the ETF has much lower exposure to Brazil as compared to China, but our portfolio has Betas near the same level for Brazil and China. This is likely due to the ETF manager balancing country exposures based on factors such as overall size of each country’s market cap (Shanghai Stock Exchange [SSE] $5.5 trillion, B3 $1 trillion, and Moscow Exchange [MOEX] $635 billion). So what happens if one of these markets experiences a 5% crash?

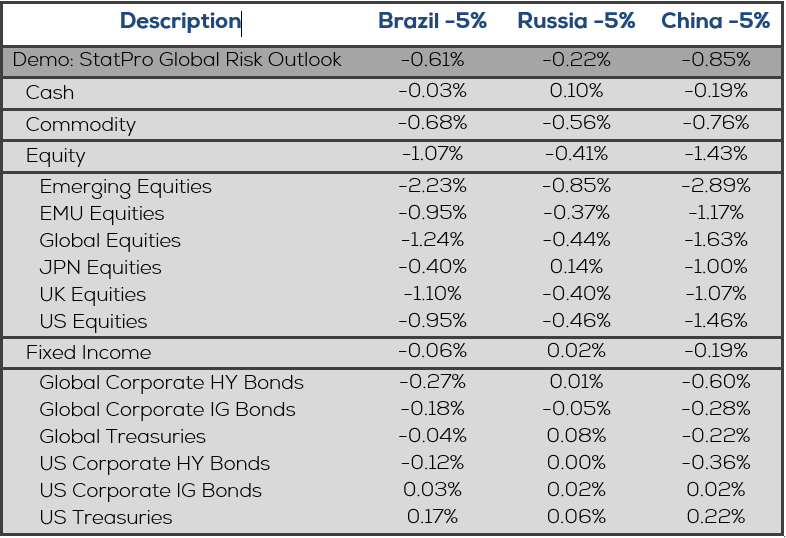
Fig. 3: Correlated returns to Brazil, Russia and Chinese Indices down 5%
The portfolio as a whole is fairly insulated to the moves of the markets in each country. Again we see Brazil and China showing similar returns in this scenario, specifically some significant moves in the Emerging Markets portfolio which is expected.
Conclusion
We see that our exposure to Brazil may be high relative to China as compared to a standard Emerging Market ETFs, and this shows that our portfolio construction is more heavily weighted with growth potential in Brazil rather than weighting exposures based on market cap by country. Often investment managers chase returns, or popular trades, without building a proactive risk framework around the portfolio. This country risk example, similar to the short volatility trade we have written about previously, shows how Asset Managers can use StatPro Revolution Alpha’s risk tools combined with custom reporting to track betas, correlations, exposures and stress results over time to understand the all-in impact of market stresses to a portfolio.
{{cta(‘f543e487-b4d2-495c-a07a-cfa4a233f17e’)}}