For many years, investment management professionals have discussed risk and performance as being ‘two sides of the same coin’ and the convergence of the two functions within asset managers. Risk is managed in order to achieve performance. Indeed, in many firms, risk and performance professionals now work in the same team and we see both aspects considered together in the analysis of portfolios. There are many benefits in combining the analysis, for example:
- Much of the data required is broadly similar
- Efficiencies and savings in data management may be possible – for example look-through and portfolio aggregation can apply to both
- There are also efficiencies and savings to be gained in adopting systems that cater for both
- It’s logical to apply consistency in the methodologies applied
- The classification breakdown and analysis of risk and performance should be consistent
- It may help to bring the full portfolio analysis function more into the front office and therefore align more closely to the decision making process
Challenges
 But let’s not underestimate the challenges. Whilst the data required is similar, the scope and accuracy required may differ. Risk is like a slightly blurry snapshot whilst performance is more like an ultra-HD movie, where concise and accurate historical data is necessary for the entire measurement period (for both portfolios and benchmarks). In contrast, when it comes to risk it may be possible to omit certain data points, make approximations or use proxies. Asset coverage is also critical in terms of risk – but not needed for most performance purposes – with one potential notable exception, which will be discussed.
Risk is complex, but performance is complicated – therefore whilst there is some overlap, the skill sets required for both can be somewhat different. Historically, the systems involved for the two areas have been very different indeed – it is only relatively recently, and particularly with the advent of cloud-based technology, that it has been possible to find an effective solution for both risk and performance from the same system platform. Consequently, the reporting and visualization of performance and risk analysis in a consistent and unified approach has hitherto rarely been available.
Where they come together
However, there is one area in particular where the two disciplines are inextricably linked and can come together most effectively, and this is fixed income attribution.
Why is fixed Income attribution critical for a fixed income manager?
Most importantly, it enables the results of the specific investment process – the returns and outperformance – to be understood and explained. It demonstrates to clients and investment consultants that there is a clear commitment to controls and processes, and it provides feedback into the decision making process within the front office. Fixed income investment intrinsically uses risk data in order to allocate assets. For example, the positioning of a portfolio relative to the yield curve and the benchmark is achieved using duration, in addition to market value weighting. Positioning relative to the anticipated spread changes in the market and benchmark requires spread duration positioning. Taking these kinds of systematic risk exposure decisions is fundamental to fixed income investment.
The calculation of attribution
Fixed income attribution requires inputs from both the performance and the risk worlds. For the calculation of attribution using a duration-based model, the calculation of the underlying return components actually uses the risk numbers such as modified duration, option-adjusted duration, spread duration, and convexity as well as the changes in the market, such as yield curve changes and movement, spread changes, etc.
For example, the basic formula for calculating yield curve return for a security is as follows:
Yield Curve Return = -Modified Duration Start * Yield to Maturity Change
[In reality, the option-adjusted duration may be used, together with the fitted yield curve change for the security]
The basic formula for calculating Spread return is essentially similar, i.e.
Spread Return = -Spread Modified Duration Start * Spread Change
Single platform
In order to calculate these types of returns, risk numbers are required and particularly for off-benchmark securities, this requires asset coverage at some point in the process (as alluded to earlier). It makes sense for these to be sourced from the same platform and for the risk numbers used in the attribution calculation to be the same as those that are used within the investment and risk management processes.
In further calculating the contributions, and then attribution – we bring in results of the performance process, including the weights. There are of course many more detailed sub-effects that are calculated at lower levels and the whole process may be quite complicated and very data intensive – particularly as many fixed income benchmarks consist of tens of thousands of constituents!
Equally importantly, since risk numbers have been used within both the investment and risk management processes, it is important to also include these in the reporting of the FIA results. Here the advantages of supporting both risk and performance within a single platform becomes even more apparent – since the consistency of data including risk numbers, coding systems and classifications can be ensured. Being able to combine risk and performance within interactive and configurable dashboards becomes a very valuable tool indeed.
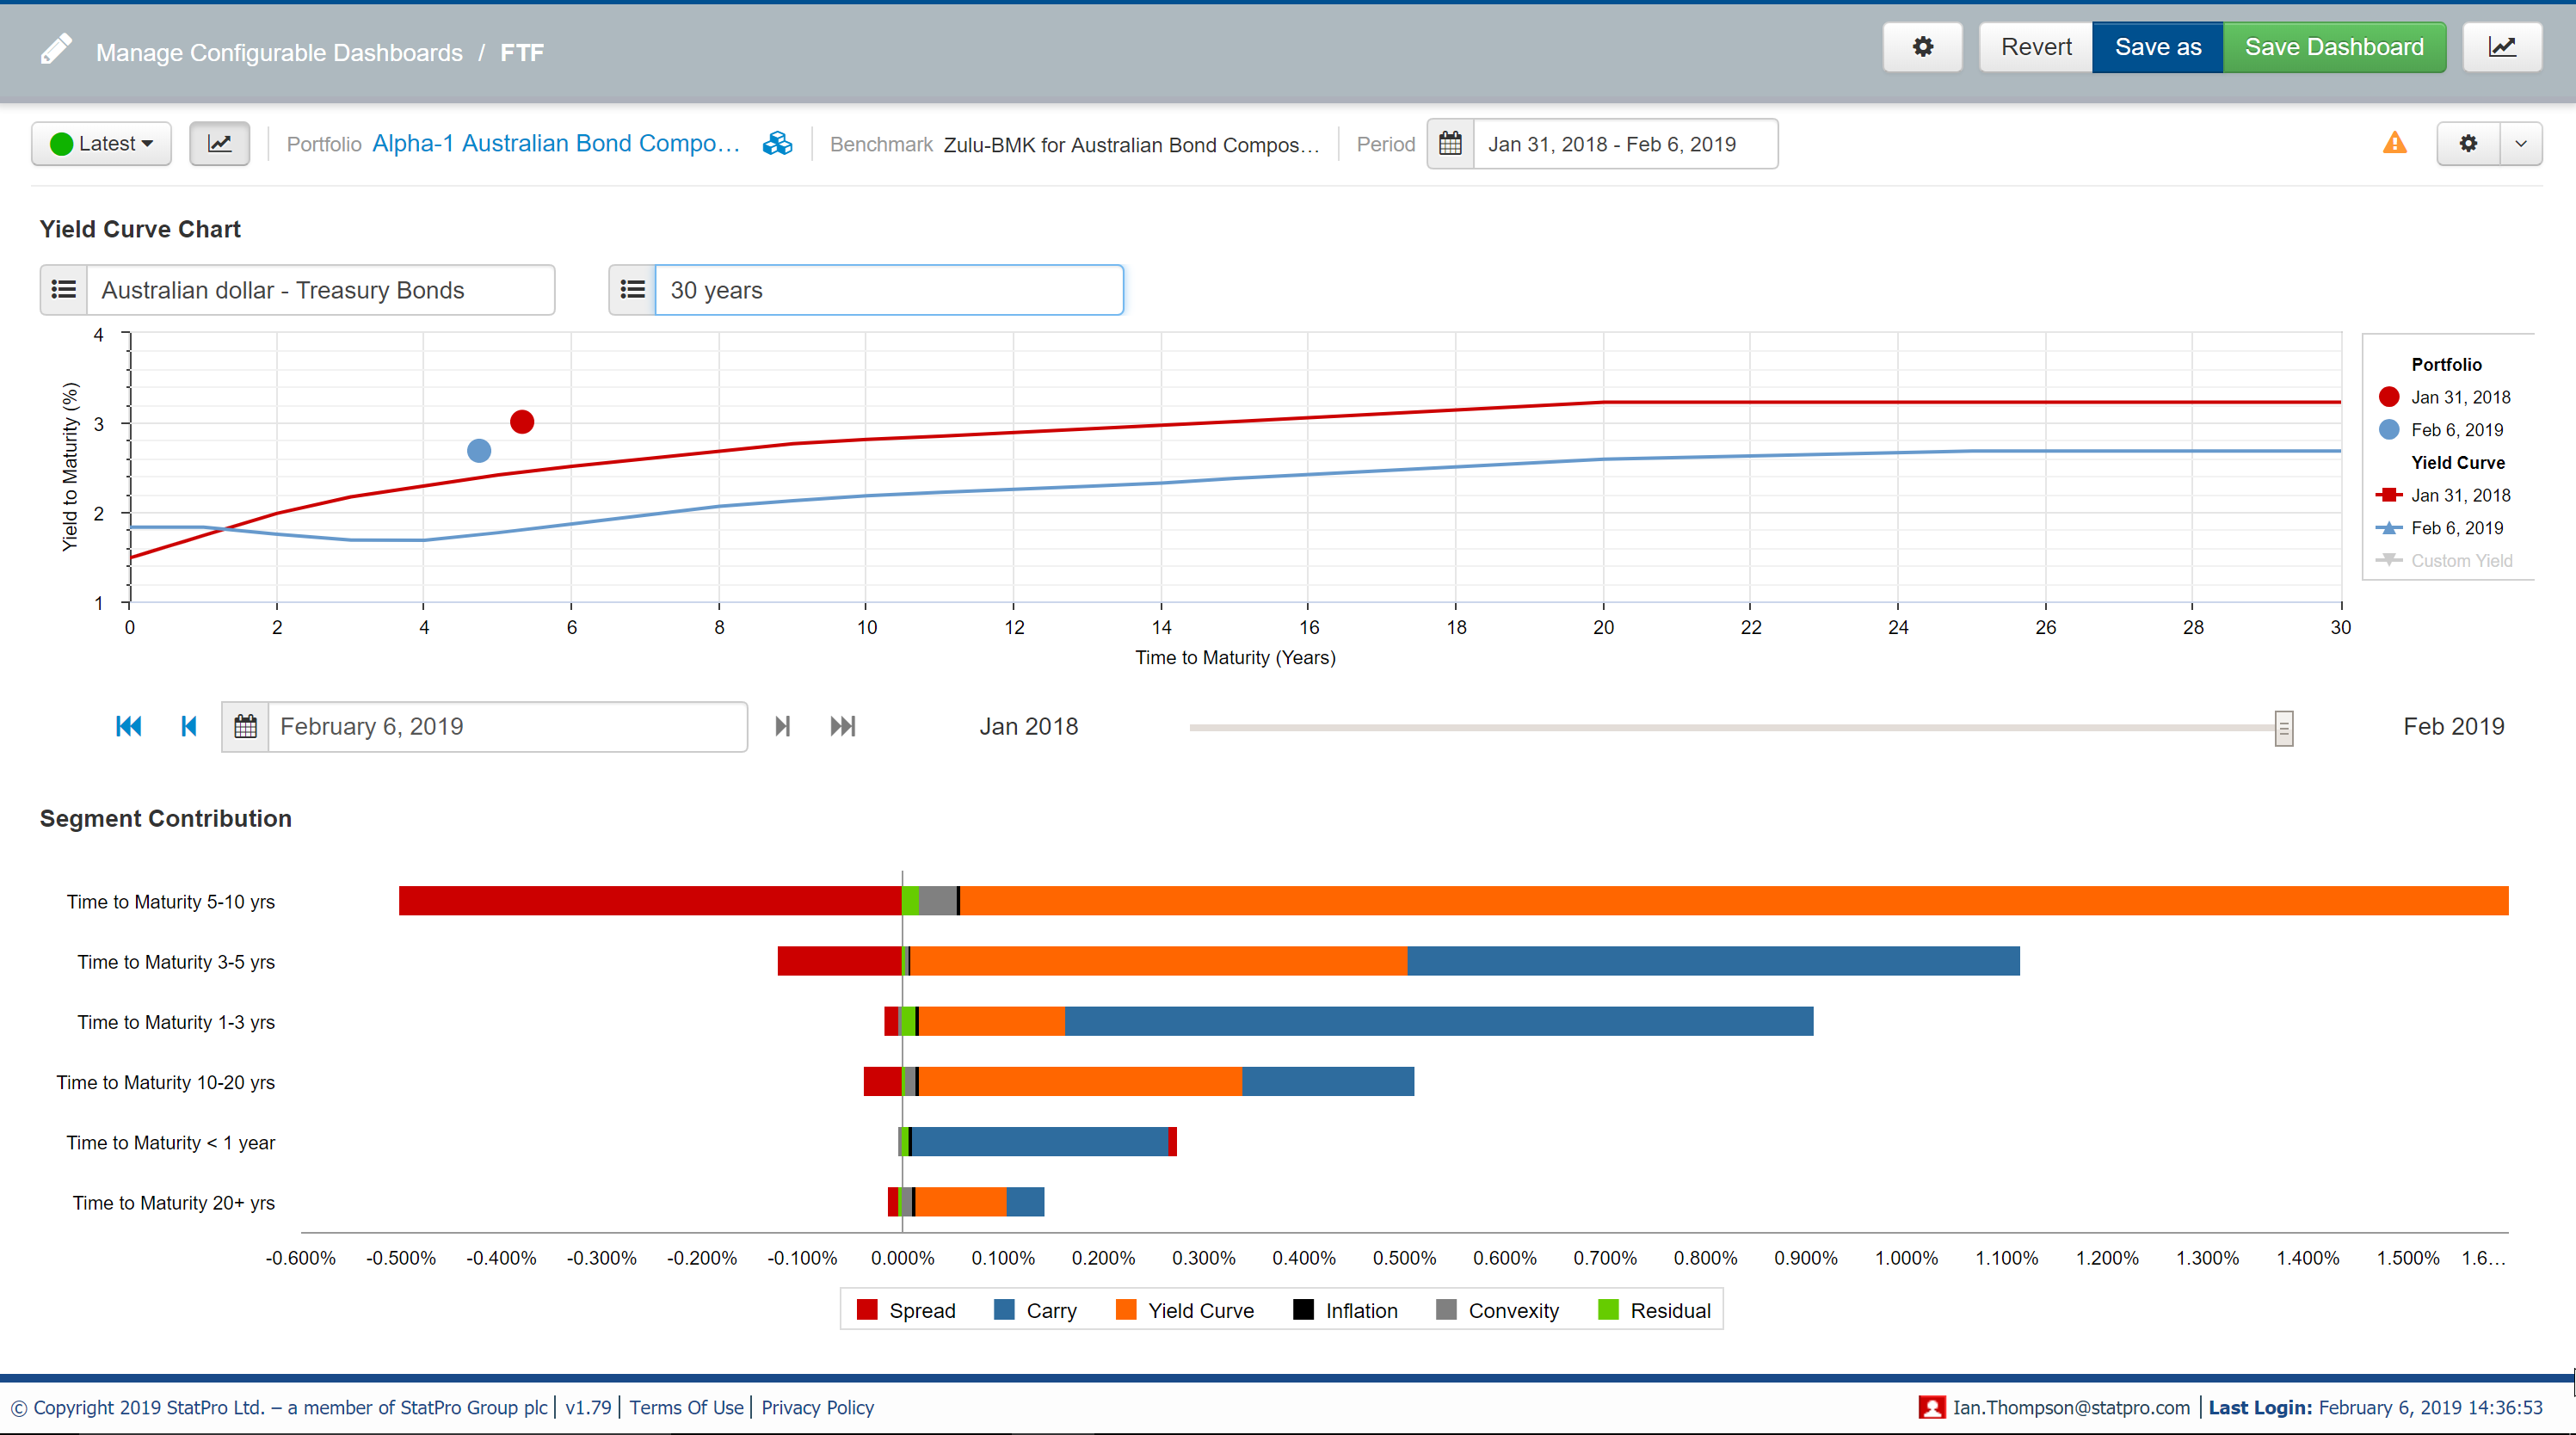
The following example shows how falling yields in the Australian Bond market over the past year have driven positive yield curve returns and hence contributions within an Australian fixed income portfolio:
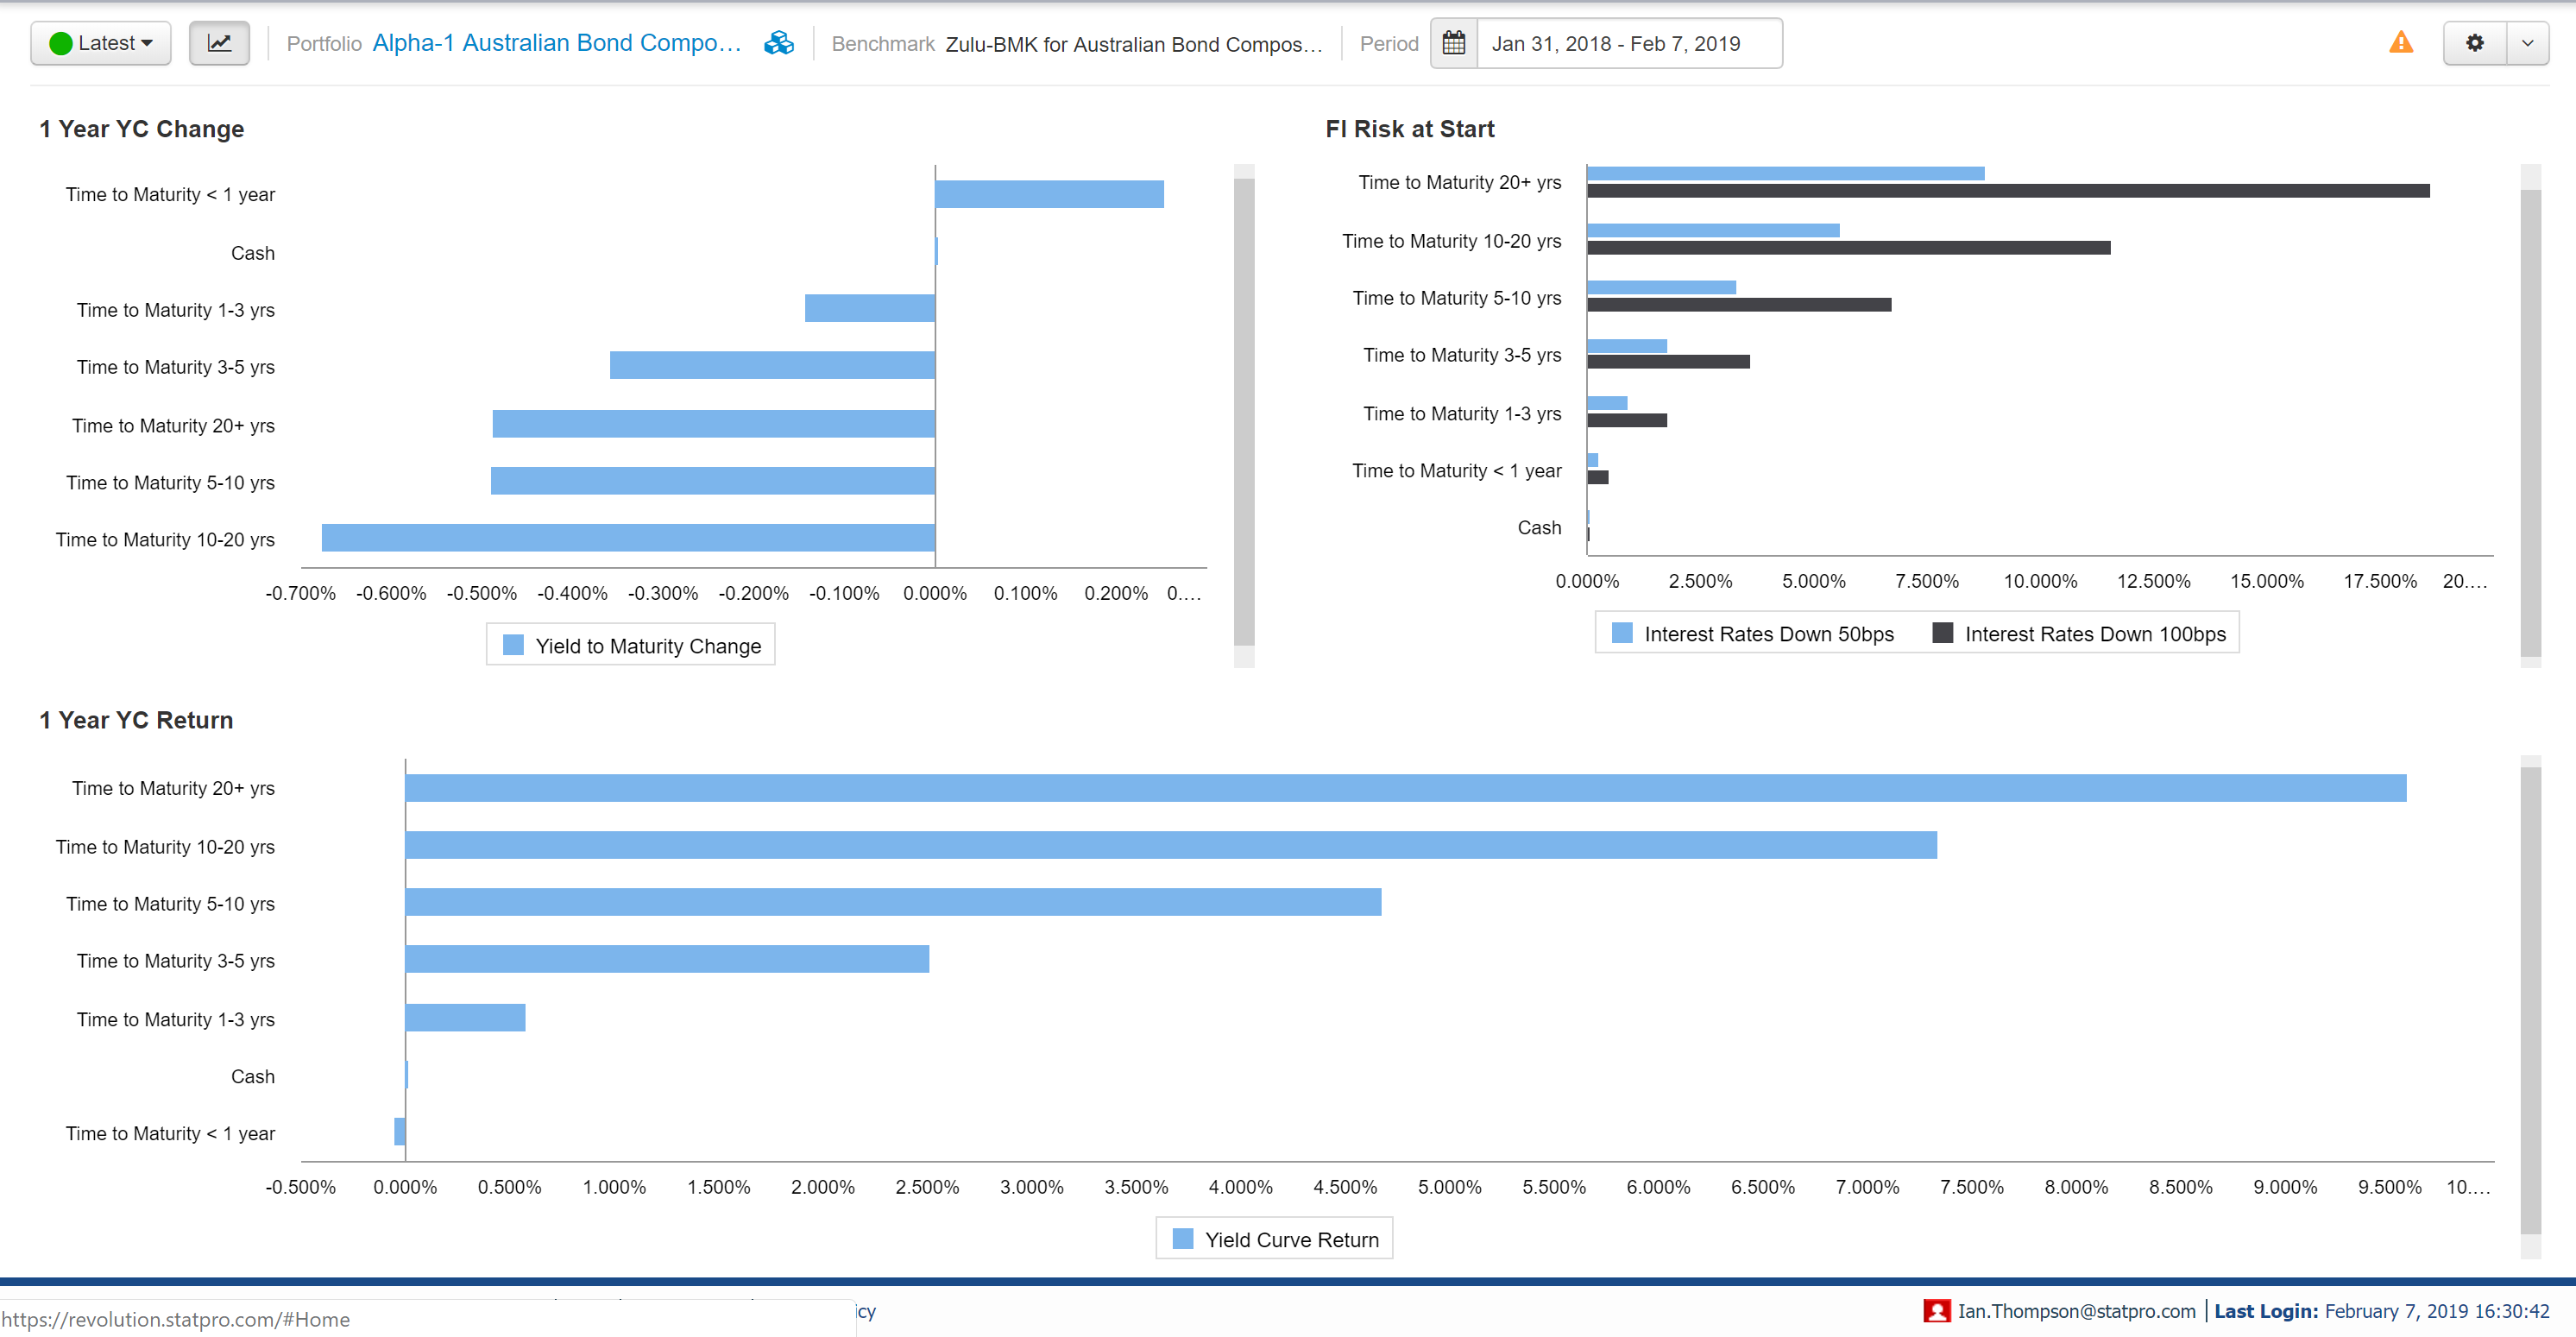
Further, we can see how for specific maturity segments, how the risk sensitivity aligns closely with the yield curve return actually achieved – for example within 20+ years band for approx. 50bps fall we anticipate an impact of around 9%:
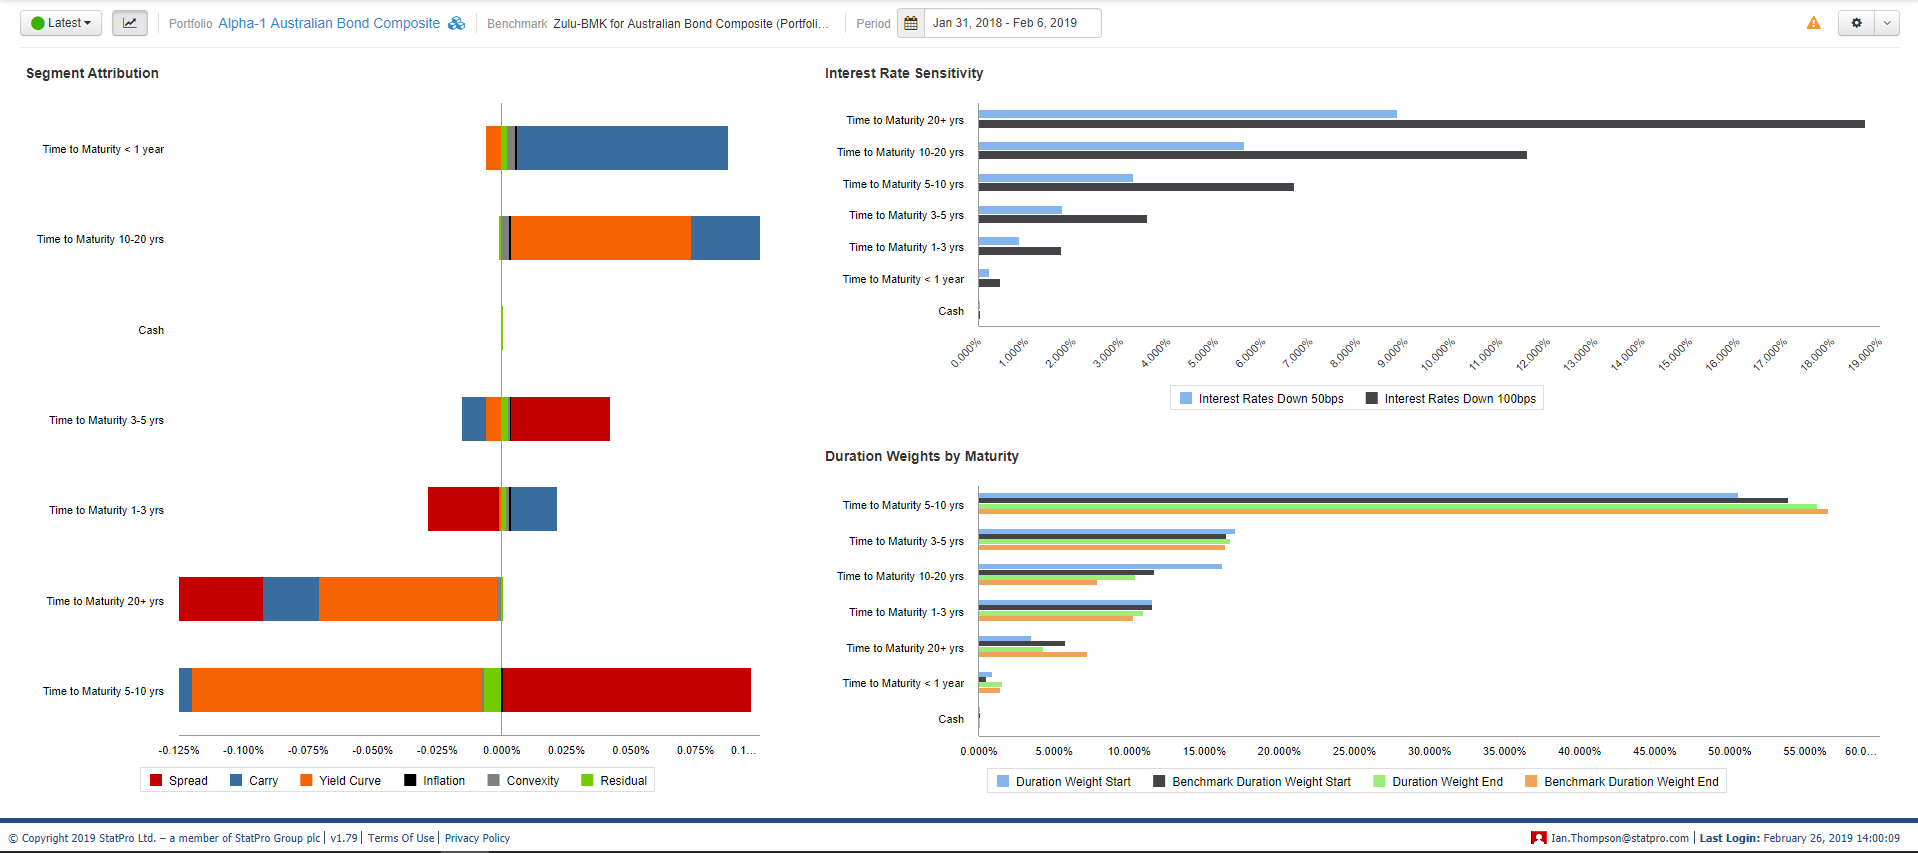
However, when it comes to attribution we are now looking at the decisions relative to the benchmark, and here it becomes apparent that there were actually some poor yield curve decisions. For example, in the 5-10 year segment we see a large negative yield curve effect. However, we can see that in this segment which has a high interest rate sensitivity to downward movement, this segment was underweighted during the period – which was clearly a poor decision. In contrast, 10-20 years was over-weighted which yielded positive impacts.
Conclusion
By combining risk and performance measures within the same analysis dashboards, we can provide valuable insights into FI portfolio analysis.
{{cta(‘84239b14-6c16-4304-863b-fc00aaaf6a7a’)}}