Factors and Falling Interest Rates
January 31st, 2024
by:
Growth Equity Performance
“To what extent will Growth equity outperform Value equity in the US when interest rates fall?” and- “What other factors outperform in this market environment?”
We examined historical stock returns in the US spanning from 1982 to 2023, evaluating the impact of sudden interest rate cuts on equity performance. Our findings reveal:
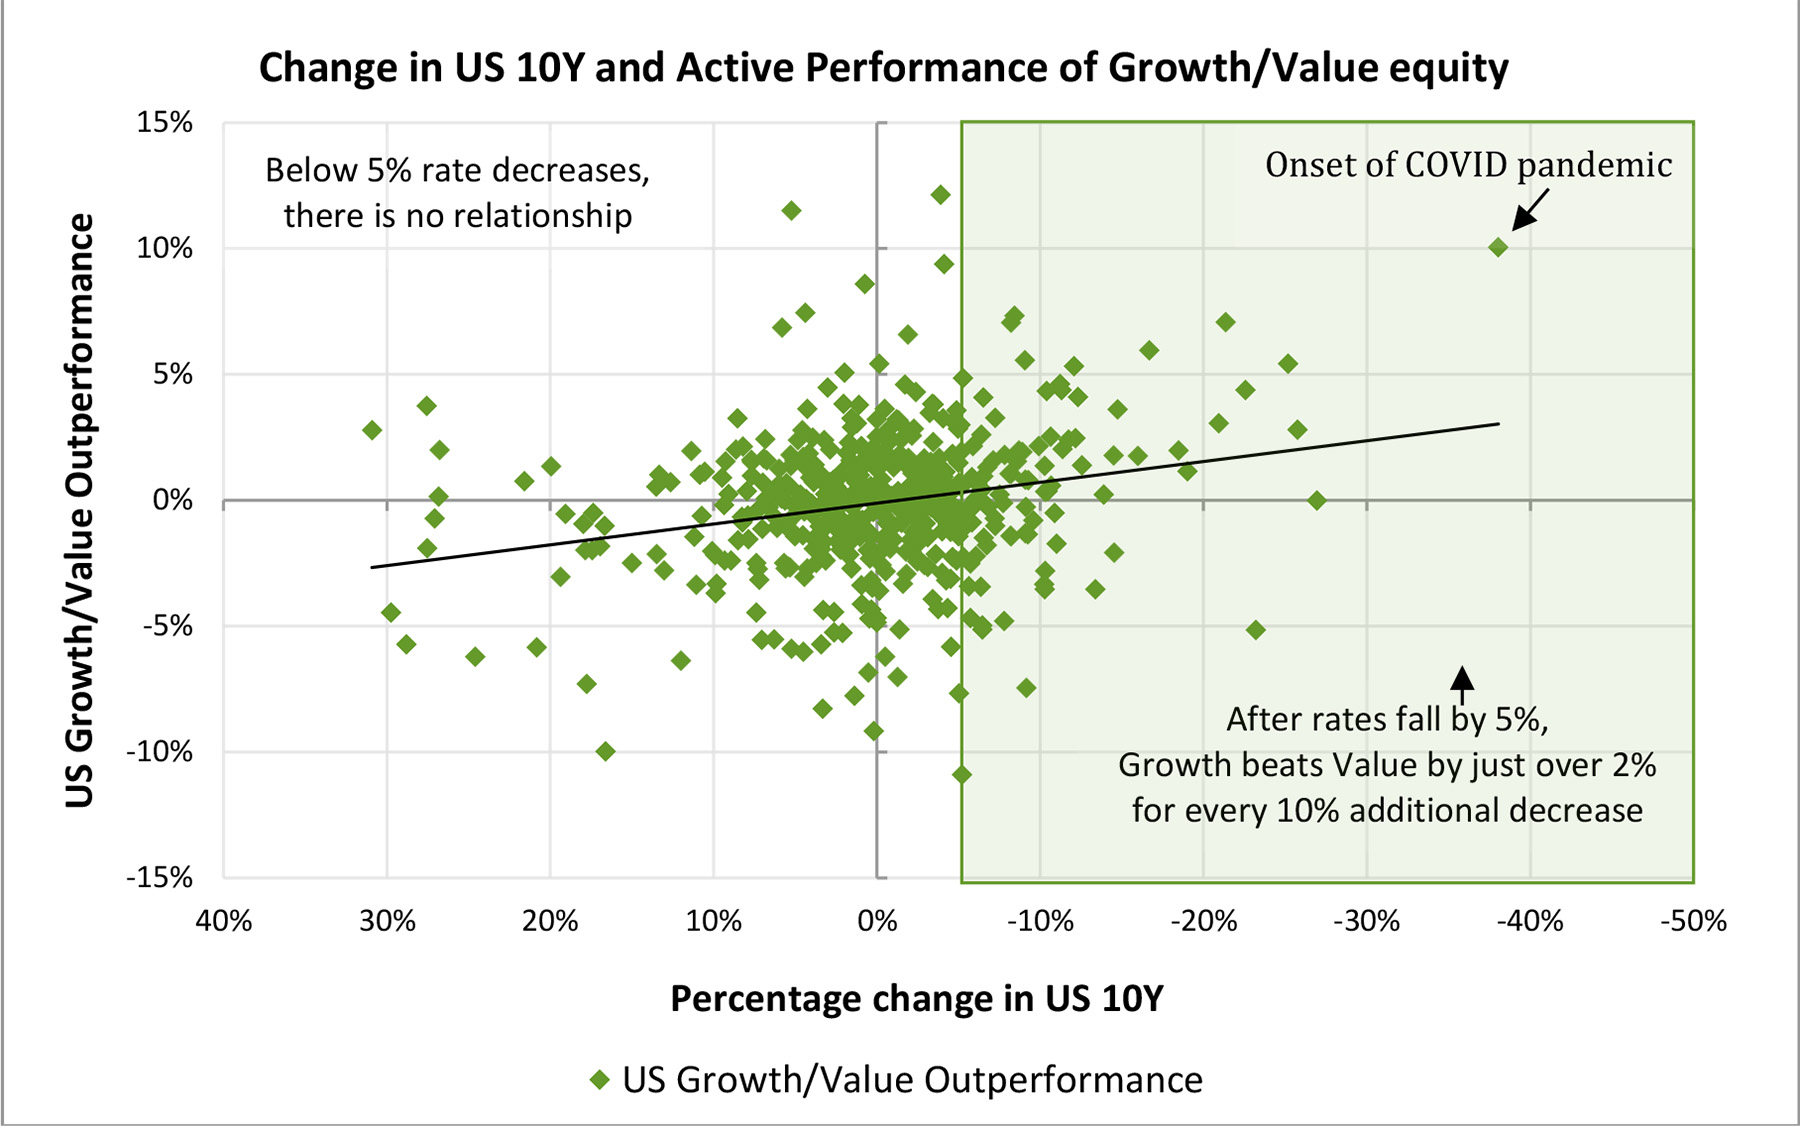
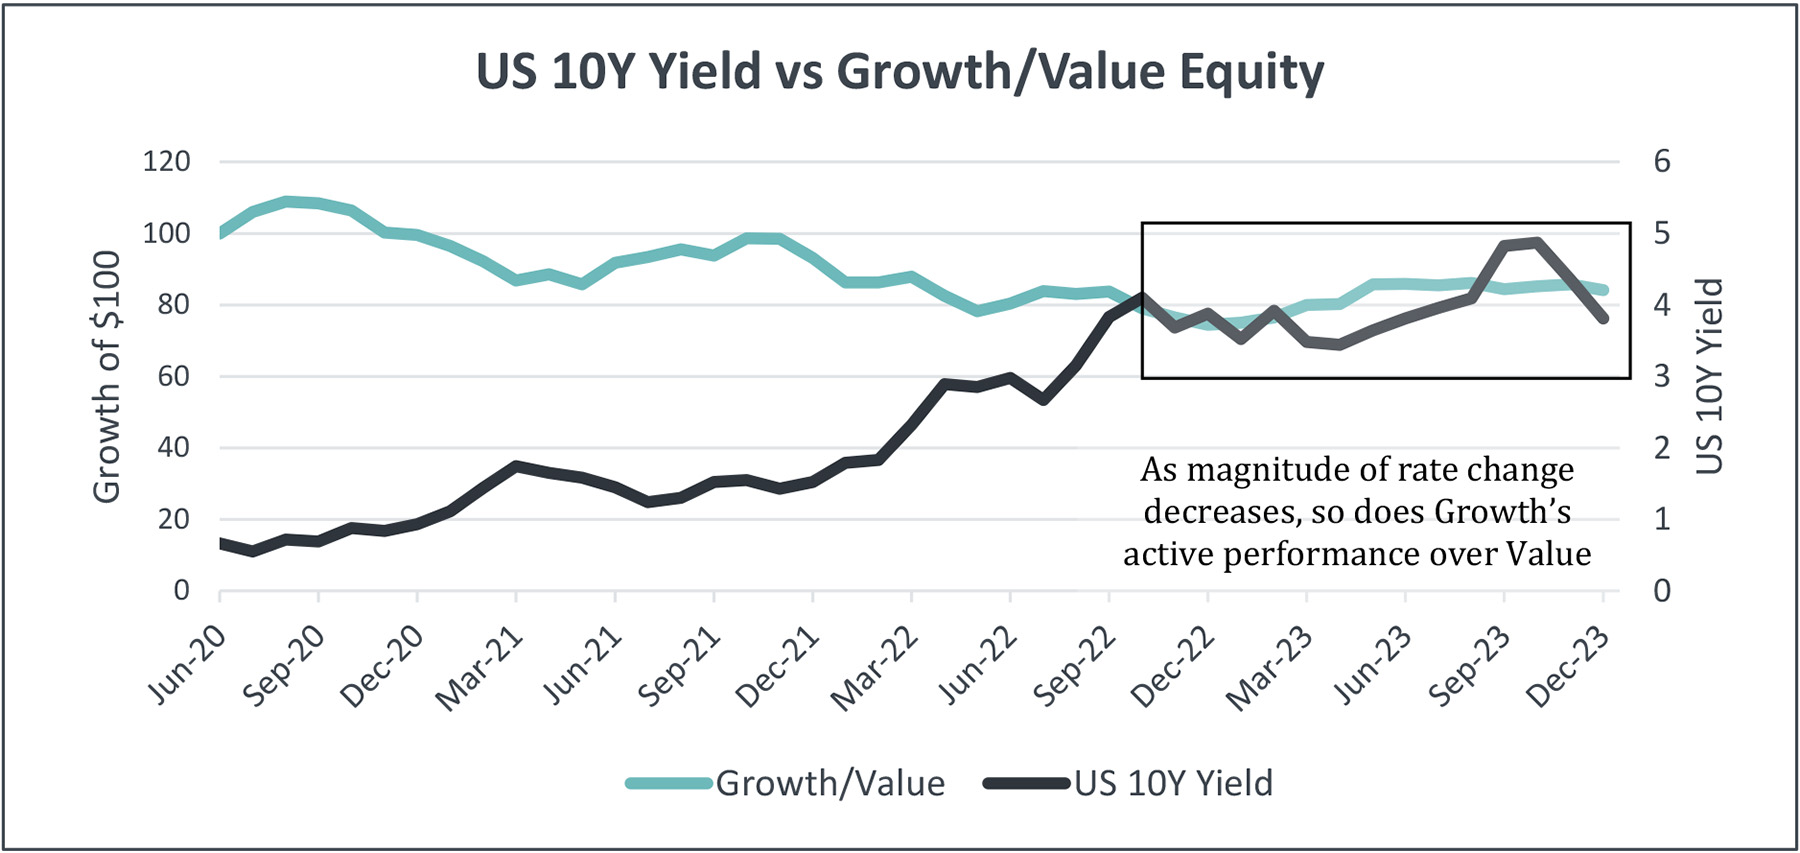
- Growth equity outperforms Value equity, but this is contingent on rapidity of the interest rate decline. A reduction beyond 5% is necessary to influence Growth stocks in the US market.
- In the US, for every 10% decrease in rates after 5%, Growth equity outperforms Value equity by 226 basis points.
- If the 10-year rate decreases by 15%, Growth equity outperforms Value equity by approximately 2.2%.
For instance, a one-month decline from 1% to 0.85% could reasonably result in Growth equity outperforming Value equity in the US by over 200bps, as illustrated in Figure 1. This aligns with our findings in the “Exploring interest Rates to Value vs. Growth Investment Strategies” report, emphasizing the pivotal role of the rate change magnitude.
Source: Federal Reserve Economic Fata (FRED) and Style Analytics Markets Analyzer (2024)
Source: Federal Reserve Economic Fata (FRED) and Style Analytics Markets Analyzer (2024)
Broader Market Trends
While Growth may slightly outperform Value during rate decreases, it is crucial to explore broader market trends beyond Growth vs. Value.
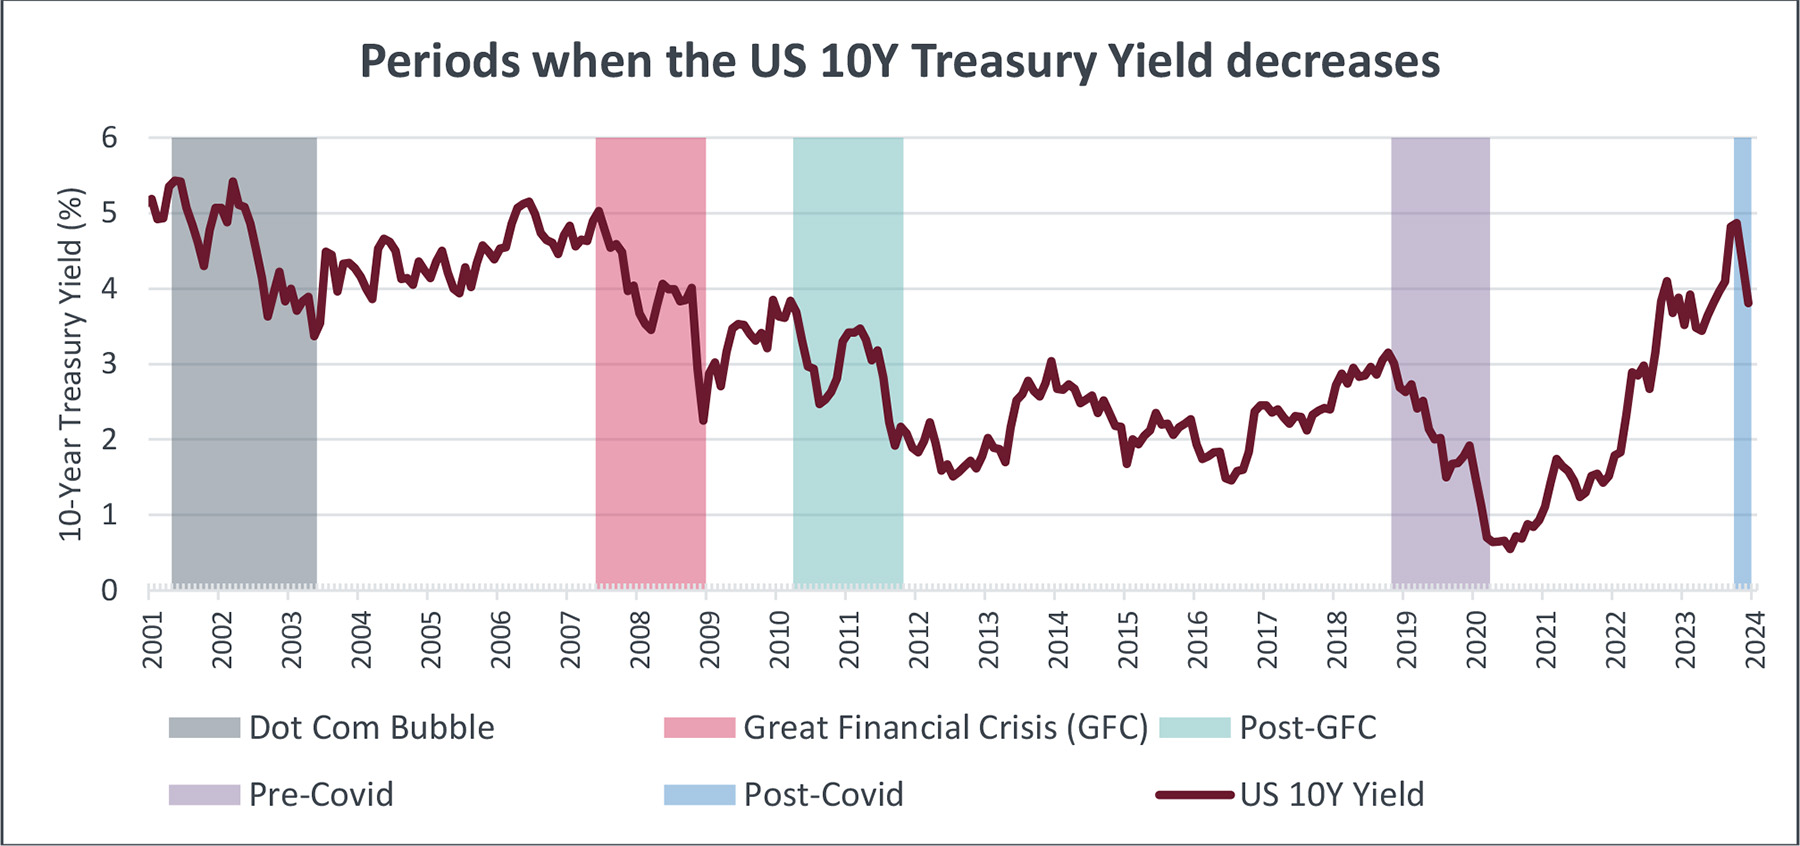
To gain insights on the factor trend during these times, we identified four significant rate-decreasing periods in addition to the post-Covid period today:
- Dot Com Bubble (April 2001 – May 2003)
- Great Financial Crisis (GFC) (May 2007 – December 2008)
- Post-GFC (April 2010 – October 2011)
- Pre-Covid (October 2018 – March 2020)
- Post-Covid (September 2023 – December 2023)
Source: Federal Reserve Economic Fata (FRED) (2024)
During the Dot Com Bubble burst, Value equity exhibited unparalleled dominance, outperforming the market by nearly 13% despite underperforming in other periods. Excluding this outlier period yields the results depicted in Figure 4 below:
Source: Style Analytics Markets Analyzer (2024)
Figures 7 and 8: Equity factor performance in the US market when 10Y yields fell, during the bursting of the Dot Com Bubble, and the period leading up to the COVID pandemic.
Source: Style Analytics Markets Analyzer (2024)
Summary
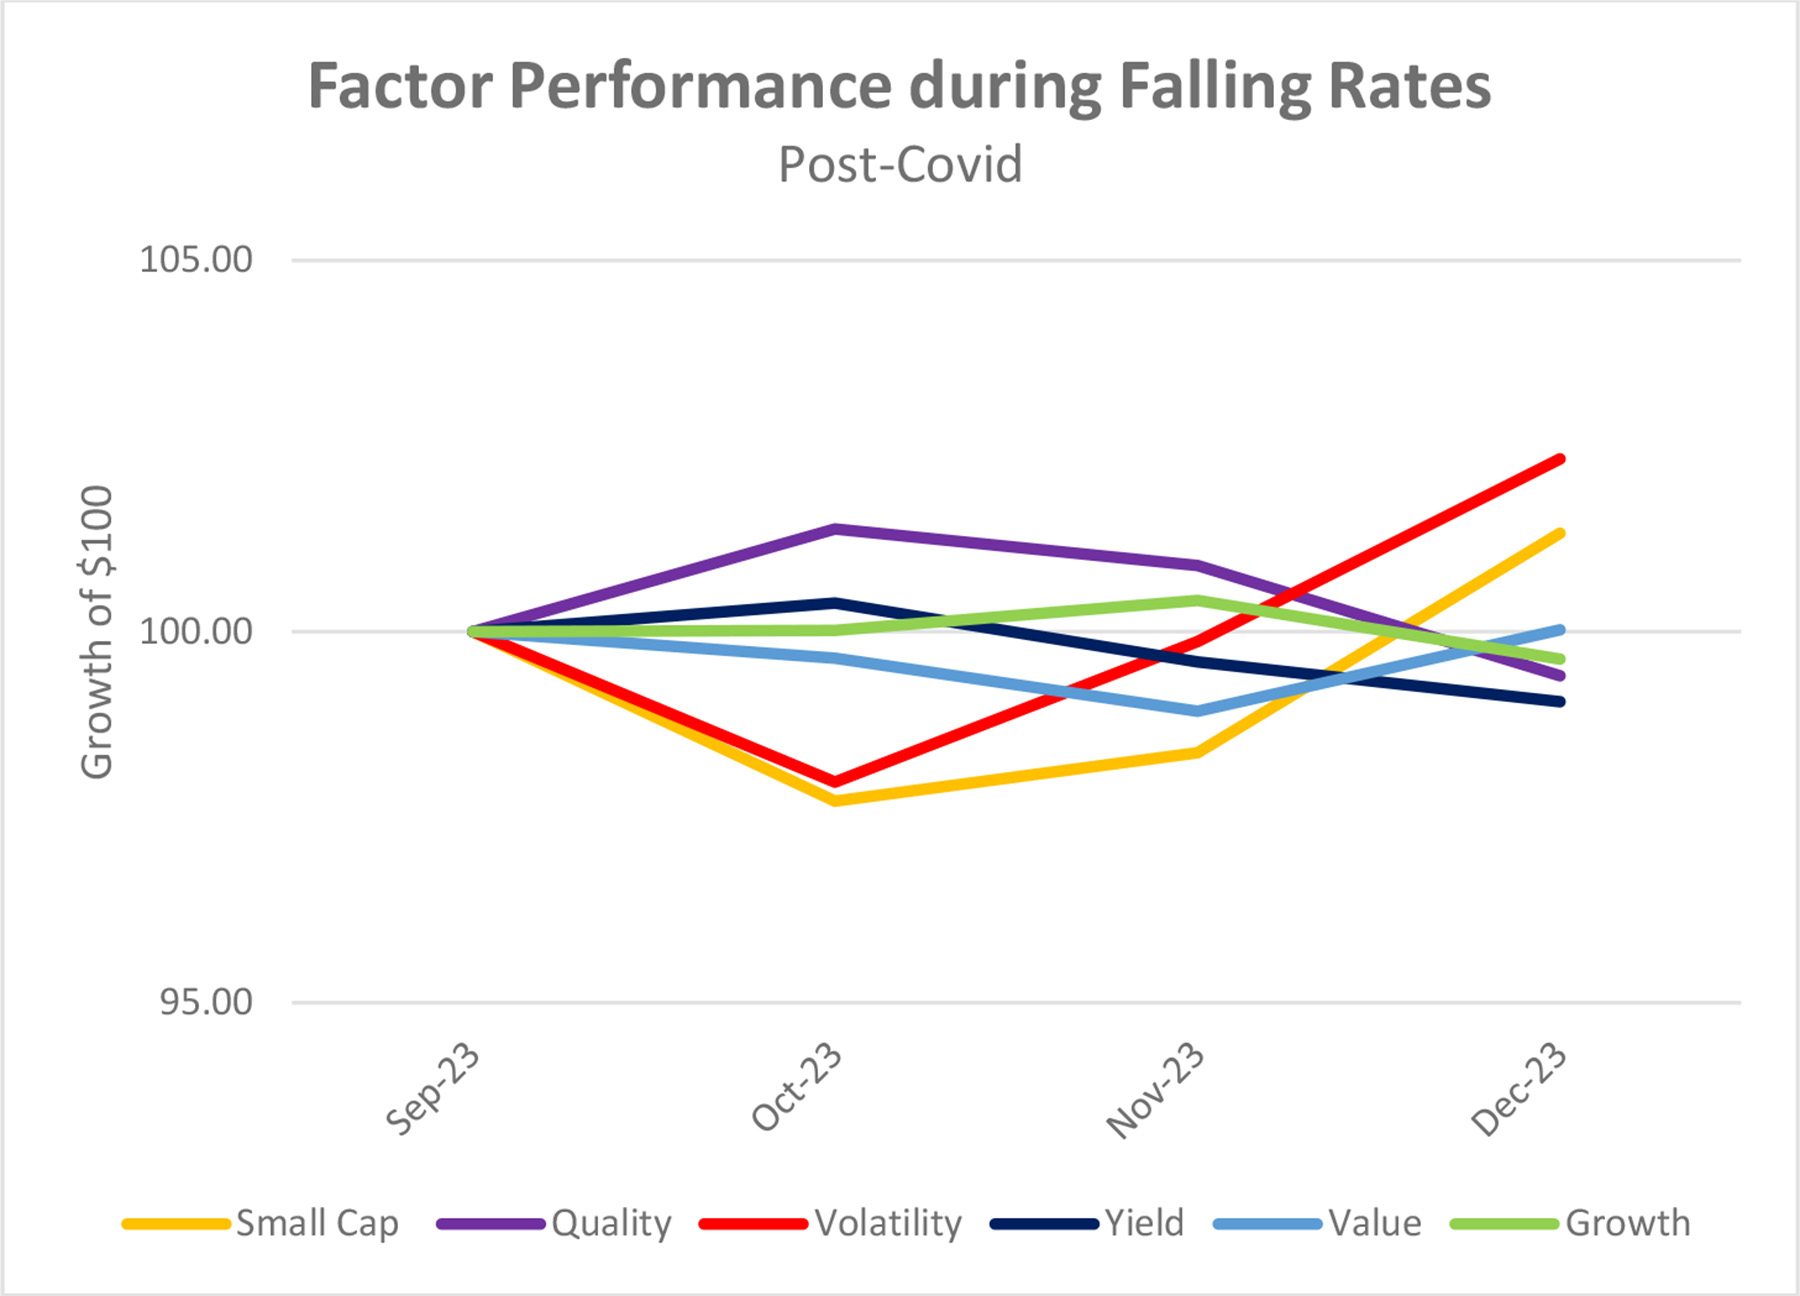
In summary, periods of decreasing 10-year rates often coincide with economic downturns, as the Federal Reserve adopts dovish monetary policy. While Growth may outperform Value in these scenarios, the flight to Quality and Yield is much more pronounced. The recent rate decrease in Q4 2023 differs from the past, as Volatility has unexpectedly outperformed, suggesting a potential shift in the flight to Quality. Historically, Volatility has underperformed so this period of outperformance suggests that we may be ahead of the flight to safer stocks this time around.
We seem to be gradually returning to “normalcy” from the post-Covid era, with inflation stabilizing around 3%. Although the federal funds rate is at 5%, the recent Volatility outperformance resembles a slow shift towards normalcy rather than the risk of further recession, contrasting with the scenarios during the Dot Com Bubble burst and the Great Financial Crisis.
Disclaimer
The information contained in this communication is for informational purposes only. Investment Metrics, a Confluence company, is not providing legal, financial, accounting, compliance or other similar services or advice through this communication. Recipients of this communication are responsible for understanding the regulatory and legal requirements applicable to their business.
About Confluence
For more information, visit confluence.com
In this article:


