With the UK general election scheduled for July 4th 2024, we conducted a historical analysis of factor performance in the periods surrounding previous elections. In total, we analyzed six UK general election periods between 2001 and 2019, examining how factors performed in the six months leading up to and following the vote.
Key Findings
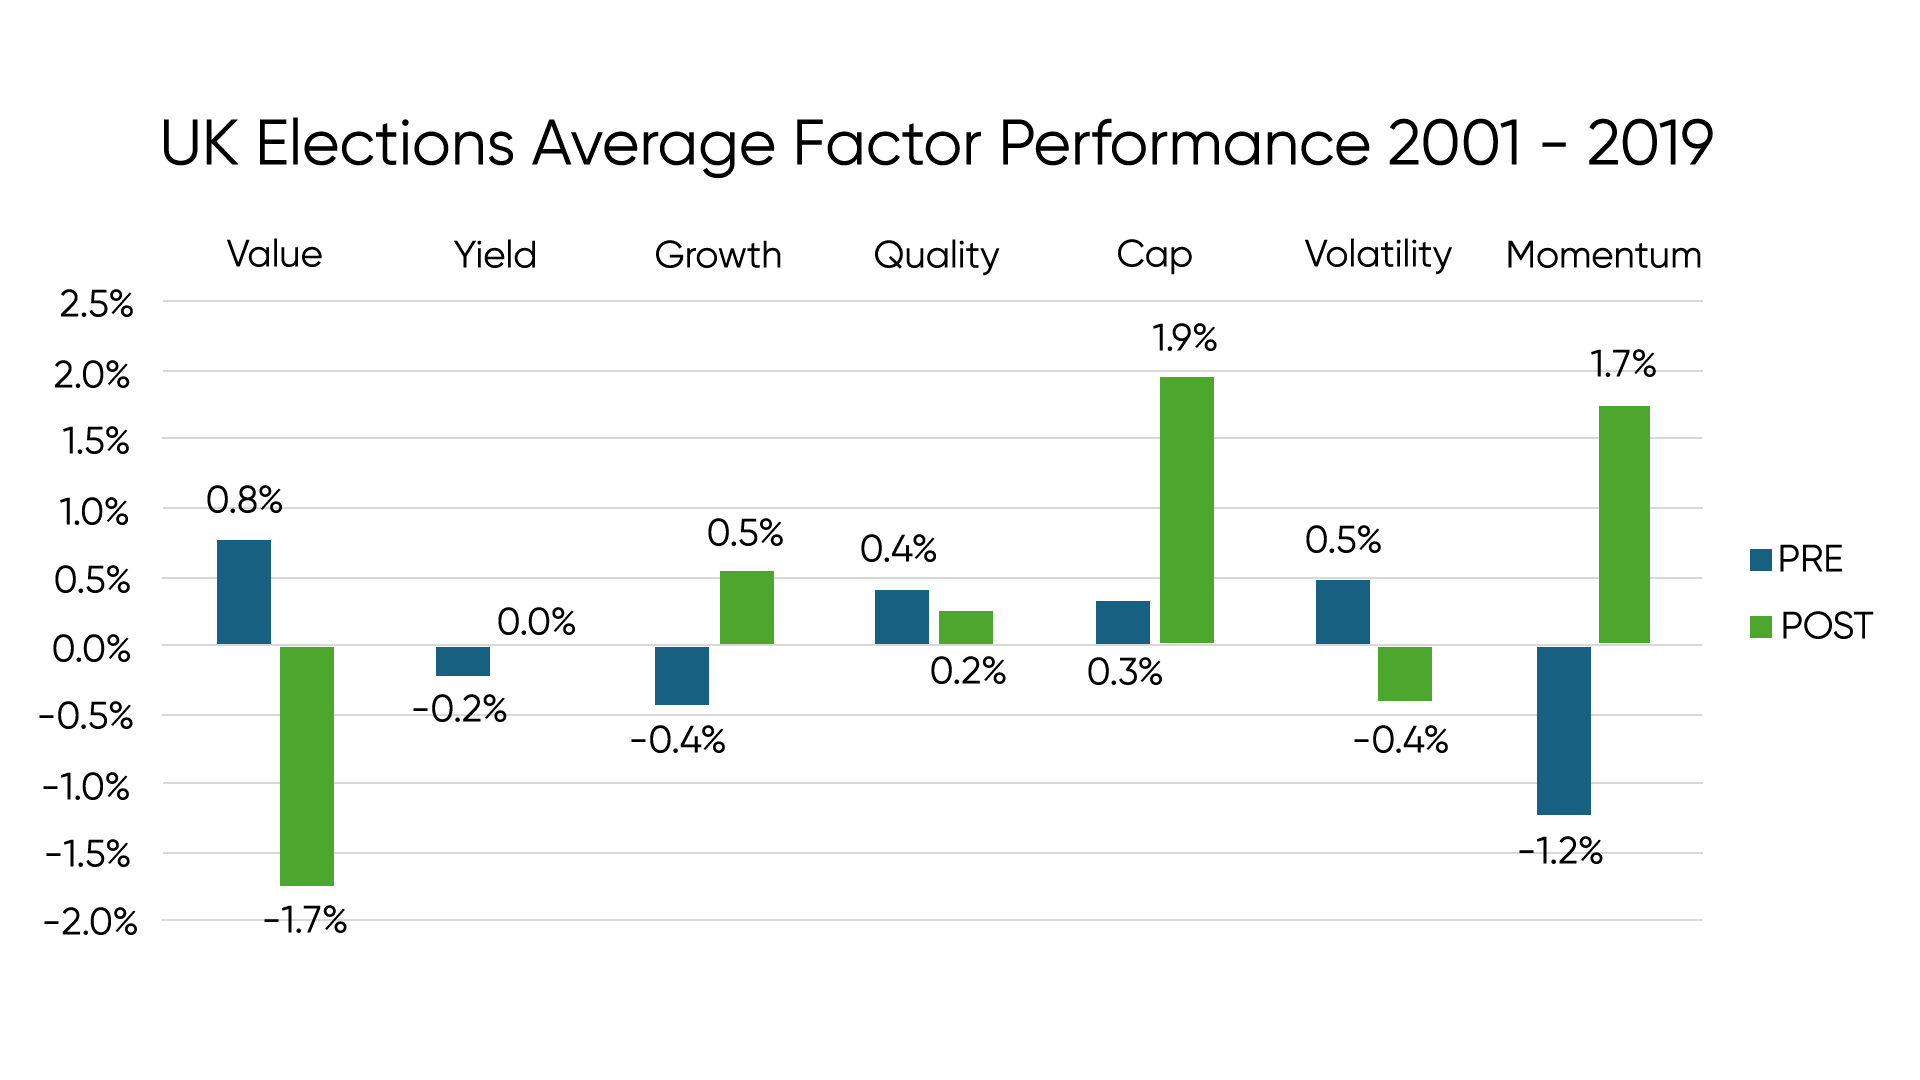
- Value stocks outperform the market in the period leading up to an election, while Momentum underperforms.
- Performance reverses post-election, with Value underperforming, and Momentum outperforming
- Large caps perform best in periods following an election, while Quality fares well throughout
- Uncertainty, and a declining equity risk premium surrounding elections is the likely driver behind these trends, supporting a shift from Value to Momentum as uncertainty dissipates.

Chart 1: UK Elections Average Factor Performance 2001-2019
Stocks in the broad UK market are sorted into factor portfolios according to their factor values. Portfolios are rebalanced monthly, sector adjusted, and returns are calculated relative to the UK market. Source: Style Analytics Markets Analyzer
The chart above shows the average market relative performance of each factor category over the past six elections. Value stocks tend to outperform the market in the lead-up to an election and then subsequently underperform in the following period. Growth and Momentum demonstrate the inverse of that trend, underperforming in the lead-up to an election and outperforming in the following period, with Momentum demonstrating the strongest signal. Meanwhile, large caps tended to perform the best in post-election periods.
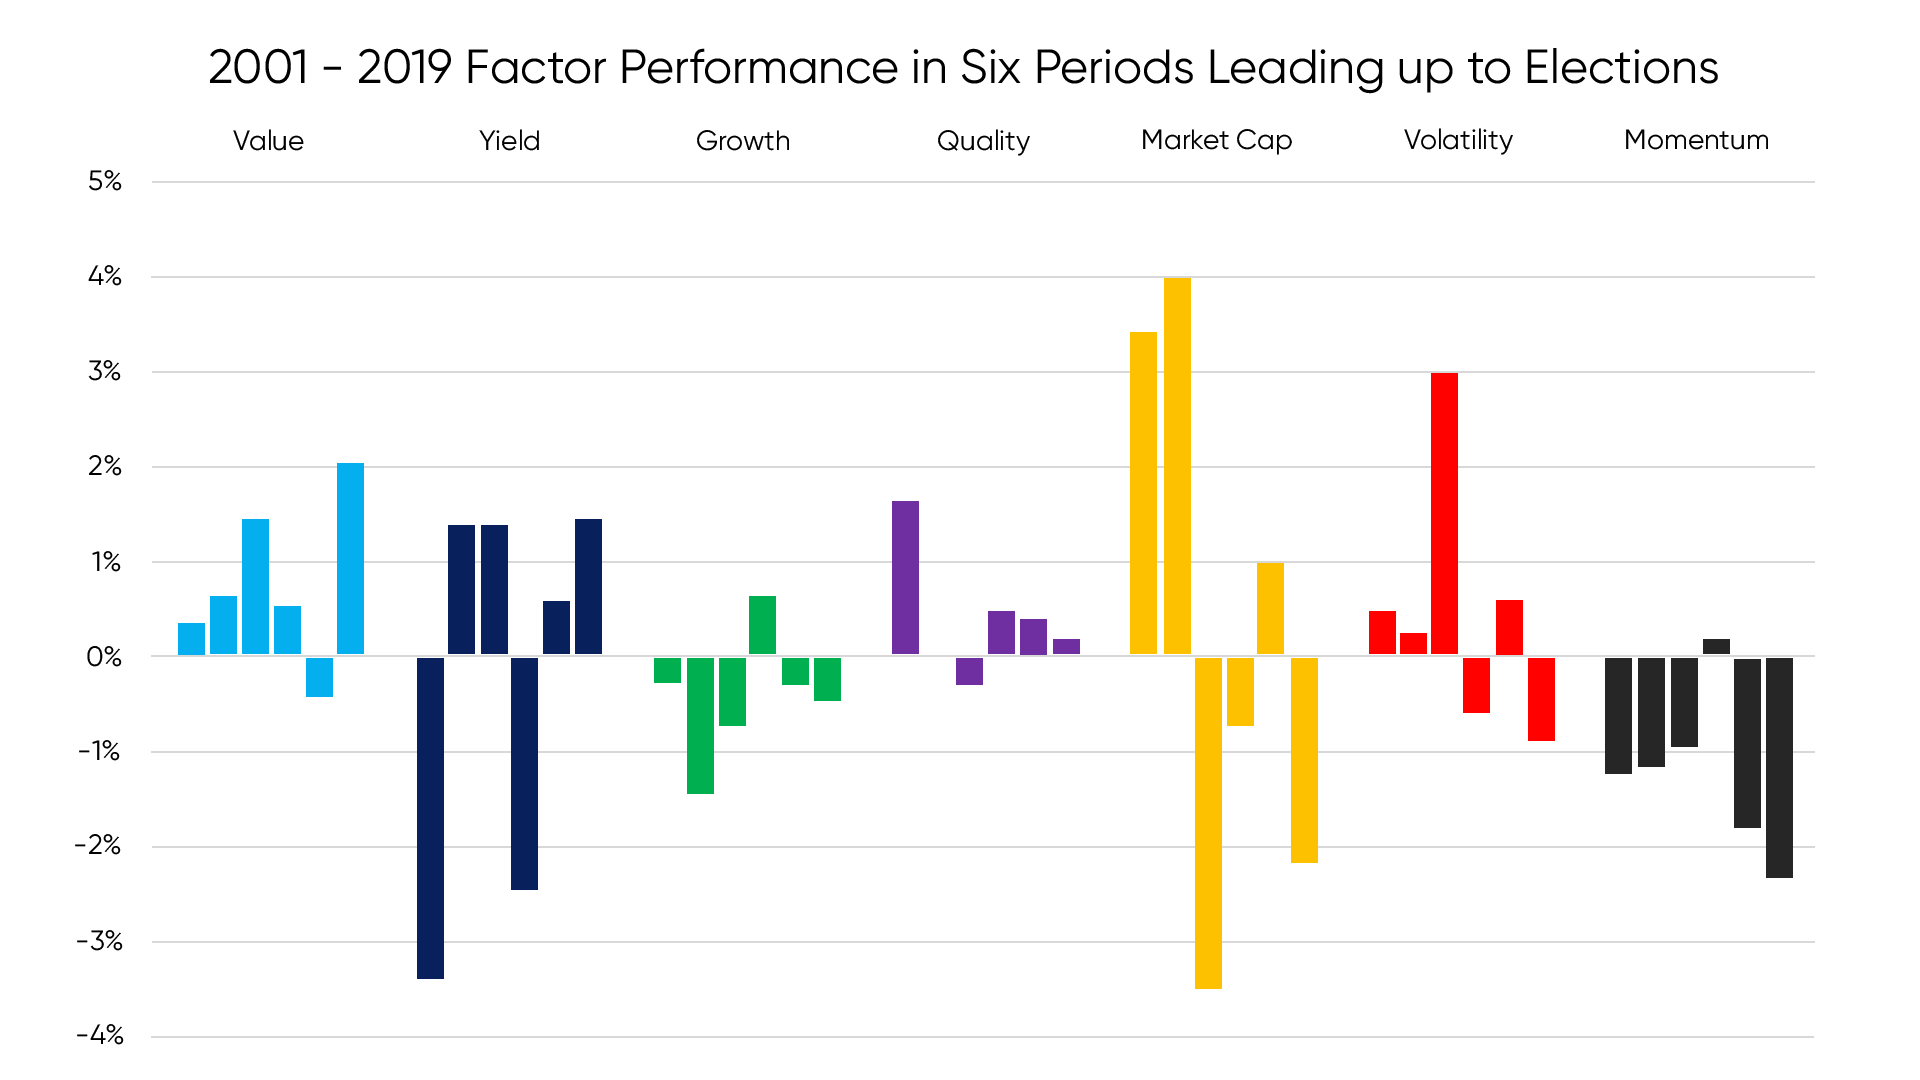
Chart 2: 2001-2019 Factor Performance in Six Periods Leading up to the Elections
Stocks in the broad UK market are sorted into factor portfolios according to their factor values. Portfolios are rebalanced monthly, sector adjusted, and returns are calculated relative to the UK market. Source: Style Analytics Markets Analyzer
The chart above demonstrates how consistently factors performed by comparing their performance in the period leading up to each of the six elections in our analysis. Here, we can see that the strongest signals come from Value, outperforming in five of six periods, as well as Growth and Momentum, which underperformed in five of six periods.
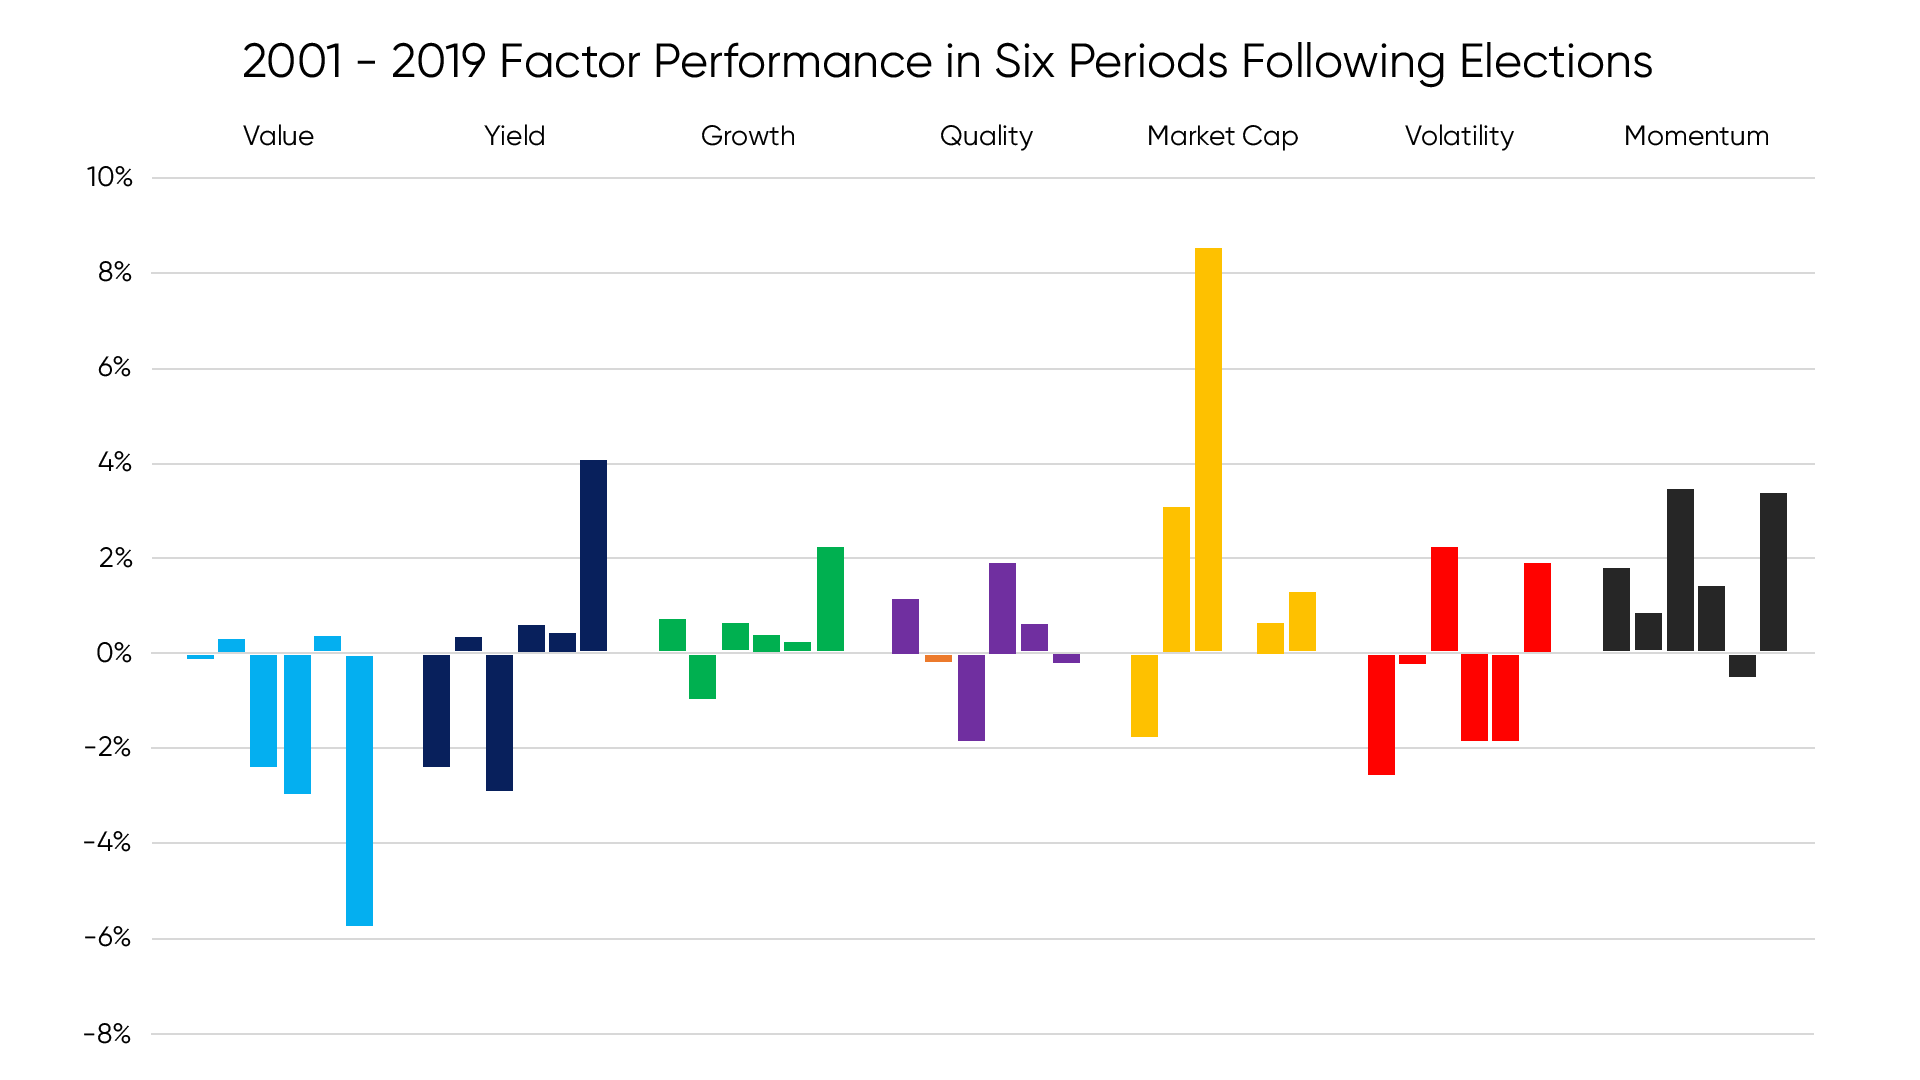
Chart 3: 2001-2019 Factor Performance in Six Periods Following Elections
Stocks in the broad UK market are sorted into factor portfolios according to their factor values. Portfolios are rebalanced monthly, sector adjusted and returns are calculated relative to the UK market. Source: Style Analytics Markets Analyzer
In the periods following elections, we see the key factor signals flip. In these periods, Value underperformed significantly in three periods, and was market neutral in the other three. Growth tended to outperform modestly, while Momentum was the best performer.
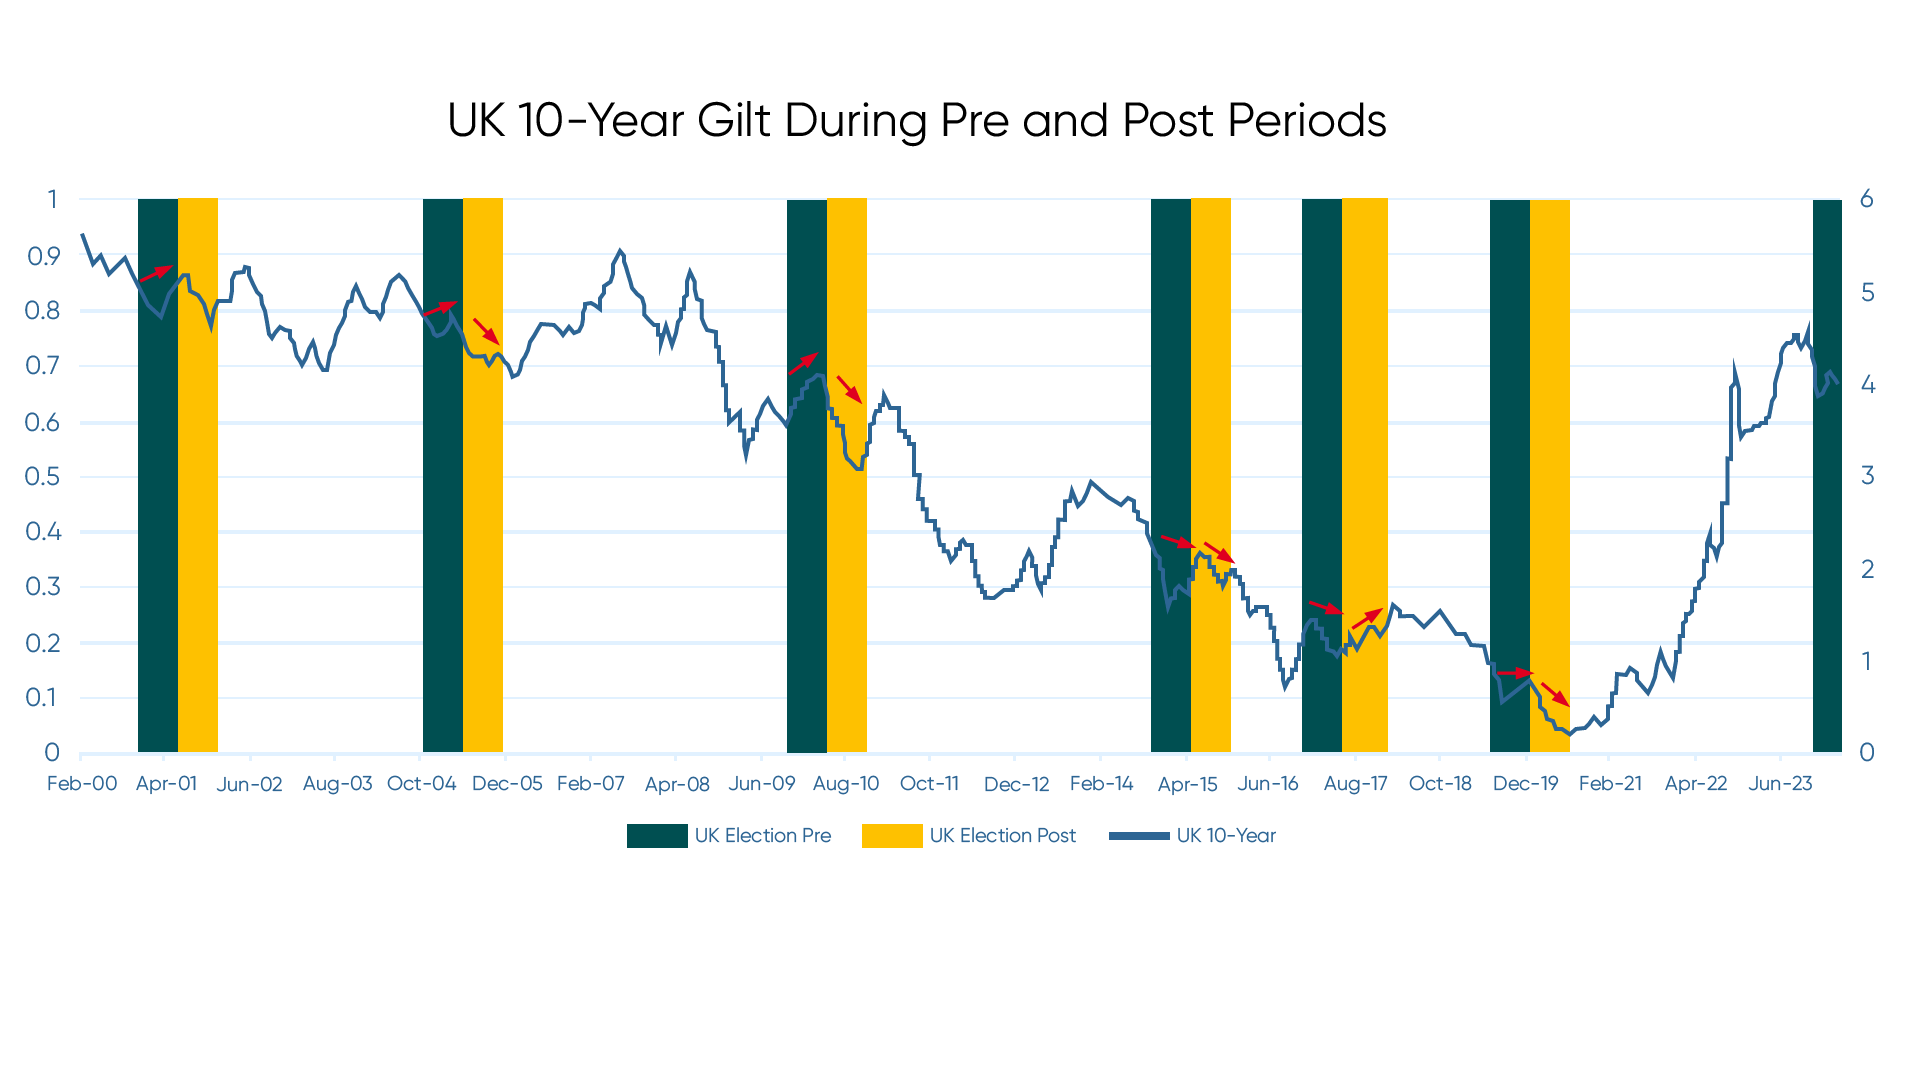
Chart 4: UK 10-Year Gilt During Pre and Post Periods
Federal Reserve Economic Data
To contextualize these trends, we looked at the UK 10-Year Gilt. The red arrows in the above chart show that rates rose in the periods leading up to the first three elections in our analysis, indicating strength for Value. Meanwhile, in the three more recent periods, rates tended to be flat, or slightly down. The more consistent trend was in the periods following elections, where rates reversed. In five of the six periods, we saw rates decline substantially, which indicates Value weakness, Growth strength, and an environment where Momentum gained.
One explanation for our findings is that periods leading up to elections are often marked by uncertainty. This causes rates to rise and the equity risk premium to decrease, tilting the scales for Value over Growth. Once the election results are confirmed, that uncertainty dissipates, and investors proceed to allocate capital. This leads to a momentum wave where popular trades do well in the medium term and interest rates decline as the equity risk premium increases. One key exception where rates didn’t fall post-election was in 2017, where the results led to yet more uncertainty and a lack of confidence as conservatives lost their majority.
Looking at history, it matters less which party comes out on top, but instead simply that the election results go from an unknown to a known. In short, if we see history repeat: wait and see, and the trend will be your friend.
The material presented in this document is an assessment of the market environment as of the date indicated; is subject to change; and is not intended to be a forecast of future events or a guarantee of future results. This information should not be relied upon by the reader as research or investment advice regarding any funds or any issuer or security or similar.
This document contains general information only, does not consider an individual’s financial circumstances and should not be relied upon for an investment decision. Rather, an assessment should be made as to whether the information is appropriate in individual circumstances and consideration should always be given to consult a financial advisor before making an investment decision.
Confluence does not provide investment advice and nothing in this document should be considered any form of advice.
Confluence accepts no liability whatsoever for any information provided or inferred in this document.
Confluence is a leading global technology solutions provider committed to helping the investment management industry solve complex data challenges across the front, middle and back office. From data-driven portfolio analytics to compliance and regulatory solutions, including investment insights and research, Confluence invests in the latest technology to meet the evolving needs of asset managers, asset owners, asset services and asset allocators to provide best-of-breed solutions that deliver maximum scalability, speed and flexibility, while reducing risk and increasing efficiency. Headquartered in Pittsburgh, PA, with 900+ employees in 15 offices spanning across the United Kingdom, Europe, North America, South Africa, and Australia, Confluence services over 1000 clients in more than 40 countries.
For more information, visit
www.confluence.com


