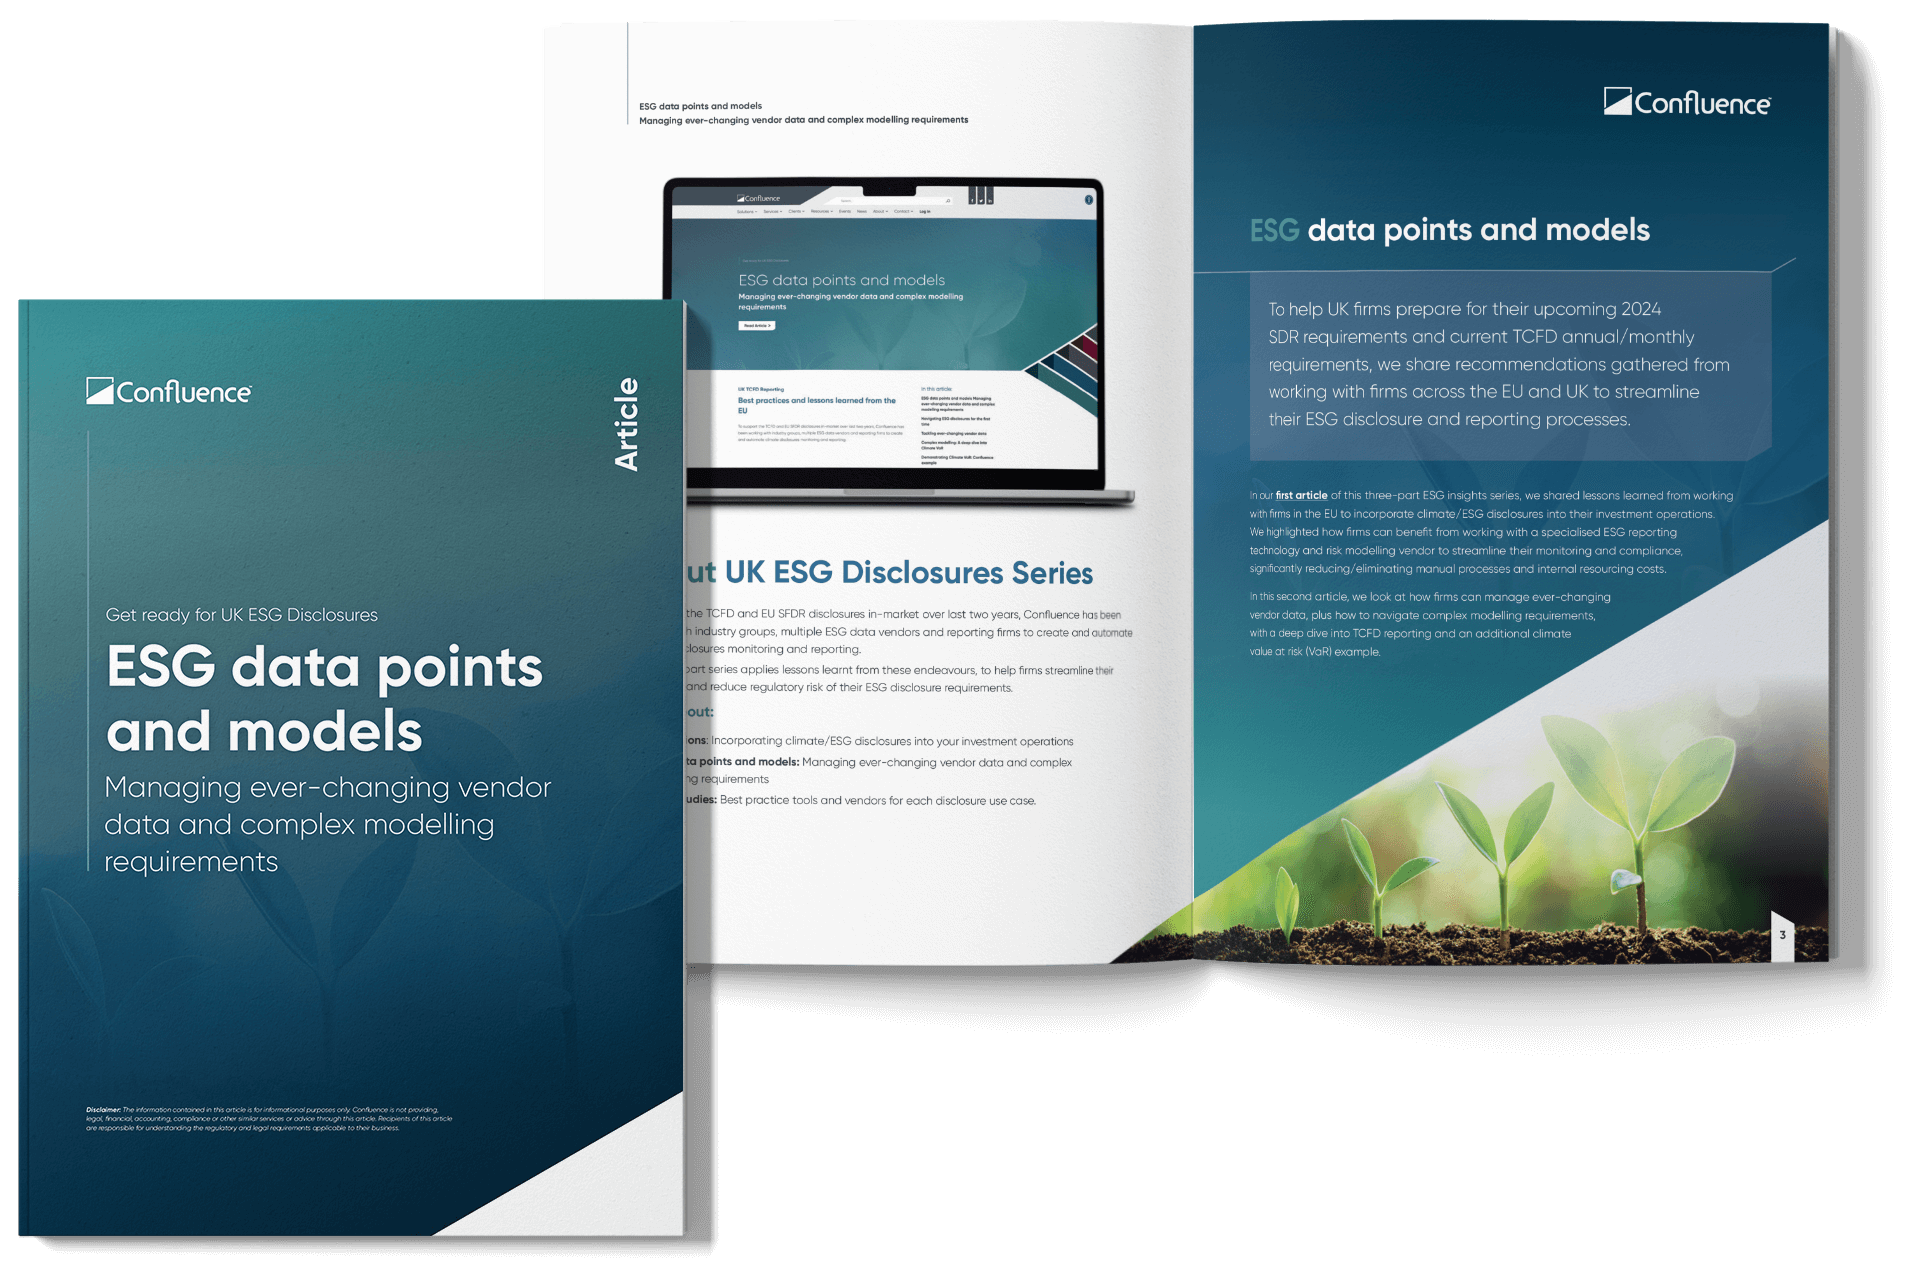
ESG data points and models
Managing ever-changing vendor data and complex modelling requirements
UK TCFD Reporting
Best practices and lessons learned from the EU
To support the TCFD and EU SFDR disclosures in-market over last two years, Confluence has been working with industry groups, multiple ESG data vendors and reporting firms to create and automate climate disclosures monitoring and reporting.
This three-part series applies lessons learnt from these endeavours, to help firms streamline their operations and reduce regulatory risk of their ESG disclosure requirements.
Discover the articles in this series:
ESG data points and models
Managing changing vendor data and complex modelling requirements

Operations
Incorporating climate/ESG disclosures into your investment operations
ESG data points and models
To help UK firms prepare for their upcoming 2024 SDR requirements and current TCFD annual/monthly requirements, we share recommendations gathered from working with firms across the EU and UK to streamline their ESG disclosure and reporting processes.
In our first article of this three-part ESG insights series, we shared lessons learned from working with firms in the EU to incorporate climate/ESG disclosures into their investment operations. We highlighted firms can benefit from working with a specialised ESG reporting technology and risk modelling vendor to streamline their monitoring and compliance, significantly reducing/eliminating manual processes and internal resourcing costs.
In this second article, we look at how firms can manage ever-changing vendor data, plus how to navigate complex modelling requirements, with a deep dive into TCFD reporting and an additional climate value at risk (VaR) example.
Navigating ESG disclosures for the first time
From 2017 the Financial Stability Board’s (FSB) Task force on Climate-Related Financial Disclosures (TCFD) set an important framework for the investment management industry to voluntarily inform financial markets of the actual and potential impacts of climate change risk. Since March 2021 the European Union has mandated compliance with the Sustainable Finance Disclosure Regulation (SFDR) on how to disclose sustainability information, with the broader objective of “attracting private funding to help Europe make the shift to a net-zero economy”. Both TCFD and SFDR form the ESG disclosure framework for EU and impact UK investment management firms.
The EU SFDR regulation was the first mandated ESG disclosure in the investment industry and many firms have adopted the voluntary TCFD disclosures to align with shareholder and client expectations. In the Task Force on Climate-Related Financial Disclosures 2023 Status Report, 70% of asset managers and 84% of asset owners surveyed are providing climate-related reporting to clients and beneficiaries.
However, navigating ESG disclosures has been challenging for firms:
- Ever-changing regulations and vendor data – both ESG data vendors and regulations don’t stand still and firms need to constantly stay up to date with the latest requirements and data sets
- New capabilities needed – both TCFD and SFDR mandate the use of a climate risk monitoring tools to model and track progress of their stated goals in disclosures. This has been a new endeavour for most firms with no standardised methodology adopted by the industry.
Tackling ever-changing vendor data
Mapping and maintaining required disclosure metrics is a complex, time-consuming process. Regulations continue to evolve and vary from jurisdiction to jurisdiction. ESG data vendors can vary in both quality and regulatory requirements coverage and are continuously adjusting their data and data sets. Firms firstly in the EU and now in the UK are challenged by the lack of harmonisation in ESG reporting standards and a lack of a centralised platform for ESG data collection and reporting.
The key is to work with a specialised ESG reporting technology and risk modelling vendor to remove the manual processes of finding the latest data sets to comply with regulation updates, and to simplify data modelling into a ready-to-use, compliant report. The templated report needs to cover the totality of the portfolio across multiple asset classes, from equities to fixed income, and from mutual funds to derivatives if needed.
Confluence streamlines ongoing data mapping and maintenance for firms for current and future ESG regulations, working with multiple ESG vendors and reporting firms to create and automate climate disclosure monitoring and reporting. Specifically, for TCFD regulations, we partner with ESG specialist data vendor S&P Trucost.
Core TCFD metrics and categories are in-built for ESG risk assessment and reporting templates into the Confluence Revolution ESG solution. Using this end-to-end ESG monitoring and reporting tool, firms can access carbon performance, exposure to fossil fuels, power generation across renewable and non-renewable sources, green taxonomy disclosures, net-zero alignment according to various temperature pathways, scenario analysis based on physical risks monitoring across different severities, among other variables. The Portfolio Assessment Summary Report (TCFD aligned) below demonstrates an aggregated example.

Complex modelling: A deep dive into Climate VaR
Climate risk disclosures are increasingly recommending additional complex modelling to satisfy their requirements, from EU SFDR to UK TCFD. Initially the European Central Bank (ECB), Bank of England and Financial Conduct Authority (FCA), among others, focused on simpler metrics and have since shifted towards more complex requirements. Canada, Australia and New Zealand are also leading the way with more advanced climate risk disclosures. In September 2022 New Zealand was the first country to announce mandatory TCFD reporting for banks, major asset managers and insurers.
Among other variables, the TCFD framework focuses on the importance of monitoring carbon performance and scenario analysis. To estimate the potential impact of climate-related events on financial performance, scenarios analysis across both physical and transition climate risks needs to be conducted, for informed and improved investment strategies.
While measuring risk at all levels of a financial portfolio has become standard practice, identifying the underlying source/s of these risks is more challenging. Standard VaR modelling aims to identify the pure risk exposure to the global financial system, by analysing several market risk drivers such as equity price movements and volatility, interest rates/credit spread shifts and FX inflation rate fluctuations.
Climate value at risk (VaR) is a key risk modelling tool used by the industry to measure climate impacts. A portfolio’s potential climate-related risk is modelled, analysing market driven risks in combination with stressed exposure to physical and transition risks across a range of risk horizons.
From our experience working with firms in the EU and the UK to deliver on their ESG disclosures, we recommend the following metrics are integrated into a firm’s climate-risk modelling:
- Physical risks
Climate change is a leading cause of physical risks. Key hazard risk types include coldwaves, heatwaves, hurricanes, floods, wildfires and water stresses, both acute and chronic. Companies are typically scored 1-100 against the hazard risk types — the higher the value, the higher their climate risk exposure. Ideally the assessment features different climate change scenarios of low, medium and high against future reference years, for example, 2030 and 2050. - Transition risks
With global shifts towards net-zero sustainable economies, companies need to assess their transition risks consisting of policy and legal risks, technological, market and reputational risks driven by the transition to low carbon, climate-resilient economies.- Policy risks include mandated energy efficiency requirements, carbon-pricing mechanisms triggering increased fossil fuels pricing and policies encouraging sustainable land use
- Legal risks include litigation for failing to avoid or minimise adverse impacts on the climate, or failing to adapt to climate change
- Technology risks include higher climate-damaging technology replacing lower climate-damaging technology
- Market risks include customers shifting towards products and services less or more damaging to the climate
- Reputational risks reflect the difficulty in attracting or retaining customers, employees, business partners and investors if a company has a climate-damaging reputation.
A key transition risk measure is Carbon Earnings at Risk to stress test a company’s current and potential earnings at risk, assessing their ability to absorb future carbon price increase.
Similar to physical risks, transition risks assessment needs to address different climate change scenarios, in this case focusing on low, medium and high carbon pricing changes, against future reference years. Key metrics typically include EBIT/EBITDA margin reduction, or adjusted EBIT/EBITDA margin against unpriced carbon costs.
Climate adjusted market risk
Climate adjusted market risk provides forecasts of the potential forward looking downsides associated with climate change. The assessment takes into consideration the combination of market, physical and transition risks across a range of risk horizons and severity scenarios.
Demonstrating Climate VaR: Confluence example
Applying Confluence proprietary Climate VaR methodology, analysis was undertaken on an example investment portfolio using the Confluence Revolution ESG solution.
We set out to identify a portfolio’s exposure to physical and transition risks against a range of severity scenarios and forecast projections, cumulating in the total climate adjusted market risk. All calculations were undertaken concurrently, providing a summary of all VaR insights in the report below.
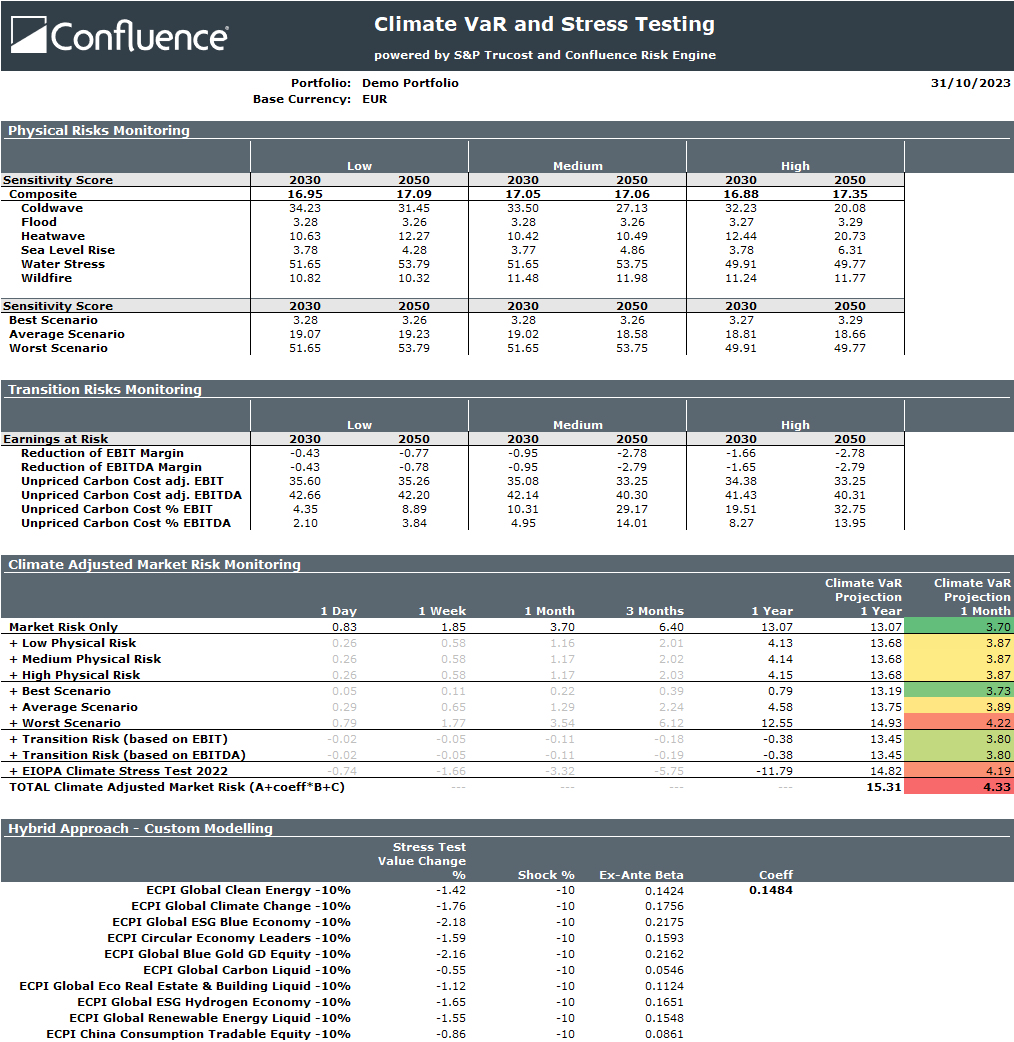
Figure 1: Climate VaR and Stress Testing report, Confluence Revolution ESG
Interpreting the Data
Physical risk monitoring
The financial risks posed by climate change are gaining increased attention in regions across the globe. Monetary compensation for weather-related disasters affecting communities and infrastructure is becoming increasingly prevalent, and costs are increasing. In July 2023, the European Parliament outlined in their Compensation for Victims of Climate Change Disasters Report “economic losses related to weather and climate change related events have amounted on average to over EUR 12 billion/year in the 32 EEA member countries”. The National Centers for Environmental Information in their Billion-Dollar Weather and Climate Disasters report state the US “has sustained 373 weather and climate disasters since 1980 where overall damages/costs reached or exceeded $1 billion (including CPI adjustment to 2023). The total cost of these 373 events exceeds $2.645 trillion”.
In the portfolio we modelled, physical risks were measured against coldwave, flood, heatwave, sea level rise, water stress and wildfire risk hazards, against a range of severity scenarios (low, medium and high) and across two future trajectory paths towards 2030 and 2050. The measures are identified as:
- High climate change scenario (RCP 8.5) indicating the continuation of business as usual with corporate emissions at current rates. This scenario is expected to result in warming > 4°C by 2100
- Medium climate change scenario (RCP 4.5) indicating strong mitigation actions operated by companies aimed at reducing emissions to half of current levels by 2080. This scenario is more likely than not to result in warming > 2°C by 2100
- Low climate change scenario (RCP 2.6) implies aggressive mitigation actions to halve emissions by 2050. This scenario is likely to result in warming of < 2°C by 2100.
The higher the value, the higher the climate risk exposure to climate events. A score up to 30 indicates low physical risk exposure, 30-70 indicates moderate risk exposure and 70+ reflects high exposure. This applies to the composite score, sensitivity weight-adjusted scores and the underlying individual hazard-level scores.
For this model portfolio, a composite score of around 17 indicates overall a low exposure to physical risk. Although the geo-localization of its investments highlights high sensitivity to coldwave (scores up to 34.23) and water stress (scores up to 53.79).
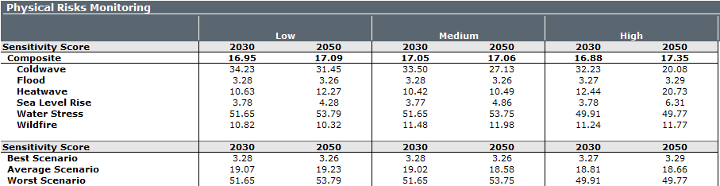
Figure 2: Physical Risks Monitoring analysis, Confluence Revolution ESG
Transition risk monitoring
Companies need to assess their transition risks impacted by policy and legal risks, technological, market and reputational risks arising from the transition to low carbon, climate-resilient economies. Generally, above 10% carbon earning risk (EBIT or EBITDA based) is the significant threshold where clients need to decide on incremental transition risk exposure.
In this model portfolio, the 2030 projection of Unpriced Carbon Cost % significantly increases across all scenarios; low ranges 2.10-4.35, medium ranges 4.95-10.31 and high ranges 8.27-19.51. This indicates the investments held may incur additional costs associated with a carbon price increase. The lower the companies’ engagement in climate-change reduction policies, the higher the exposure to additional unpriced carbon costs, particularly in the medium-long term.
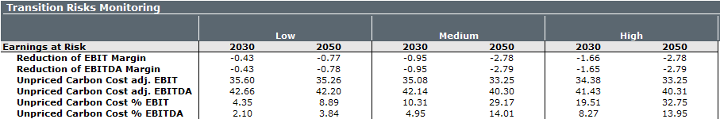
Figure 3: Transition Risks Monitoring analysis, Confluence Revolution ESG
Climate adjusted market risk
Finally, the climate adjusted market risk takes into consideration the combination of market, physical and transition risks across a range of risk horizons and severity scenarios.
In this model portfolio, the analysis indicates a 3.70% potential loss of assets under management, calculated over a 1-month risk horizon and with a 99% confidence level. The market risk is the baseline typically reported to Regulators as part of Ucits/AIFMD or SEC VaR Approach requirements, which establish strict rules and allow the 1-month VaR to be up to 20% of the NAV.

Figure 4: Climate Adjusted Market Risk Monitoring analysis, Confluence Revolution ESG
As we’ve seen above, increasing exposure to climate events poses a higher risk of loss. Taking in consideration the exposure to market risks, and the exposure to physical and transition risks, the total climate adjusted market risk of this portfolio may further increase by 20%, up to 4.33%. This results from conservatively considering the exposure to the worst physical risks, appropriately weighted (we outline how in the next section), and the transition risks based on EBITDA.
The report also indicates the average scenario exposure to physical risks (across any low-medium-high scenario) projects values similar to the pure transition risks alone, 3.89% vs 3.80% respectively. However, factoring in the worst scenario exposure to coldwave and water stress from the previous physical risk analysis (see figure 2), the total projected risk increases to 4.22%.
Hybrid modelling
As the name suggests, hybrid modelling consists of a mix of methods and applications aimed at improving the reactivity to changing market environments.
Data vendors typically capture and recalibrate exposure to both physical and transition risks annually, reflecting the risk projection over a yearly basis. Alignment is required when rescaling their contribution compared to the pure market risks, which are typically reported on daily or monthly horizons.
Also, standard practice when monitoring market risk exposure is to consider the diversification of the investments. When monitoring risk associated to equity, credit or interest movements, the overall concentration of the portfolio investments plays an important role, as risks are not fully additive.
Similarly, the geographical concentration of investments needs to be taken into consideration when estimating Climate VaR. Adjusting the exposure to climate hazards needs to take into consideration the potential correlation or decorrelation associated to the geographical concentration of investments, commonly the physical risks. In this context, Confluence developed a hybrid approach aimed at modelling risks by adjusting them according to the outcome of specific stress tests analysis.
For this model portfolio, an estimate of decorrelation was undertaken as part of the standard market risk exposure analysis. Predictive stress tests were applied to estimate the ex-ante beta of the regression model, to capture the relationship between portfolio investments and a range of ESG indices and strategies. See further details on this framework here.
In our model portfolio, the exposure to climate hazards is well diversified, with an average beta coefficient of 0.1484, representing 14.84%. The total climate adjusted market risk can be then adjusted, by not using the totality of the physical risks scoring and only leveraging the 14.84% average. The final result is a total climate adjusted market risk score of 4.33% (see figure 2). If the beta values had scored higher, physical risks would have weighted more in the analysis, resulting in higher climate VaR figures and thus higher portfolio risks.
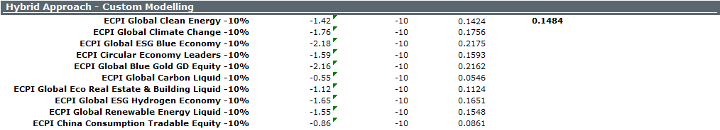
Figure 5: Hybrid Approach – Custom Modelling analysis, Confluence Revolution ESG
Summarising the insights
The quantitative modelling example demonstrated deep insights into how climate change may impact investments evaluation for this model portfolio. Market risk analysis captures only a portion of the financial risk exposure, highlighting a potential loss of 3.70% over 1 month horizon. The additional consideration of climate related hazards associated with both physical and transition risks increased the potential risk to 4.33%. The lower carbon reduction strategies of the investments contributed to this figure, reinforcing the need for companies to effectively manage the growing array of climate-induced vulnerabilities.
Whilst Value at Risk (VaR) estimates are valuable tools for portfolio managers and investors to assess potential market-related impacts on their holdings, a globally standardised method for monitoring climate risks is currently not available. VaR estimates may result in significant write-downs in the value of financial assets. Recognizing this gap, Climate VaR has emerged as an additional metric to project potential financial losses for companies and asset portfolios, stemming from climate change.
Getting ready for your UK ESG disclosures
Despite global regulators being well-equipped to monitor traditional financial risks, the absence of established standards for climate risk monitoring poses a challenge. Identifying portfolio exposure to climate risks is crucial in capturing new opportunities to protect portfolio investments and optimising overall performance, whilst aligning with sustainable goals.
Working with a specialised ESG reporting technology and risk modelling vendor, firms can simplify their ESG disclosure processes, integrating the latest data sets and complex modelling including in-depth Climate VaR, through templated reports, to meet their ever-evolving regulatory requirements. As the global focus on investments continues to shift due to climate change impacts, safeguarding financial portfolios and mitigating investor exposure is paramount.