The COVID-19 pandemic has already had far-reaching consequences beyond the spread of the disease, such as plummeting oil prices, stock and bond market volatility and a lack of global liquidity. With a crisis of this scale, it is not unusual to go back and start looking at what happened during similar events in the past.
It might be tempting to compare the coronavirus outbreak to the SARS epidemic of 2002-2003, but the global macroeconomics and factors fueling the major economies worldwide have significantly changed over the latest 20 years, particularly since the global financial crisis in 2008. As such, more recent disruptive events may make for better comparisons.
2014 Outbreak in Middle East
 In 2012, an outbreak of Middle East respiratory syndrome coronavirus (MERS-CoV) affected several countries, mainly in the Middle East. The virus, which causes what is now called Middle East respiratory syndrome, is a beta-coronavirus that was first identified in a patient from Saudi Arabia in April 2012. Sporadic cases, small clusters and large outbreaks were reported in 24 countries globally from later in 2014 up to the middle of 2015, but no severe financial impacts were recorded.
2015 Outbreak in Far East, South Korea
Another outbreak of MERS-CoV occurred in South Korea between May to July 2015. This time, however, the financial effects were more apparent. On June 11, 2015, South Korea’s Central Bank cut interest rates by 0.25% to stem the economic fallout from the outbreak. The global equity market suffered mainly in the Energy, Materials, Utilities and Consumers sectors.
2009 Global Equity Markets Crisis
The collapse of the U.S. housing bubble, which peaked in 2006, caused huge drops in the values of securities, stressing the global financial markets beyond recognition. Bank solvency, investor confidence and credit availability all took major hits, resulting in global stock markets plummeting during 2008 and early 2009. By March 6, 2009 the Dow Jones Industrial Average (DJIA) had dropped 54% to 6,469 from its peak of 14,164 on October 9, 2007 – all in a span of 17 months.
2015 China Equity Markets Crisis
The Chinese stock market turbulence began with the popping of the stock market bubble in June 2015 and ended in early February 2016. A third of the value of A-shares on the Shanghai Stock Exchange was lost within one month of the event. Major aftershocks occurred on August 24, 2015 similar to “Black Monday”, March 9 of 2020 in the U.S. After falling more than 30% in three weeks, 1,400 companies filed for a trading halt to prevent further losses, but the Shanghai stock market had fallen again by 8.5%, marking the largest fall since 2007.
To gain a better understanding of what we have been observing in the markets recently, StatPro Revolution allows us to look also at a synthetic multi-factor scenario reflecting increasingly heavy, severe, extreme market conditions i.e. shocking the stock markets down 15-20-25%, interest rates up 50-100 bps, credit spreads up 75-100-150 bps, finally simulating a positive correlation among fixed income and equity prices all at once. The combination of these shocks simultaneously will likely impact both long equity and fixed income portfolios.
| Scenario | World Equities (USD) | Global Bonds (USD) | EMU Bonds (EUR) |
| Extremely Negative Scenario | -23.94 | -11.3 | -14.35 |
| Heavily Negative Scenario | -20.276 | -15.42 | -12.77 |
| 2009 Global Equity Market Crisis | -19.69 | -4.21 | 1.53 |
| Severly Negative Scenario | -16.21 | -14.99 | -11.13 |
| 2015 China Equity Markets | -4.38 | -0.09 | -0.99 |
The above table looks at three portfolios aiming to reflect the end of February 2020 composition of three out of the major indices globally: one capturing large and mid-caps across the developed markets, one looking at the global bonds and, finally, one looking at the EMU government bonds. It shows the losses that the portfolio constituencies may have potentially recorded in the presence of extreme shocks like the ones described above. We must look at synthetic scenarios to start observing severe impacts across both the equity and the bond markets, with equities dropping in the range of 16-24% and both bond indices dropping in the range of 11-15%. Looking back to the past, there has never been such a vast crisis across multiple asset classes.
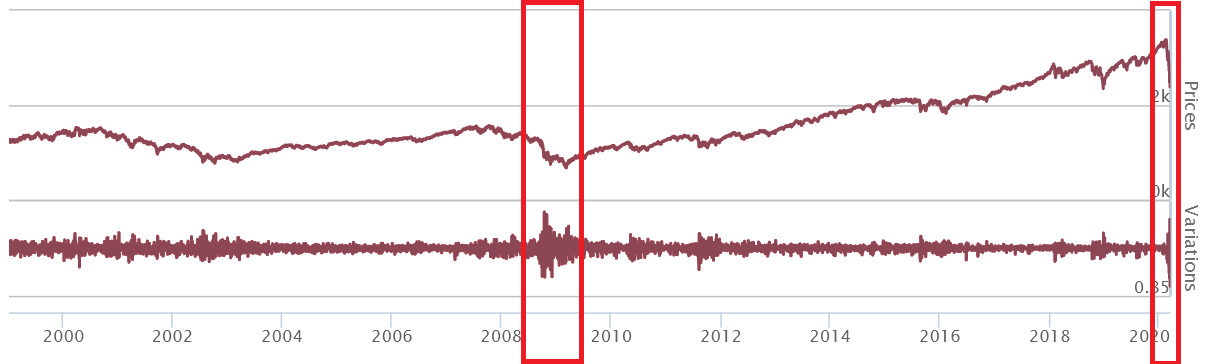
Also taking into consideration the S&P 500 index values publicly available, we can observe how last week this started recording more volatility than the 2009 global equity market crisis. Even so, the crisis is not over yet as we can see in the chart below.
Predictive Scenarios
One of the main challenges for an asset manager, particularly regarding their risk function, is to know how their portfolios are affected by significant market movements, like the ones being observed now. In order to achieve this goal, it is necessary to define the parameters of stress tests in which a market index is shocked, and then how this shock is propagated to all the other risk drivers.
Even though traditionally the Ordinary Least Squares (OLS) approach has been used to model the correlation structure behind such stress tests, StatPro Revolution proposes a more modern and dynamic approach based on State-Space models. Specifically, we focus on the implementation of a daily running Kalman Filter algorithm that guarantees good results with a very low computing effort, even in an abnormal market situation like the present.
In this context, looking at an Emerging Markets index may be a good starting point since these usually consist of one third China assets and is able to provide the most comprehensive results when aiming to analyse the global impacts of COVID-19. Additionally, the Hang Seng index is also able to provide more isolated impact by taking out noise from other markets.
Considering the markets’ fall, registered in the week March 9-16, 2020, StatPro Revolution shows interesting results when analyzing the impacts of different equity indices as well as S&P 500 and FTSE MIB dropping 10% in combination with the doubling of the VIX.
| Scenario | World Equities (USD) | Global Bonds (USD) | EMU Bonds (EUR) |
| Emerging Markets Equities -40% | -33.69 | 11.12 | 2.87 |
| VIX +100% | -14.80 | 0.96 | -0.30 |
| World Equities -10% | -9.93 | 1.40 | -0.83 |
| Hang Seng -10% | -8.15 | 1.08 | -0.23 |
| S&P 500 -10% | -7.27 | 1.13 | 0.59 |
| Europe Equities -10% | -7.27 | 0.99 | 0.03 |
| FTSE MIB -10% | -3.33 | 1.22 | -0.16 |
While the global bond portfolio appears to have an inverse relationship with the drop in the equity markets, the EMU bond portfolio results more sensitive (positively correlated) to the movements of both the VIX and FTSE MIB indices – the reason being that more than 20% of this portfolios is composed of Italian government bonds. In a market driven by uncertainty about inflation, real interest rates and dividend yields, as with Italy, can surely record a positive correlation between bond yields and stock returns.
The jump in COVID-19 cases in Italy is certainly prompting an additional risk-off run in markets where the flight to safety is seeing the BTP/Bund spreads widening even further. COVID-19’s effects are not yet over but have started severely shifting the expected distributions of single securities, as well as portfolios.
Liquidity Risk
Significant sell-offs in markets like the ones experienced in the week of March 9-12, 2020, risk amplifying the initial shock through a self-feeding, never-ending spiral.
In this context, it is important to remember that large numbers of U.S. investment grade corporate bonds are now facing a considerably higher risk of downgrade, given the inevitable global economic slowdown caused by COVID-19. The greater the movement down to junk status, the higher the risk of a waterfall of funding dislocations that make everything worse, financially and economically.
Bid/ask spreads usually capture such movements. In fact, especially for fixed income securities, transaction costs are implicit in bid/ask spreads quoted by intermediaries. Low liquidity in the fixed income markets usually implies wide bid/ask spreads. In a situation with neutral investor activity, i.e. without significant net inflows or outflows, funds usually value their assets using market mid-prices. However, in a situation where there is a significant amount of net subscriptions or redemptions like the one we’ve been experiencing around COVID-19, switching valuation pricing to ask prices (with net inflows) or bid prices (with net outflows) would allow the incorporation of the effect of transaction costs into the NAV calculation, where the fund will be impacted when investing or disinvesting due to wider investor activity.
The Revolution liquidity risk model is indeed recording an increase in bid/ask spreads across the fixed income markets with an average increase of 5% in the cost of liquidation within the U.S. market. The result is suggesting a general deterioration in credit quality, at a time of ever-lower interest rates, for several segments of the US corporate bond market, finally amplifying even more private-equity transactions.
As investors hunt for decent returns following almost a decade of low interest rates, portfolio managers are called to look at the liquidity of the higher-yielding assets, but the increasing fear around the current market conditions is certainly raising concern around possible redemptions, and the fast decreasing resilience of the funds. As Mark Haefele from UBS Global Wealth Management states: “One of the risks in turbulent market conditions is being forced to sell assets to meet liquidity needs”.
Conclusion
In the last few weeks, we have seen disruption to the global financial markets from an external biological source leading to the most extreme market behavior since the global financial crisis. Now, investors, firms, central banks and governments must navigate the effects of the coronavirus spreading across both the financial markets and the world more broadly.
Unsurprisingly, panic and fear are driving the behavior of market participants and nations: in the short term, the markets will most likely continue to experience large volatility spikes, and it is in such times that it is best to use scenarios that are less exposed to risk.
Asset, risk, and compliance managers have a difficult road ahead. As such, Revolution is now supporting, and will continue promoting, new and modern predictive, historical and liquidity stress scenarios to complement the standard Value at Risk analysis which is prone to suffer from the current volatility the most.
{{cta(’27c0b3cd-43a6-4b34-9d44-ec844c91d1cf’)}}