Report
August 2023
Factor Performance Analysis
US Quality-Growth public equity outperforms Value in Developed Markets
by:
Market Background
Although each country and region has varying levels of inflation, the impact of rapidly increased rates by central banks has been impacting their respective economies in the form of disinflation. Most regions realized a significant downturn in price increases over the last year and saw a pause in July, although still at values much higher than their central bank’s target rates as of July.
Crude oil prices hit their 2022 highs again at $80/barrel opposed to $70/barrel seen on average in 2023, but natural gas prices have remained steady at roughly $2.6/MMBtu opposed to $7/MMBtu as seen in late 2022.
Factor Summary
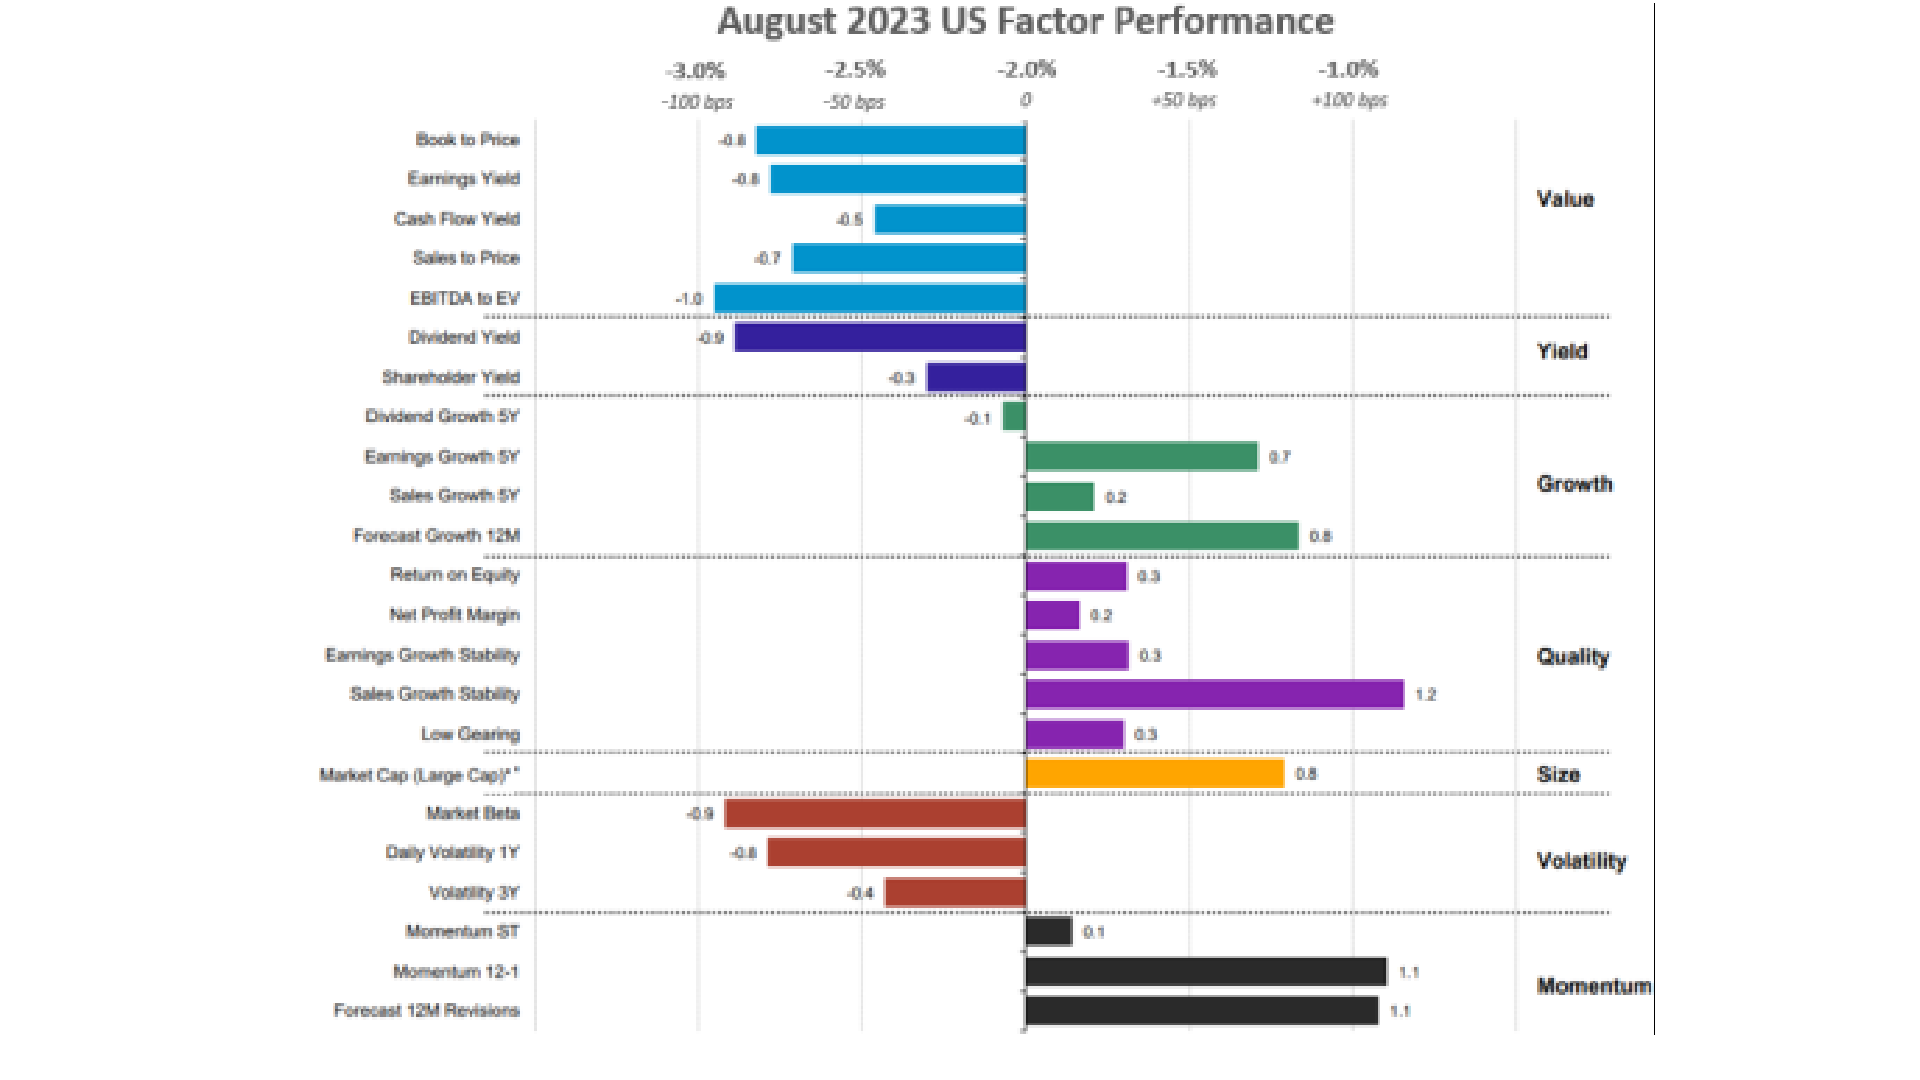
- US Equities: Large Cap, Quality and Growth stocks outperformed.
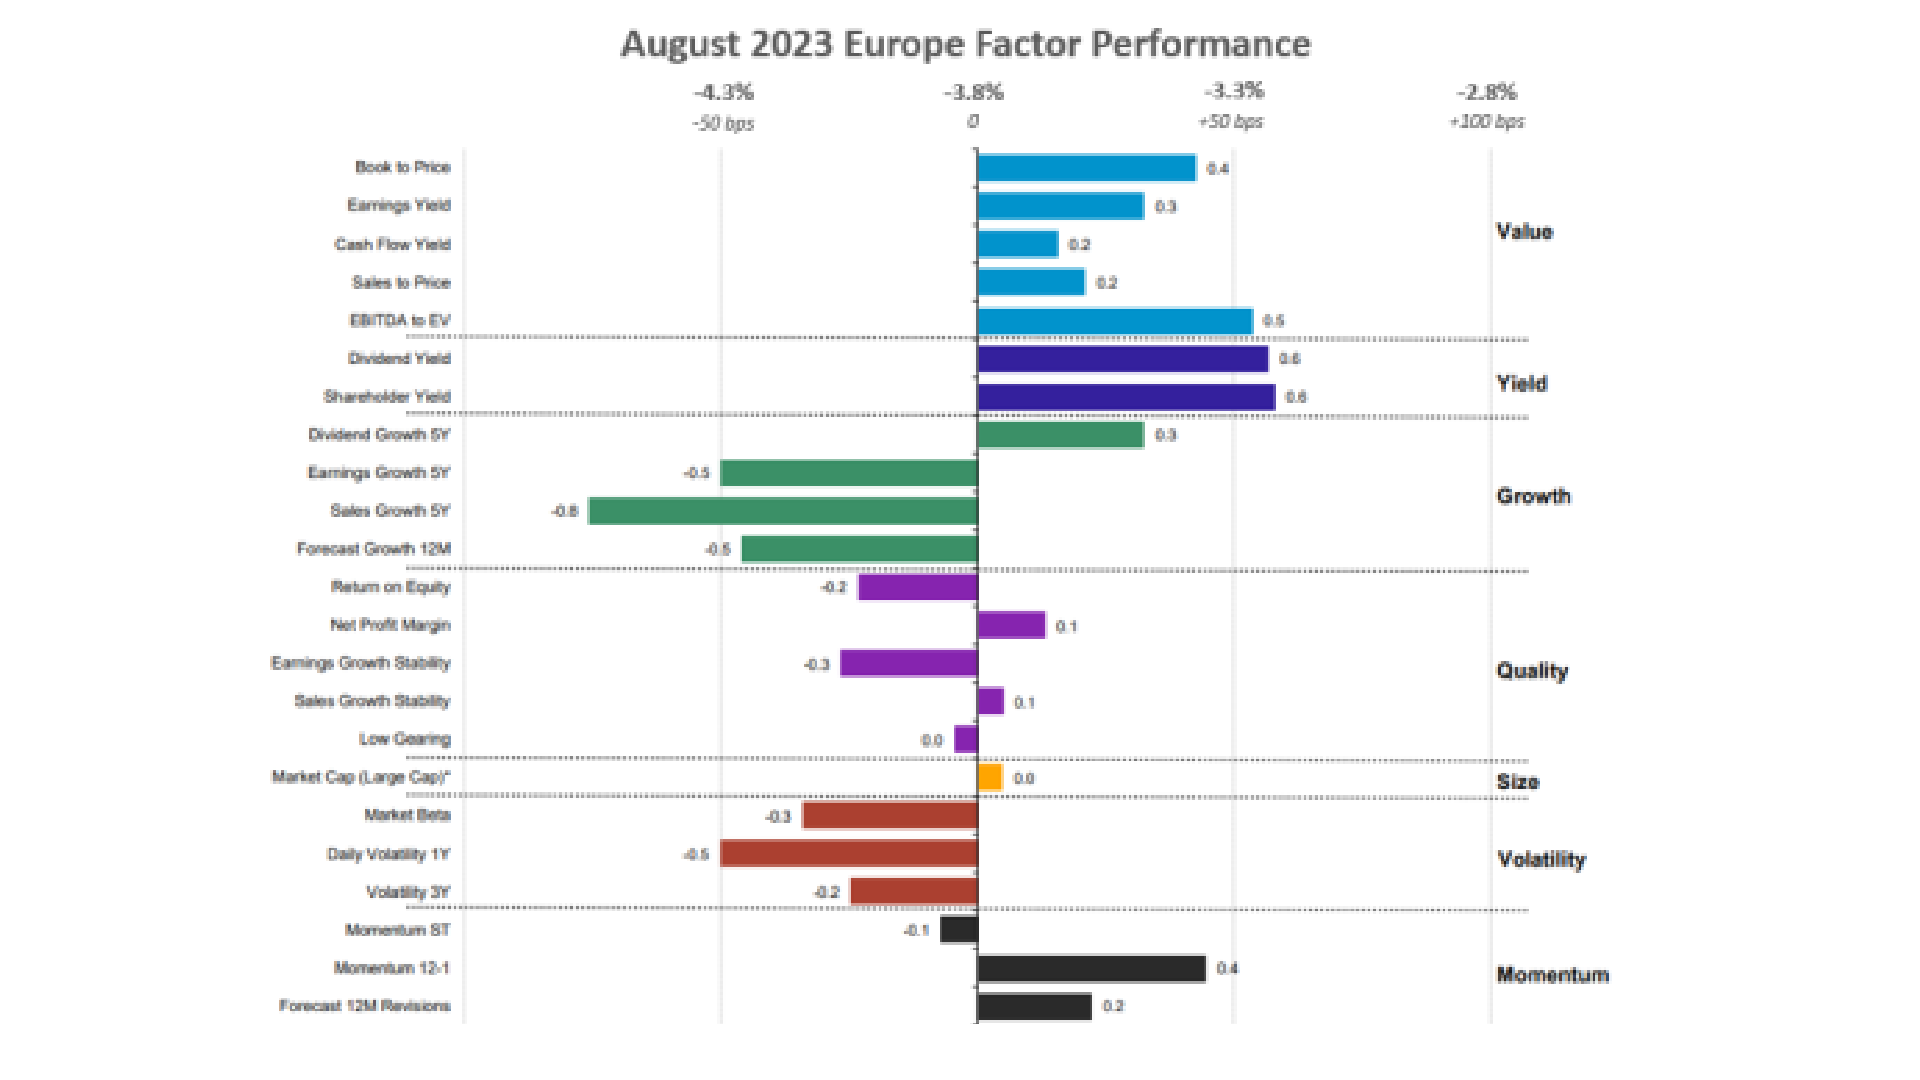
- Europe: Defensive factors such as Value and Yield outperformed.
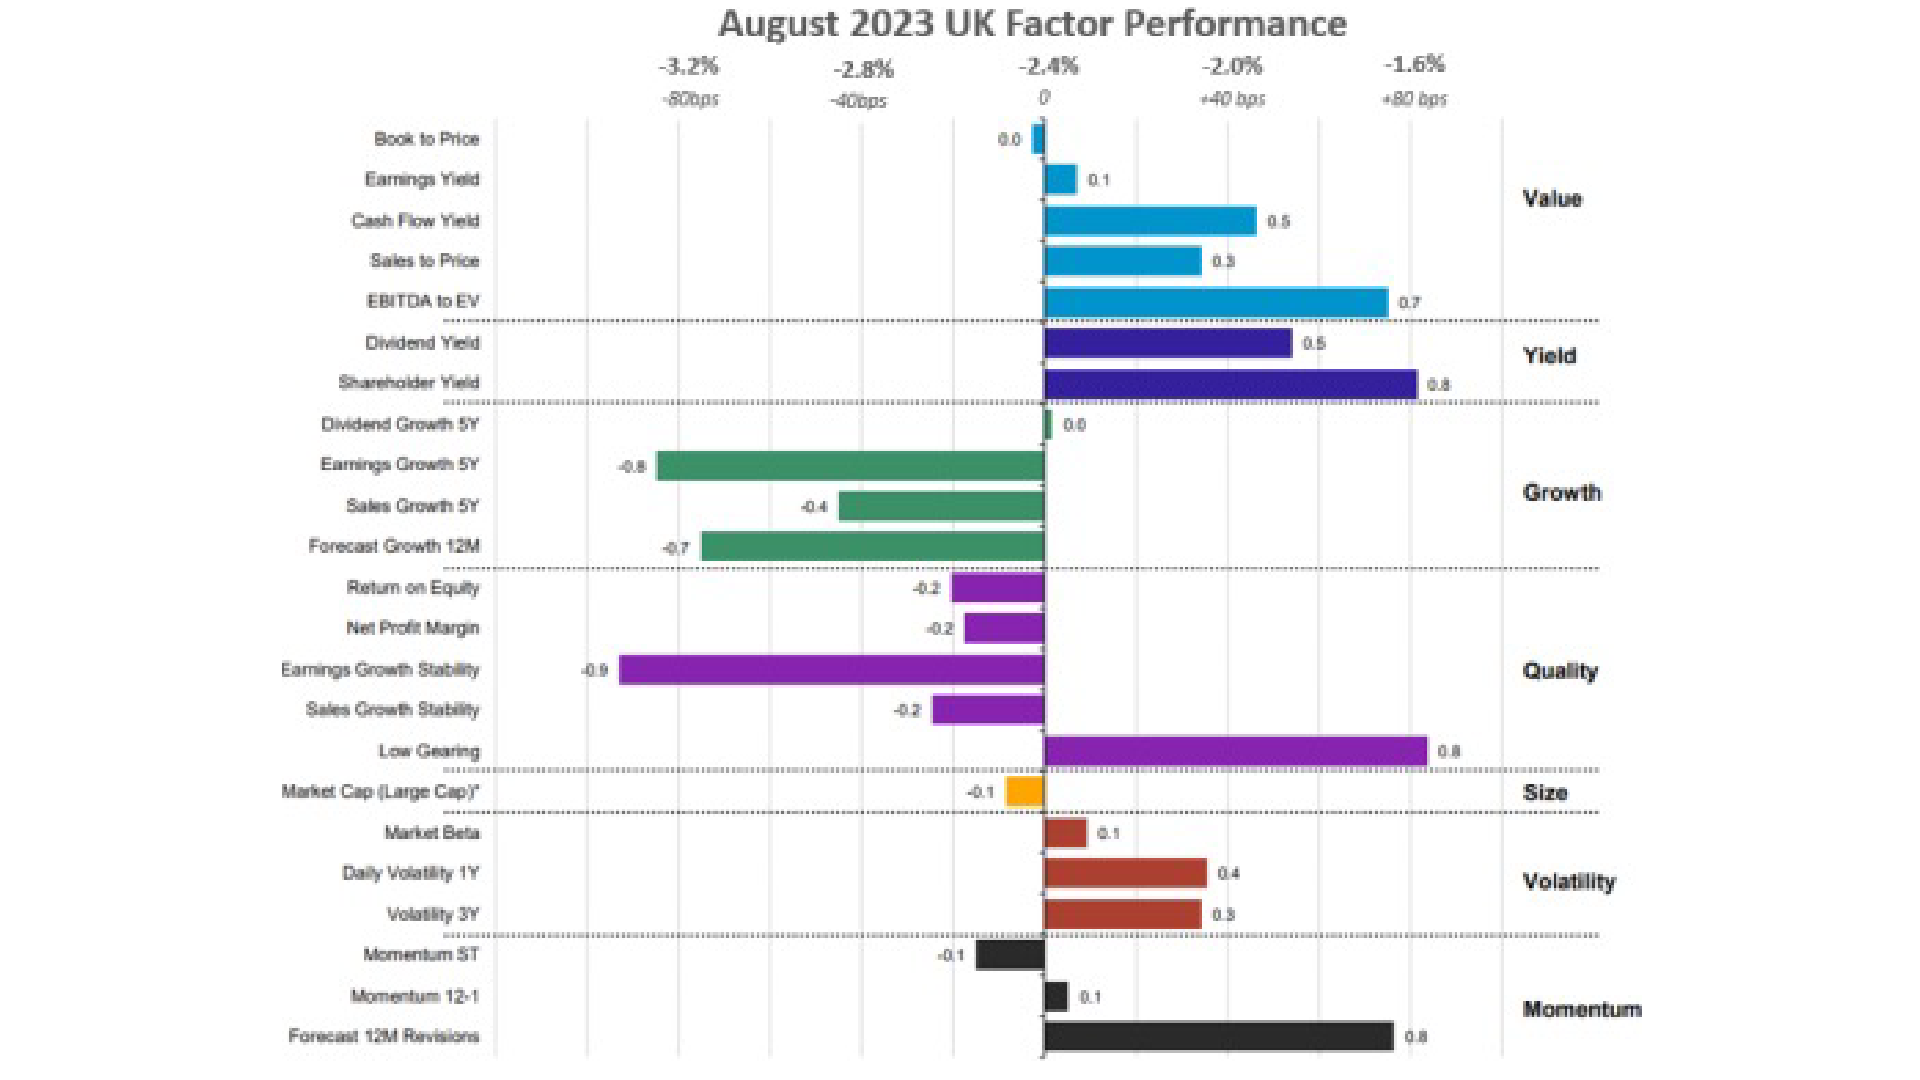
- UK: Similar to Europe, Value and Yield outperformed while Growth underperformed.
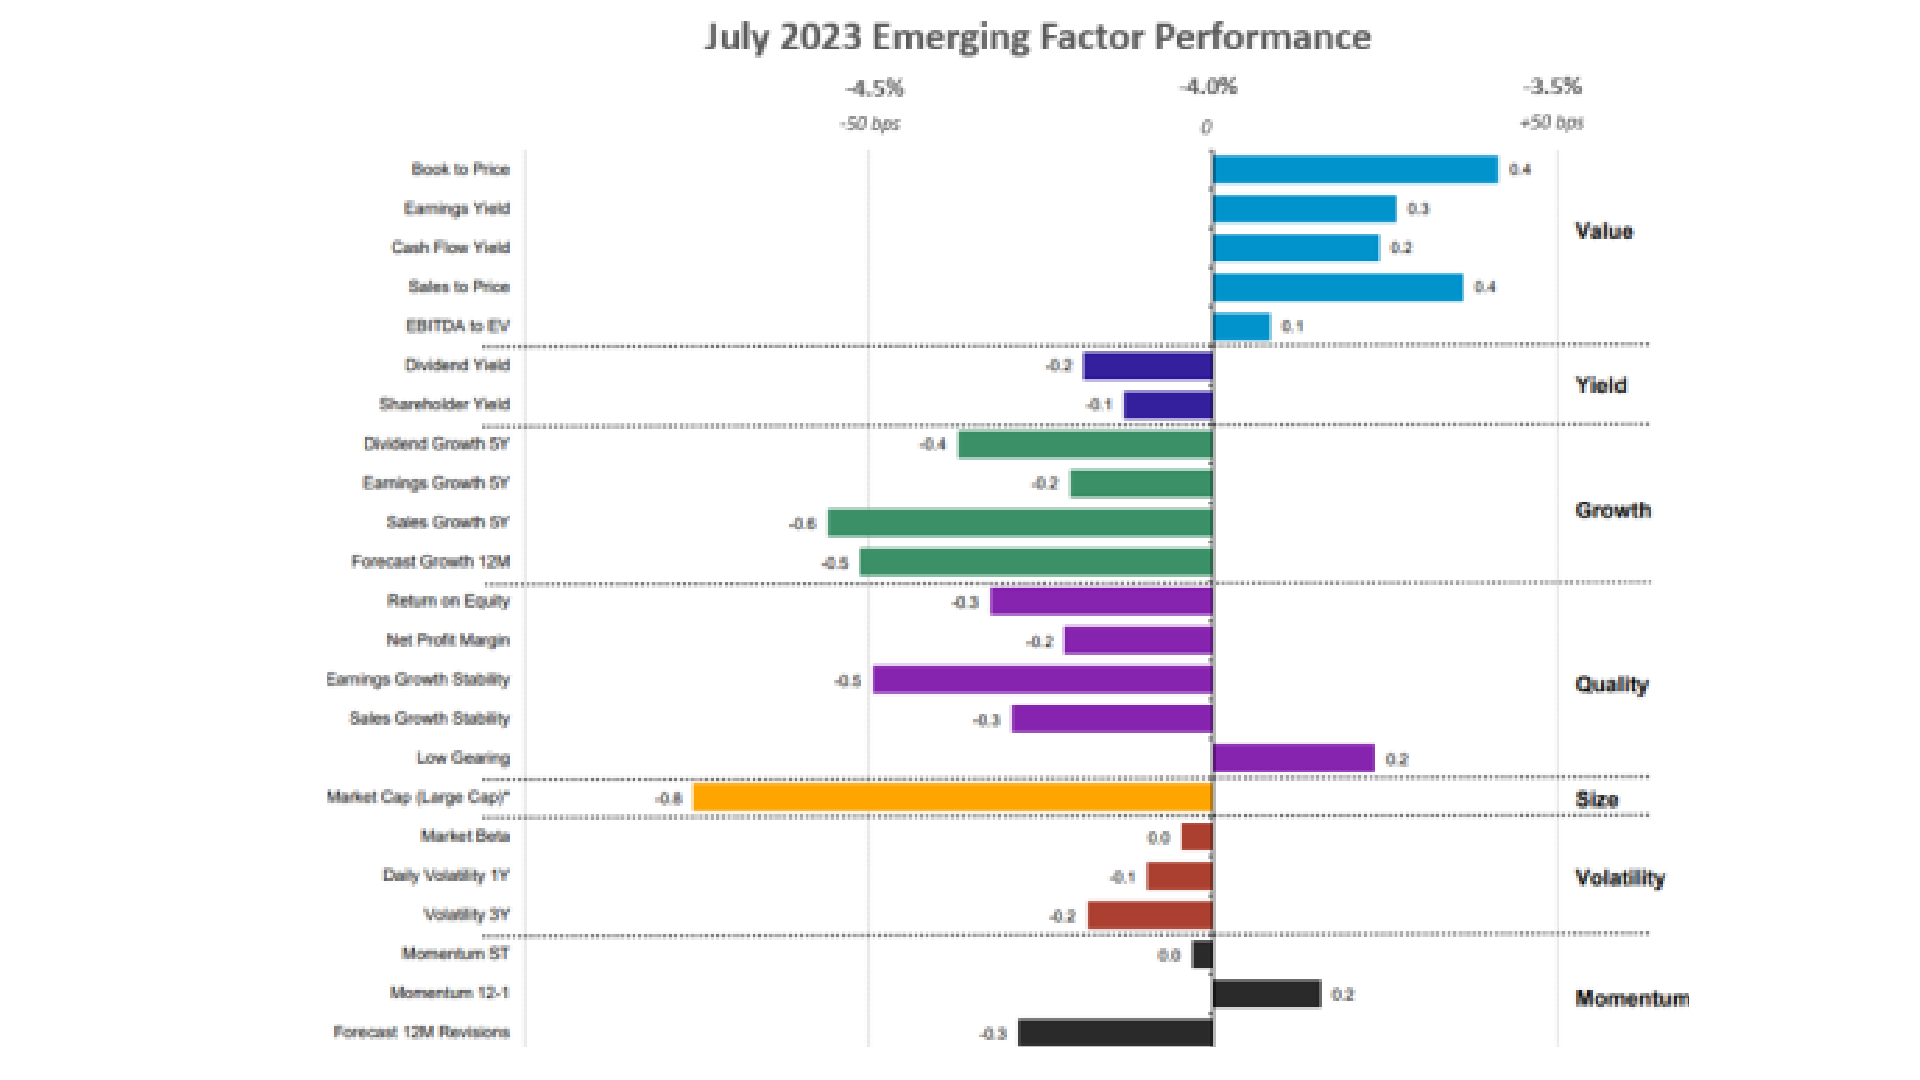
- Emerging Markets: Value outperformed.
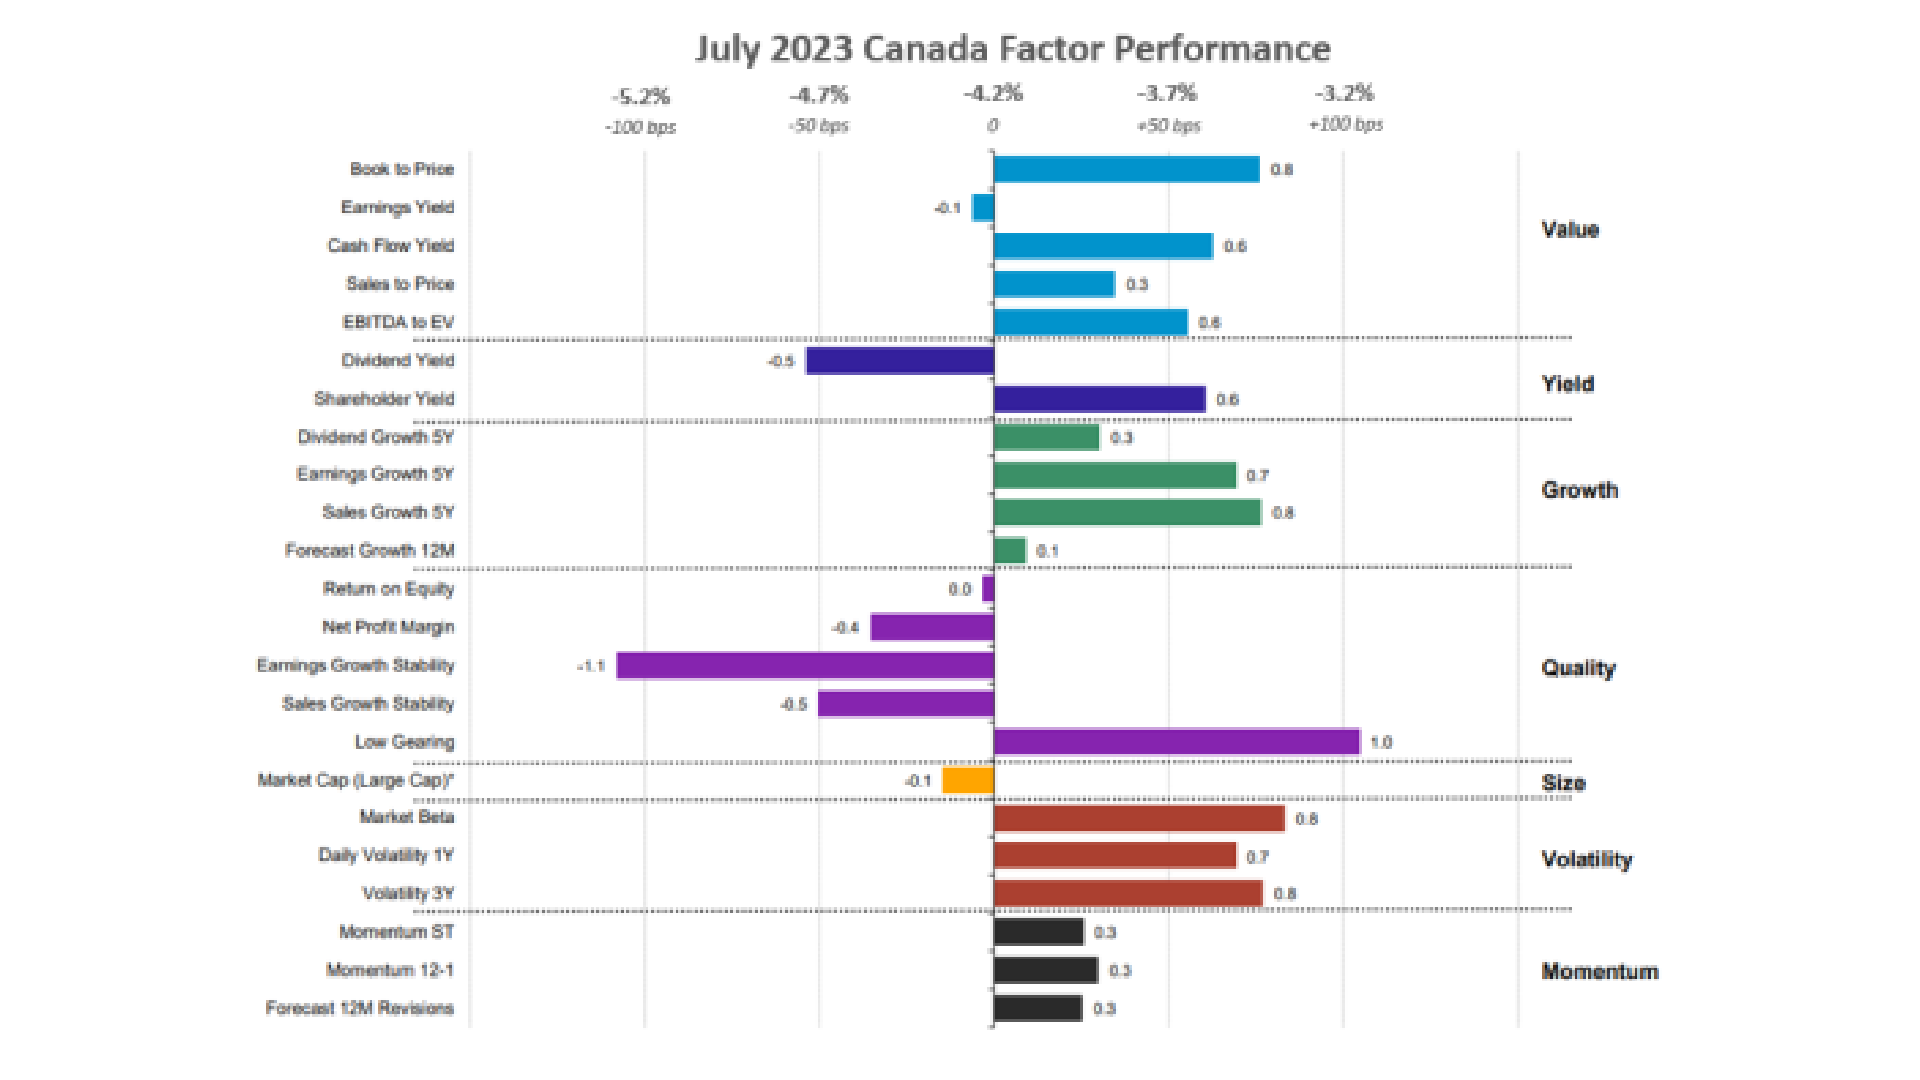
- Canada: Value and Volatility continue to outperform, but Quality (low gearing) offered 100bps of outperformance.
US Equities
After a brief period of outperformance for high-beta and Value equities, the factor performance trend in the U.S. shifted back to favoring Growth stocks, although to a different extent than earlier this year. Volatility has outperformed many times throughout 2023 especially in tandem with Growth companies, but this month it was outperformed by stocks with high Quality as defined by sales growth stability, return on equity, and earnings growth stability. Investors preferred stable growth stocks at the end of the summer, a stark difference to the emphasis seen in Volatility and high-beta stocks. The Russell 2000 also erased the gains previously observed in July, amounting to a -6% downturn YTD.
August’s US CPI data confirmed non-core inflation increased to 3.7% after hitting a low of 3% in June. Non-core inflation consistently declined for nearly a full year up until July, falling as much as 100 bps per month in May and June. However, this metric was largely influenced by falling energy prices, a trend that continued into August but failed to lower overall CPI as the YoY rate increased from 3.2% to 3.7%. This month, the increase can be attributed to significant upticks in transportation services (10.3%) and shelter prices (7.2%), followed by increased costs for food, particularly limited service meals and snacks (6.7%).
Although CPI increased, core inflation continued its disinflationary trend observed since March 2023, which has now fallen from 5.6% to 4.3%. Stripping away food and energy’s volatility shows that US inflation has decreased at the same rate observed in Q4 2022, when core inflation fell by 30bps per month before losing its disinflationary momentum in Q1 of this year.
The ADP National Employment Report, measuring levels of non-farm private employment, indicated the labor market in the US has slightly cooled down from the highs seen in Q2 of this year while non-farm payrolls increased.
Within Quality, US investors focused on the sales growth stability subfactor which outperformed the other Quality metrics by over 100bps thanks to stocks like Eli Lilly (+22%) and Cisco Systems (+10%), and Amgen Inc. (+10%).
Source: Investment Metrics, a Confluence company
European Equities
European equities underperformed the UK in August, cancelling out the gain realized in July. Value stocks are still a large focus for European investors this summer, although the emphasis on high-beta has been replaced by dividend yield and shareholder yield, shifting the European trend to a defensive stance as seen in late 2022.
Growth stocks’ performance declined from July to August. The focus on forecasted growth and volatility seen throughout the first two quarters of the year has been replaced by an emphasis on dividend growth, which can be seen as a Yield subfactor opposed to Growth.
Inflation remained steady in August, maintaining the same YoY price increase as seen last month at 5.3%. This is still over twice what the ESB’s target rate is, and 20 bps above what the market consensus was for August.
German manufacturing slightly increased in August but has fallen significantly since the onset of 2023. Although factory orders for the aerospace industry increased by 7% in June, orders fell by 11% across multiple industries, which was much lower than previous expectations.
Notable out-performers in this market environment include Value stocks like German construction company Hochtief AG (+10%); French food services company Sodexo (+9%); and German insurer Talanx AG (+11%).
Source: Investment Metrics, a Confluence company
UK Equities
Not only did the UK realize a positive return in July, but the region also outperformed Europe this month. This could be attributed to the fact that the factor trend has favored Value and Yield stocks over Growth stocks, the latter of which underperformed both in Europe and the UK while defensive subfactors offered factor premiums.
As seen in Germany, manufacturing has also steadily declined in the UK as the S&P PMI continued falling to levels not seen since the pandemic, indicating trouble in industrial operations. The GfK Consumer confidence indicator in the UK continued its climb from Q1 and Q2 after a pause in July as inflation also declined to 6.8% from nearly 8% last month, and over 10% in January.
Stocks with a high EBITDA-to-EV ratio outperformed the market by 70 bps, as well as those with a high shareholder yield. Although Volatility was still a focus for British investors, companies which manage their debt levels effectively also offered sizable returns, outperforming by 80bps.
British firms that have managed their debt well and provided outsized returns this month include Admiral Group PLC (+15%); Medical devices company Convatec Group (+10%); and marketing agency IWG PLC (+15%).
Source: Investment Metrics, a Confluence company
Emerging Markets Equities
In Emerging Markets, the August trend unveiled the core focus on Value in this region. Value stocks in Emerging Markets have offered premiums each month this year. Unlike before, Value is the only factor to offer premiums this month except for Low Gearing, indicating the Value stocks selected may also manage their debt effectively in a higher interest rate period.
Alongside Value, Large Cap stocks also underperformed significantly while Growth and Quality underperformed by 30-50bps on average.
Chinese and Russian stocks with a strong book to price value led the way this month, including Russian aircraft manufacturer NP Korporatsiya Irkut PAO (+55%), Chinese Telecom firm China Mobile Limited (+6%), and Multiply Group PLSC
Source: Investment Metrics, a Confluence company
Canadian Equities
Canadian inflation mirrors the US as both regions saw significant disinflation up to July, when the YoY inflation rate increased above 3%, back to the threshold observed in May at 3.3%. However, the latest CPI data on September 19th will offer more insight into the disinflationary trend in Canada.
Unlike Europe and the UK, Canadian investors avoided stocks with just a high dividend yield but preferred those with a high shareholder yield as well, a more holistic Yield subfactor which includes metrics such as net debt paydown and share buybacks as well as dividend yield. Stocks with a favorable low gearing value also outperformed by 100bps this month, the largest premium in the region for August.
Source: Investment Metrics, a Confluence company
Appendix: How to read the charts
Each factor’s performance is based on the relative performance of its top 50% of stocks by market cap, compared to the overall market. The Size factor uses the top 70% of stocks, as the only exception.
For example, for the book-to-price factor, we determine the period’s performance of the basket of stocks with the highest book-to-price values, relative to the total market. Each factor is analyzed independently, market and fundamental data are adjusted to enable sector-average (within each country) relative data to be used, and the performance measurement isolates the factor’s contribution to return.
Disclaimer
The information contained in this communication is for informational purposes only. Investment Metrics, a Confluence company, is not providing legal, financial, accounting, compliance or other similar services or advice through this communication. Recipients of this communication are responsible for understanding the regulatory and legal requirements applicable to their business.
About Confluence
Confluence is a leading global technology solutions provider committed to helping the investment management industry solve complex data challenges across the front, middle and back office. From data-driven portfolio analytics to compliance and regulatory solutions, including investment insights and research, Confluence invests in the latest technology to meet the evolving needs of asset managers, asset owners, asset services and asset allocators to provide best-of-breed solutions that deliver maximum scalability, speed and flexibility, while reducing risk and increasing efficiency. Headquartered in Pittsburgh, PA, with 900+ employees in 15 offices spanning across the United Kingdom, Europe, North America, South Africa and Australia, Confluence services over 1,000 clients in more than 40 countries.
For more information, visit www.confluence.com
