April 2024
Factor Performance Analysis
Value Outperforms
by:
Market Background
Large-cap stocks outperformed in the United States and Europe. With the exception of Emerging Markets, stocks that previously outperformed across global equities underperformed their respective markets.
Following the sharp increase in crude oil prices throughout the first quarter of 2024, April saw a slight decrease from $83.17/barrel in March to $81.93/barrel. Gold prices saw a notable increase in April, rising from 2,214.35/ TOz in March to 2,333.55/TOz by April 1st.
Factor Summary

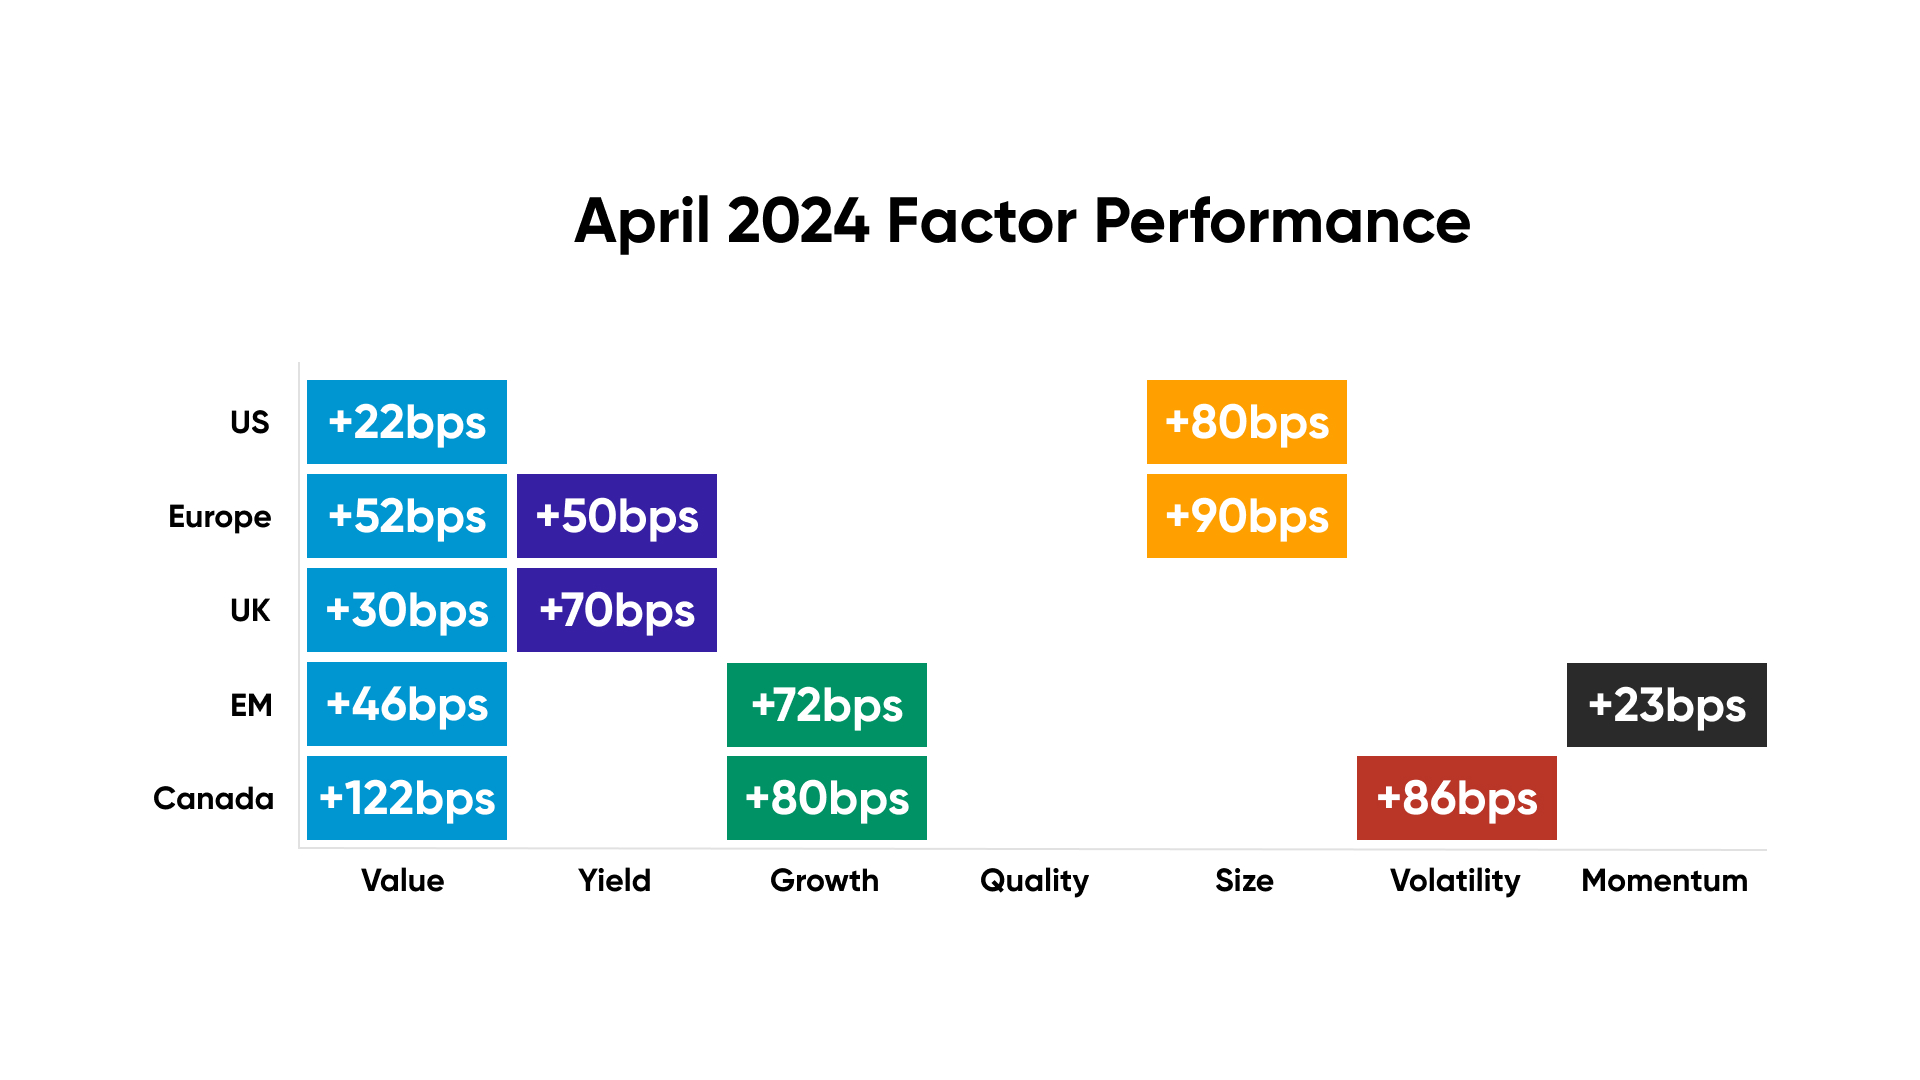
Figures 1: Regional relative factor performance (country and sector adjusted). Average of subfactors’ relative returns.
Source: Investment Metrics, a Confluence company
- US Equities: Value and Size outperformed
- Europe: Value, Yield and Size outperformed
- UK: Value and Yield outperformed
- Emerging Markets: Growth and Value outperformed; Momentum slightly outperformed
- Canada: Value, Growth, and Volatility outperformed
US Equities
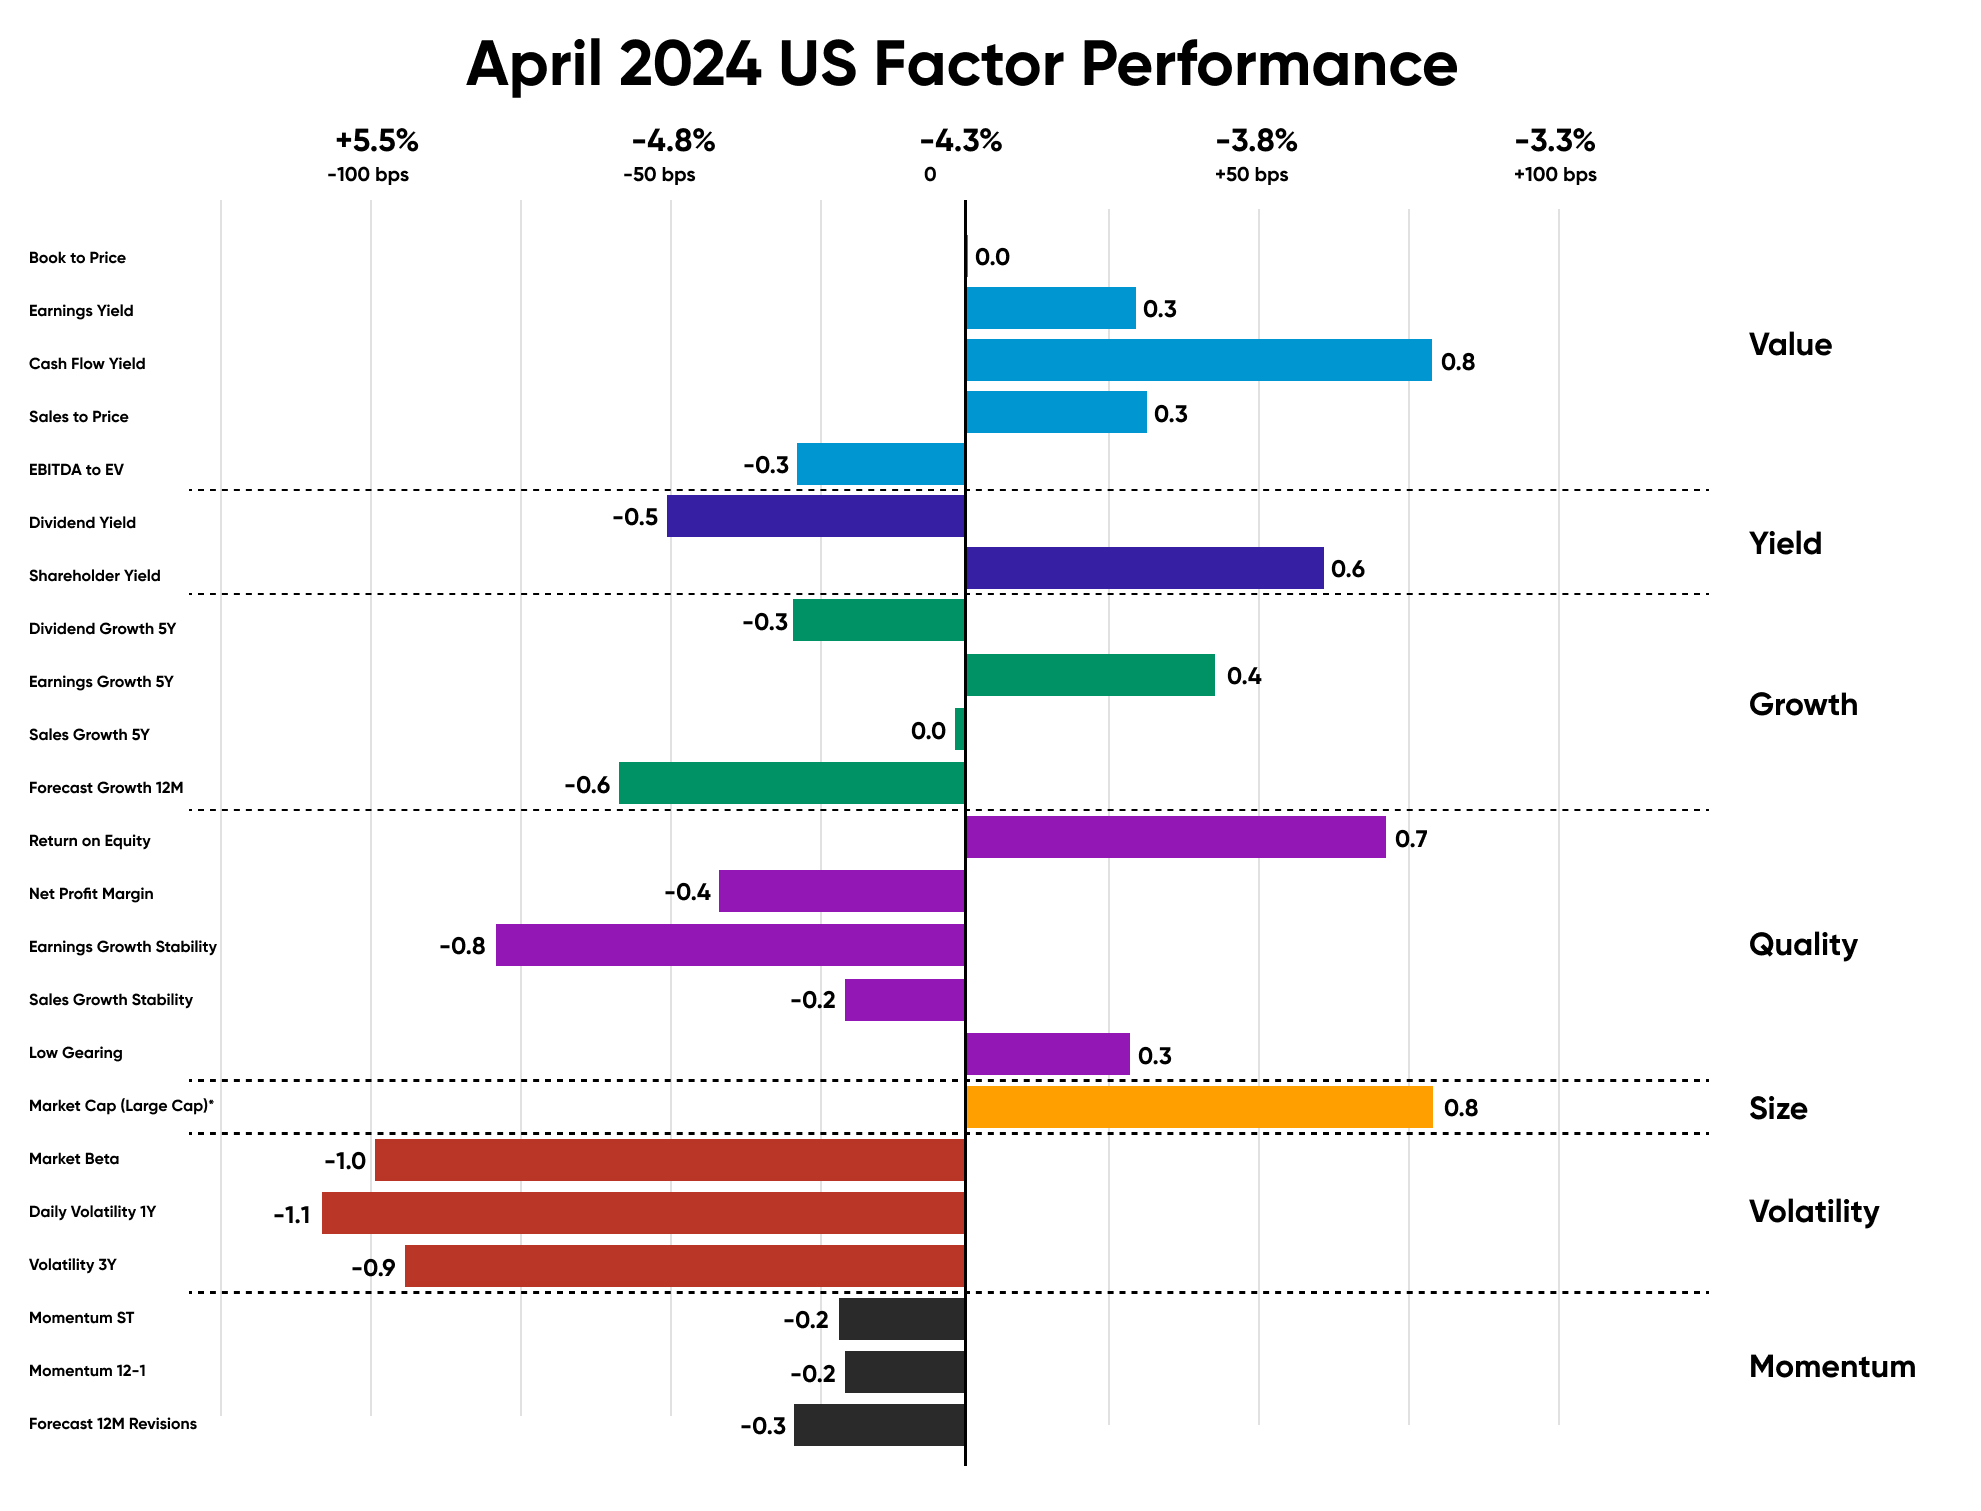
The performance was significantly driven by an outperformance of large cap stocks, while stocks with high Volatility saw a reversal from last month averaging an underperformance of 100bps. Except for high return on equity (ROE) companies, which returned to outperforming by +70 basis points, high-quality companies continued to contribute to the underperformance of the U.S. markets.
Although the US stock market was driven by Large Value companies in April, the Mag7 group still exerted significant influence, contributing to 51% of the index return. Notably, NVIDIA (up 74.5% year-to-date) alone represented 41% of the S&P 500’s year-to-date gain, plus stocks that underperformed in US ROE.
Source: Investment Metrics, a Confluence company.
European Equities
Eurozone inflation remained stable at 2.4% in April, aligning with the estimates. Core inflation, excluding energy, food, alcohol, and tobacco, stood at 2.7%.
Key drivers of outperformance in Europe included a Belgium healthcare company UCB SA and Co (+8.61% in April); Spanish bank Banco Santander (+24.33% in April); and German Industrials company Hapag-Lloyd AG (+22.25% in April).
Figure 3: April 2024 Europe Factor Performance (country and sector adjusted)
Source: Investment Metrics, a Confluence company.
UK Equities
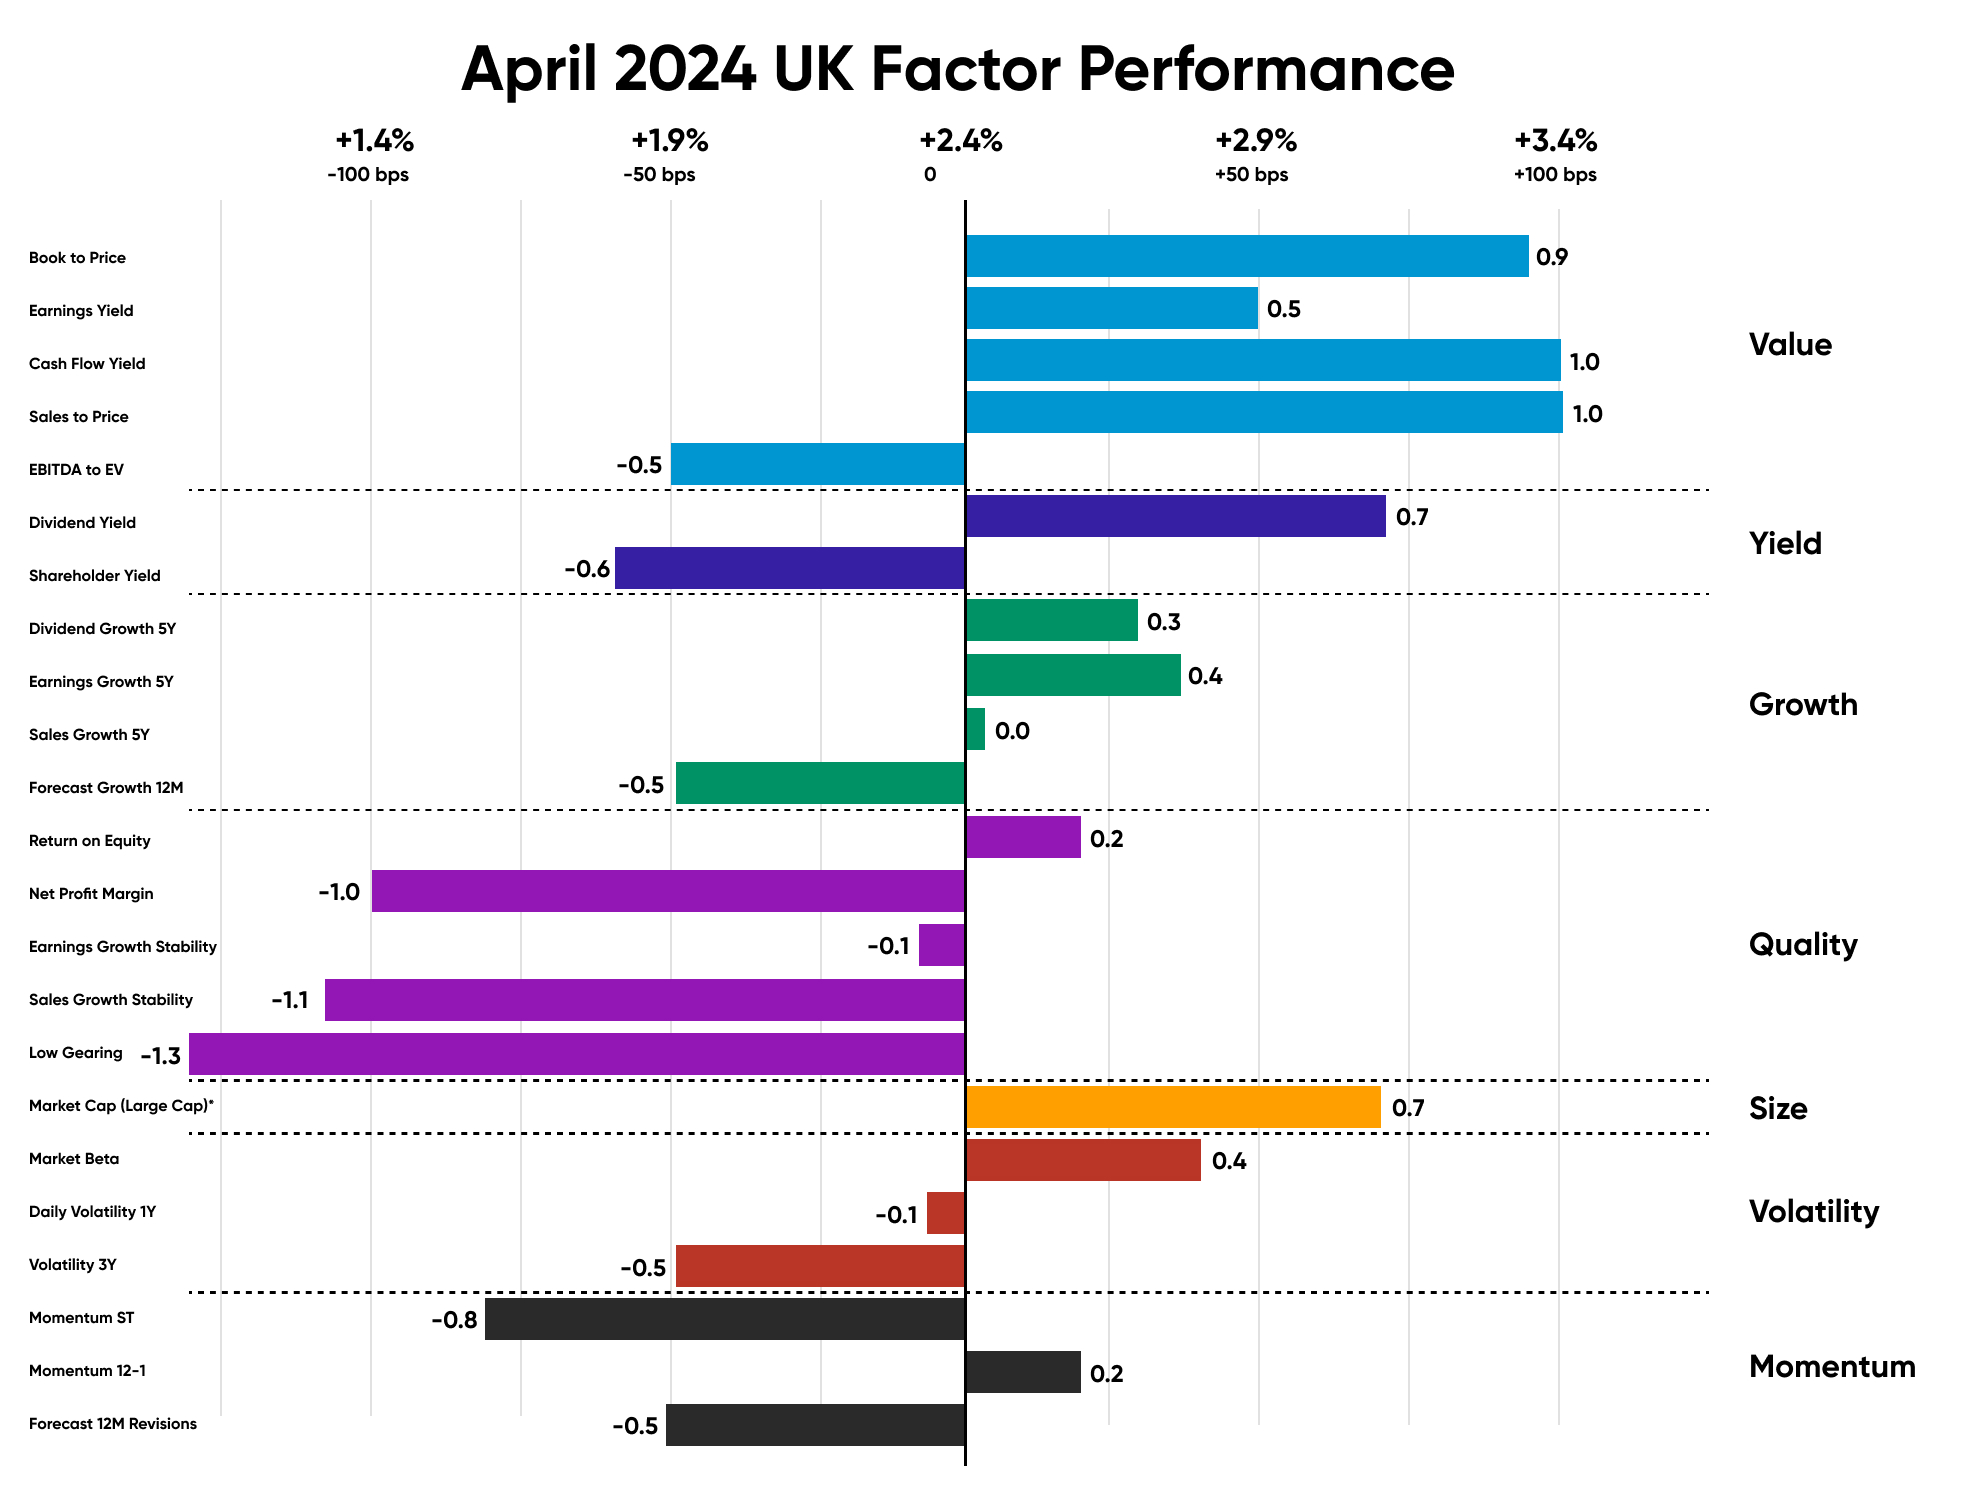
From a Yield perspective, equity performance in the UK reflected mixed sentiment. Stocks with a high dividend yield outperformed by 70bps, while stocks with a significant shareholder’s yield countered by a -60bps underperformance. All Momentum subfactors suffered a significant setback as their constituents experienced an average underperformance of -30bps.
Some of the British financial companies that drove Value through April included financial company HSBC Group (11.39% in April), Natwest Group (13.31% in April), and Barclay’s PLC (9.67% in April).
Source: Investment Metrics, a Confluence company.
Emerging Market Equities
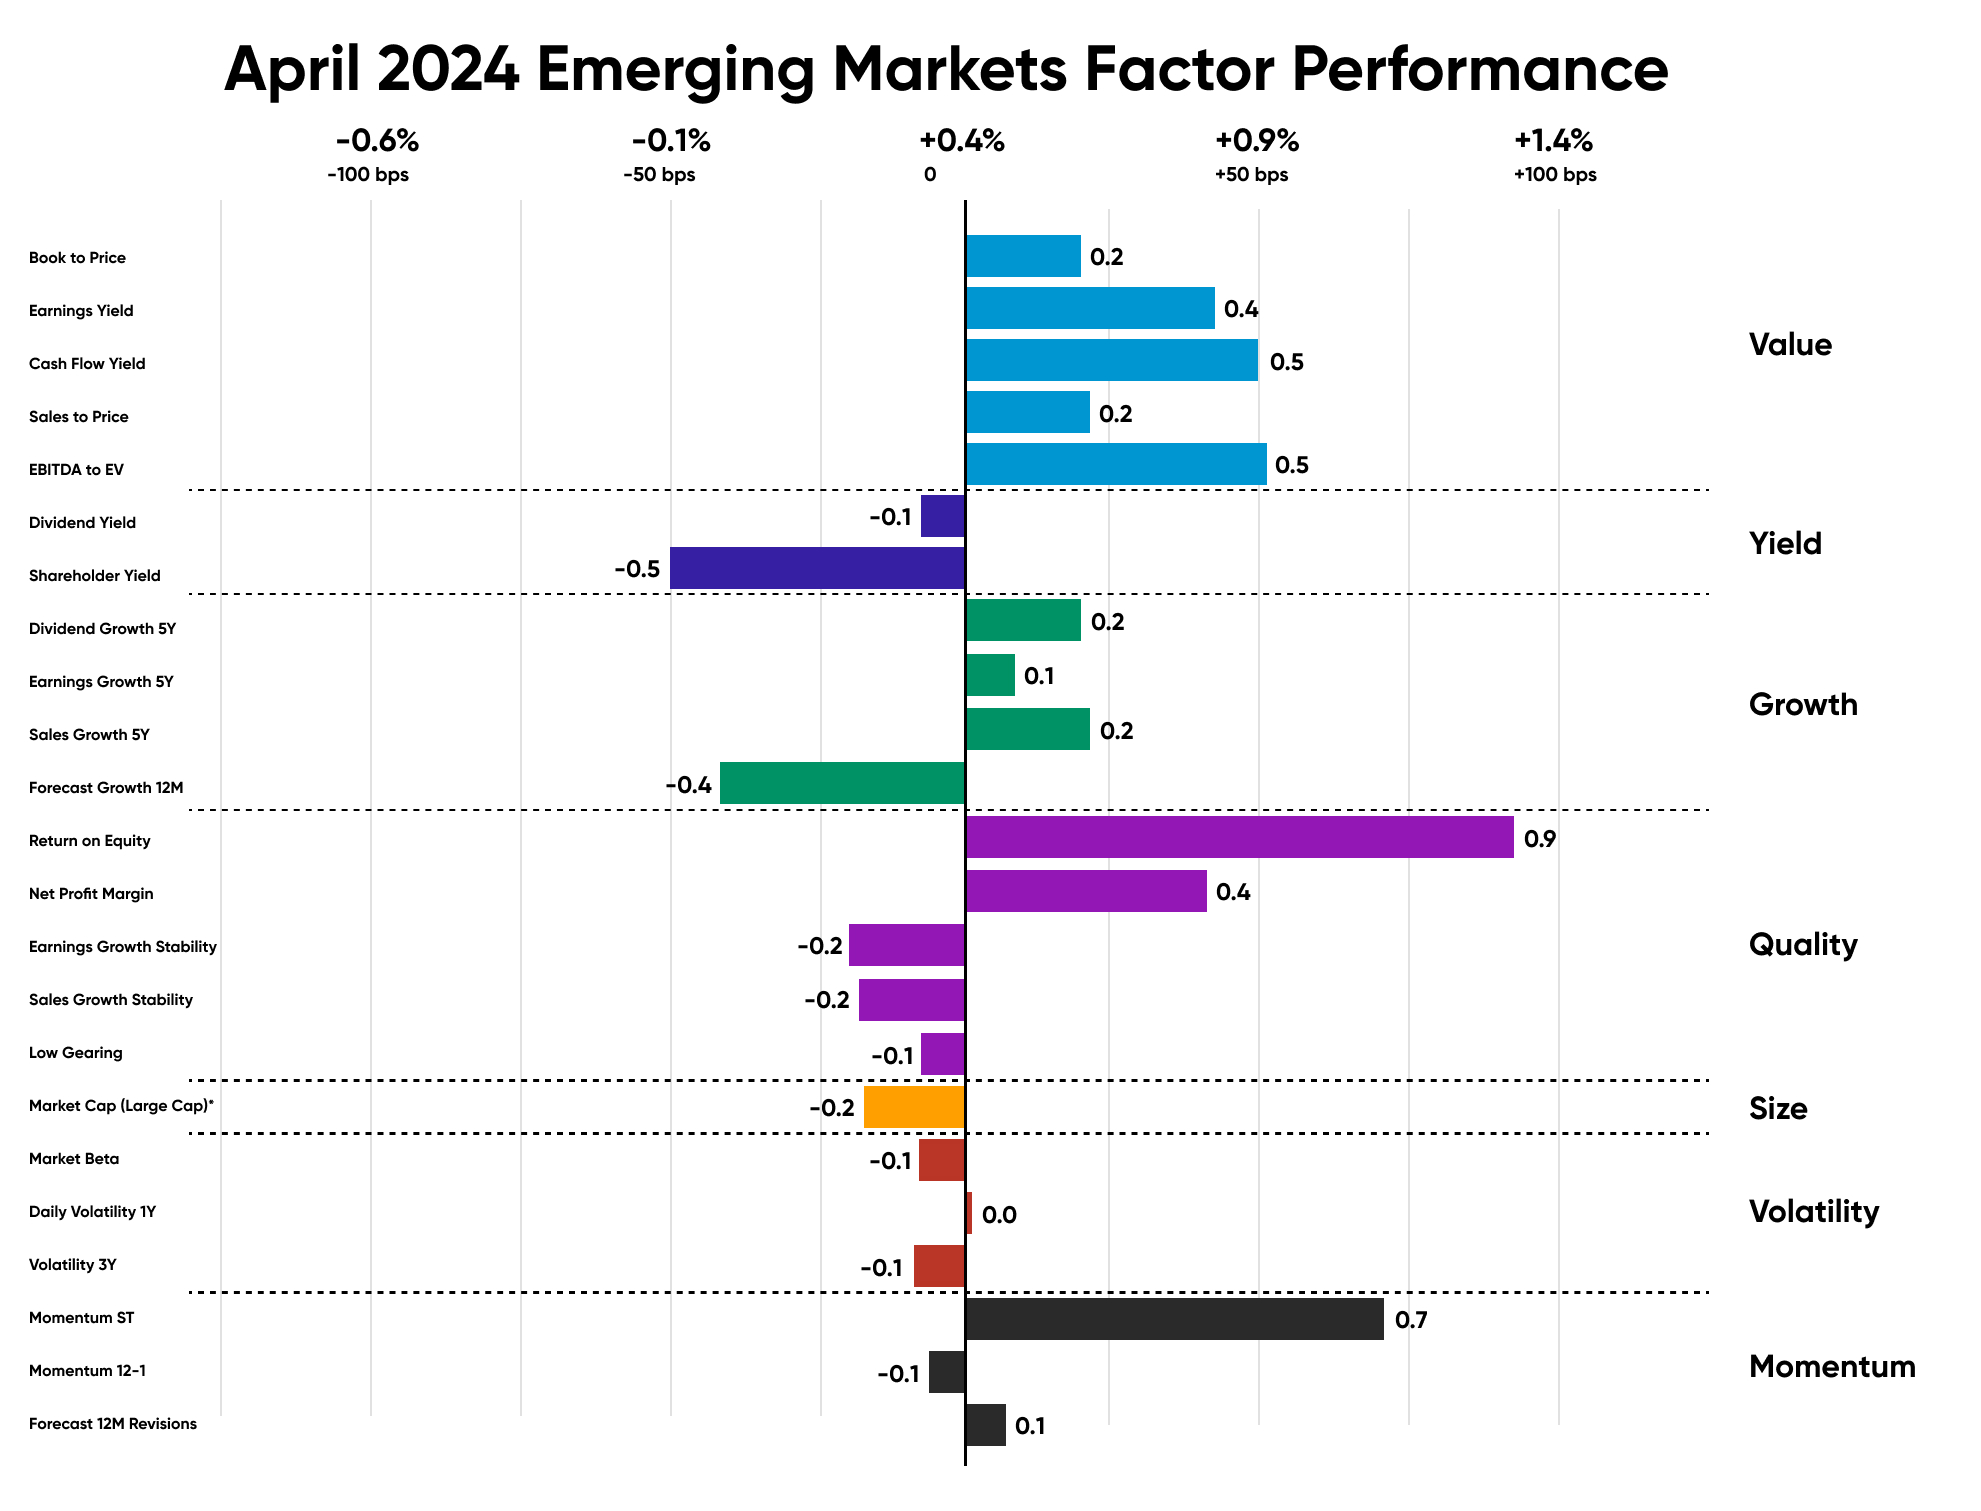
Stocks with high expected growth, as captured by the “Forecasted 12M Growth” Growth sub-factor, underperformed by approximately 50bps and contributed to the decline in performance for Emerging Markets in April.
The ROE contribution to Emerging Markets equities’ outperformance through April was significantly led by India and strongly influenced by Indian financial company Life Insurance Corp of India (+6.74% in April); Coal India Limited (+4.61% in April); Indian materials company Chandra Asri Pacific PT (+26.80% in April) and China Comm Service company Tencent Ltd (+14.36% in April).
Source: Investment Metrics, a Confluence company.
Canadian Equities
A varied pattern emerged among Quality stocks this month, with high return on equity (ROE), stable earnings growth, and low gearing contributing to outperformance. Net profit margin and sales growth stability had a mitigating effect on these stocks. Similar to the US, UK, and Europe, Momentum experienced a significant decline in performance, with short-term momentum plunging to a -60bps performance compared to the market.
Canadian stocks with a high dividend growth over 5Y that drove the Growth outperformance included companies like Canadian industrial firm Agnico Eagle Mines (+6.2% in April), Dollarama Inc (+9.7% in April), Teck Resources Ltd (+7.6% in April).
Source: Investment Metrics, a Confluence company.
Appendix: How to read the charts
For example, for the book-to-price factor, we determine the period’s performance of the basket of stocks with the highest book-to-price values relative to the total market. Each factor is analyzed independently, market and fundamental data are adjusted to enable sector-average (within each country) relative data to be used, and the performance measurement isolates the factor’s contribution to return.
Disclaimer
The information contained in this communication is for informational purposes only. Investment Metrics, a Confluence company, is not providing, legal, financial, accounting, compliance or other similar services or advice through this communication. Recipients of this communication are responsible for understanding the regulatory and legal requirements applicable to their business.


