This post is an excerpt from an article in the most recent volume of the Journal of Performance Measurement written by Carl Bacon, CIPM, StatPro Chief Advisor, Ian Thompson, Ph.D., Global Head of Portfolio Analytics at StatPro, and Pierre van der Westhuizen, Head of Performance at StatPro.
Introduction
 As we discussed in our paper on “Abnormal” Returns (Bacon, Thompson and van der Westhuizen, 2016), calculating performance returns is relatively simple. The only data required are accurate valuations at the start of the period and the end of the period, together with any transactions (cash flows) during the period. We need the transactions because we need to know which part of the value increase/decrease is due to underlying performance rather than cash flow.
The basic return formula for a time-weighted or holding period rate of return for a portfolio is straightforward:
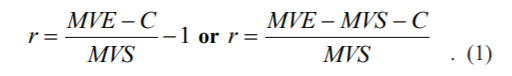 Where:
- MVE = Market End Value
- MVS = Market Start Value
- C = Cash flow
In fact, this return formula can be used at all levels within the portfolio: carve-outs, sub-portfolios, individual countries, industrial sectors, and individual securities:
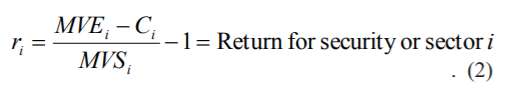
Where:
- MVEi = Market End Value for security or sector i
- MVSi = Market Start Value for security or sector i
- Ci = Cash flow for security or sector i
But do these formulae hold if the market values are negative, if MVS<0? If we are considering security level, as both Menchero (2003) and Laker (2002) have pointed out, the return has the desirable property of being independent of whether the security is held long or short. So, for example, if the price changes from $100 to $110 over the period, the return of the stock is simply +10% regardless of whether it is held long or short. This is a fundamental and crucial observation. The return of the asset is independent of the holding, the return experience of that asset is the same for all. Arbitrarily changing the sign of the return for presentational convenience, as well as being incorrect will also lead to many potential calculation issues. However, the contribution, attribution, portfolio gains and losses will depend on the holding quantity and, of course, whether the holding is long or short.
What causes negative market values?
Negative market values are caused by short positions, selling securities you do not own, but also derivative instruments and through time leverage. Derivative instruments might be relatively straightforward instruments, such as futures or contracts for difference, which create symmetric positive and negative economic exposures that offset. Gains and losses in these simple derivative instruments manifest as real cash in the margin account. More complex derivative instruments such as swaps and forwards in which the notional exposures are not symmetric might result in unrealized gains or losses during the lifetime of the instrument. As single line instruments, swaps and forwards have the undesirable property of changing sign positive to negative and negative to positive as one leg of the contract changes value relative to the other. This may cause a discontinuity in the return series, which in isolation suggests returns cannot be linked. Leverage (in which the total value of positive assets is greater than the total portfolio value) can also cause negative total portfolio values through time. If the portfolio of assets also includes liabilities (in effect negative assets) then the value of positive assets can fall to a value smaller than the liabilities and create, just like a single line swap, a portfolio that changes from positive to negative value.
Another special type of portfolio that is often negative in value is an overlay portfolio. Overlay portfolios use derivative instruments to generate economic exposure, normally in the context of assets held in a separate underlay portfolio. Often the underlay asset performance is the responsibility of another asset management firm. In effect, overlay is a source of excess returns with no or little capital allocation leading to zero or near-zero market value denominators or negative values in the event of net negative unrealized losses.
But what if the total portfolio value is negative and this portfolio value itself becomes more negative? Using equation 1, the return that is calculated would actually be positive! Take a portfolio with a start value of – £1,000 and an end value -£1,100, the return is:
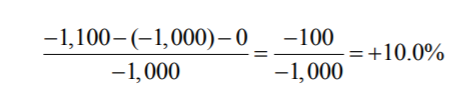
Isn’t that counter-intuitive? Starting with a negative value and ending with a more negative value means that we’ve lost money, how can the return be positive? Consider a portfolio with one security only and this was held short. If the security’s price increases the individual security return would still be positive (even though it is held short). This is another important observation – the return is meaningful only when viewed in the context of the market value. A positive return causes a negative contribution when the starting market value is negative and the total portfolio starting market value is positive. Most investors, and indeed analysts, are conditioned to expect positive contributions from positive returns, but that is only because most of the time we are dealing with positive market values. We must consider the context. If the portfolio in question was really part of an aggregate portfolio, then the fact that there was a positive return but a negative weight (due to its negative value) correctly generates a negative contribution to the aggregate portfolio, which is clearly what would we would expect. In effect, the negative portfolio is a short holding of the portfolio in the context of the aggregated portfolio.
Why would investors choose to invest in a portfolio of negative value? It seems unlikely that any negative value portfolios would persist independently in the long term, as the portfolio would not remain solvent. However, there may be cases, where a portfolio could be in overdraft position for a short period of time. In this situation, what return should be calculated? Moreover, if the portfolio fluctuates between negative and positive values over time, how should the period return calculation work (i.e., how does this data affect the chain-linking/compounding of the returns)? Do the returns for the period make sense?
In the case of an overlay portfolio, the overlay is managed in the context of the overall assets. Although the unrealized losses in overlay may be negative, this may be more than compensated by realized or unrealized gains in the underlay portfolio.
Another case to consider is long/short and market neutral portfolios. It is typically the case that the “solution” to measuring long/short, or market neutral portfolios, is to split these portfolios into their component elements in all likelihood consistent with the investment process.
In some of the above cases, there is an argument that the absolute value of the portfolio, or of the notional exposure, or of a target exposure (if specified) should be used as the denominator. Let’s consider each of these cases in turn.
To view the rest of the article, click here.