2023
Factor Performance Analysis
US Growth stands out amongst global Value and Yield
by:
Market Background
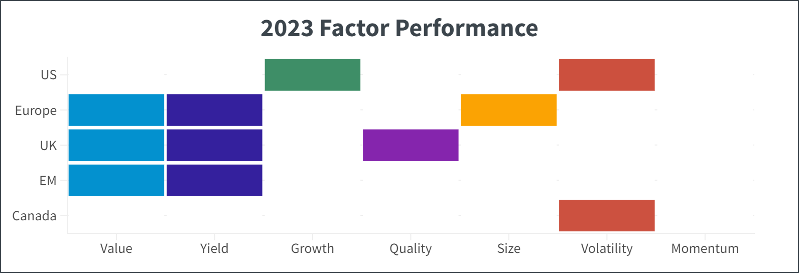
As seen last quarter, the annual trend where the US diverged from other developed markets has persisted through Q4 and the end of the year. The US continues to favor Growth and Volatility, while it appears to be in a similar market environment as in 2020 and 2021, the situation now is more pragmatic, based less on forecasts and more on realized growth. Europe, the UK, and Emerging Markets all continue to prefer Value and Yield, as seen in 2022 with some caveats. Canada has a neutral factor performance trend overall, again with an emphasis on Volatility.
Although oil prices surged by 30% in Q3, they have begun to stabilize down at $70/barrel, persistent with the average observed in late 2022-early 2023 but still above the $60/barrel pre-pandemic level. Bitcoin and other risk-on assets surged on the news of potential rate cuts, reaching levels last seen at the end of 2021. Gold closed the year out with +7% at $2,060/TOz.
Factor Summary
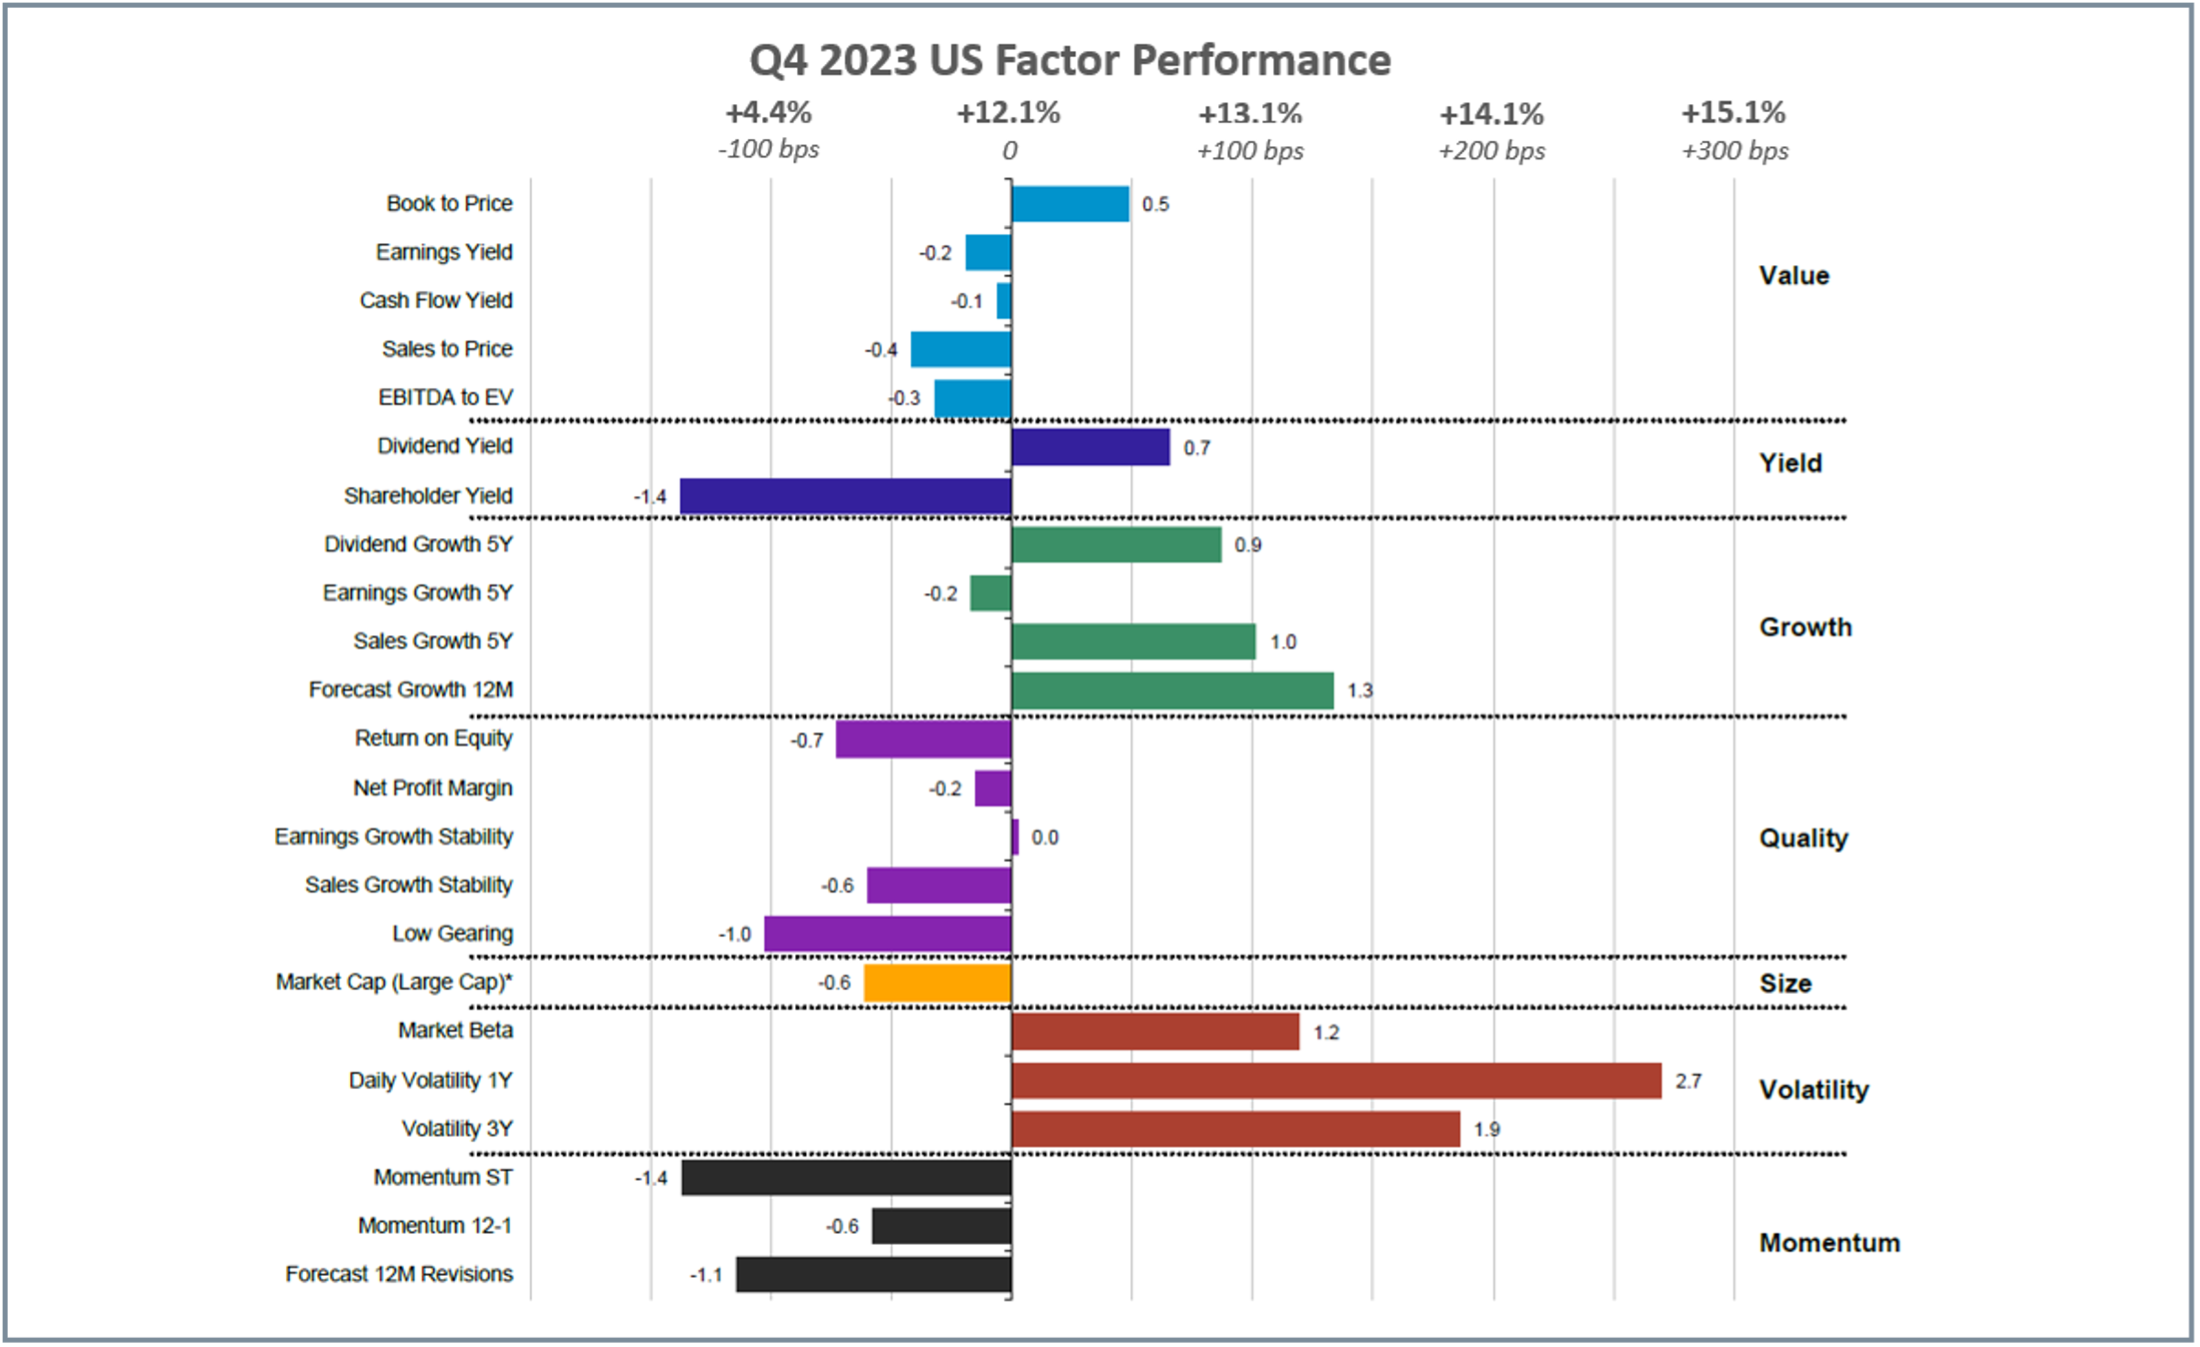
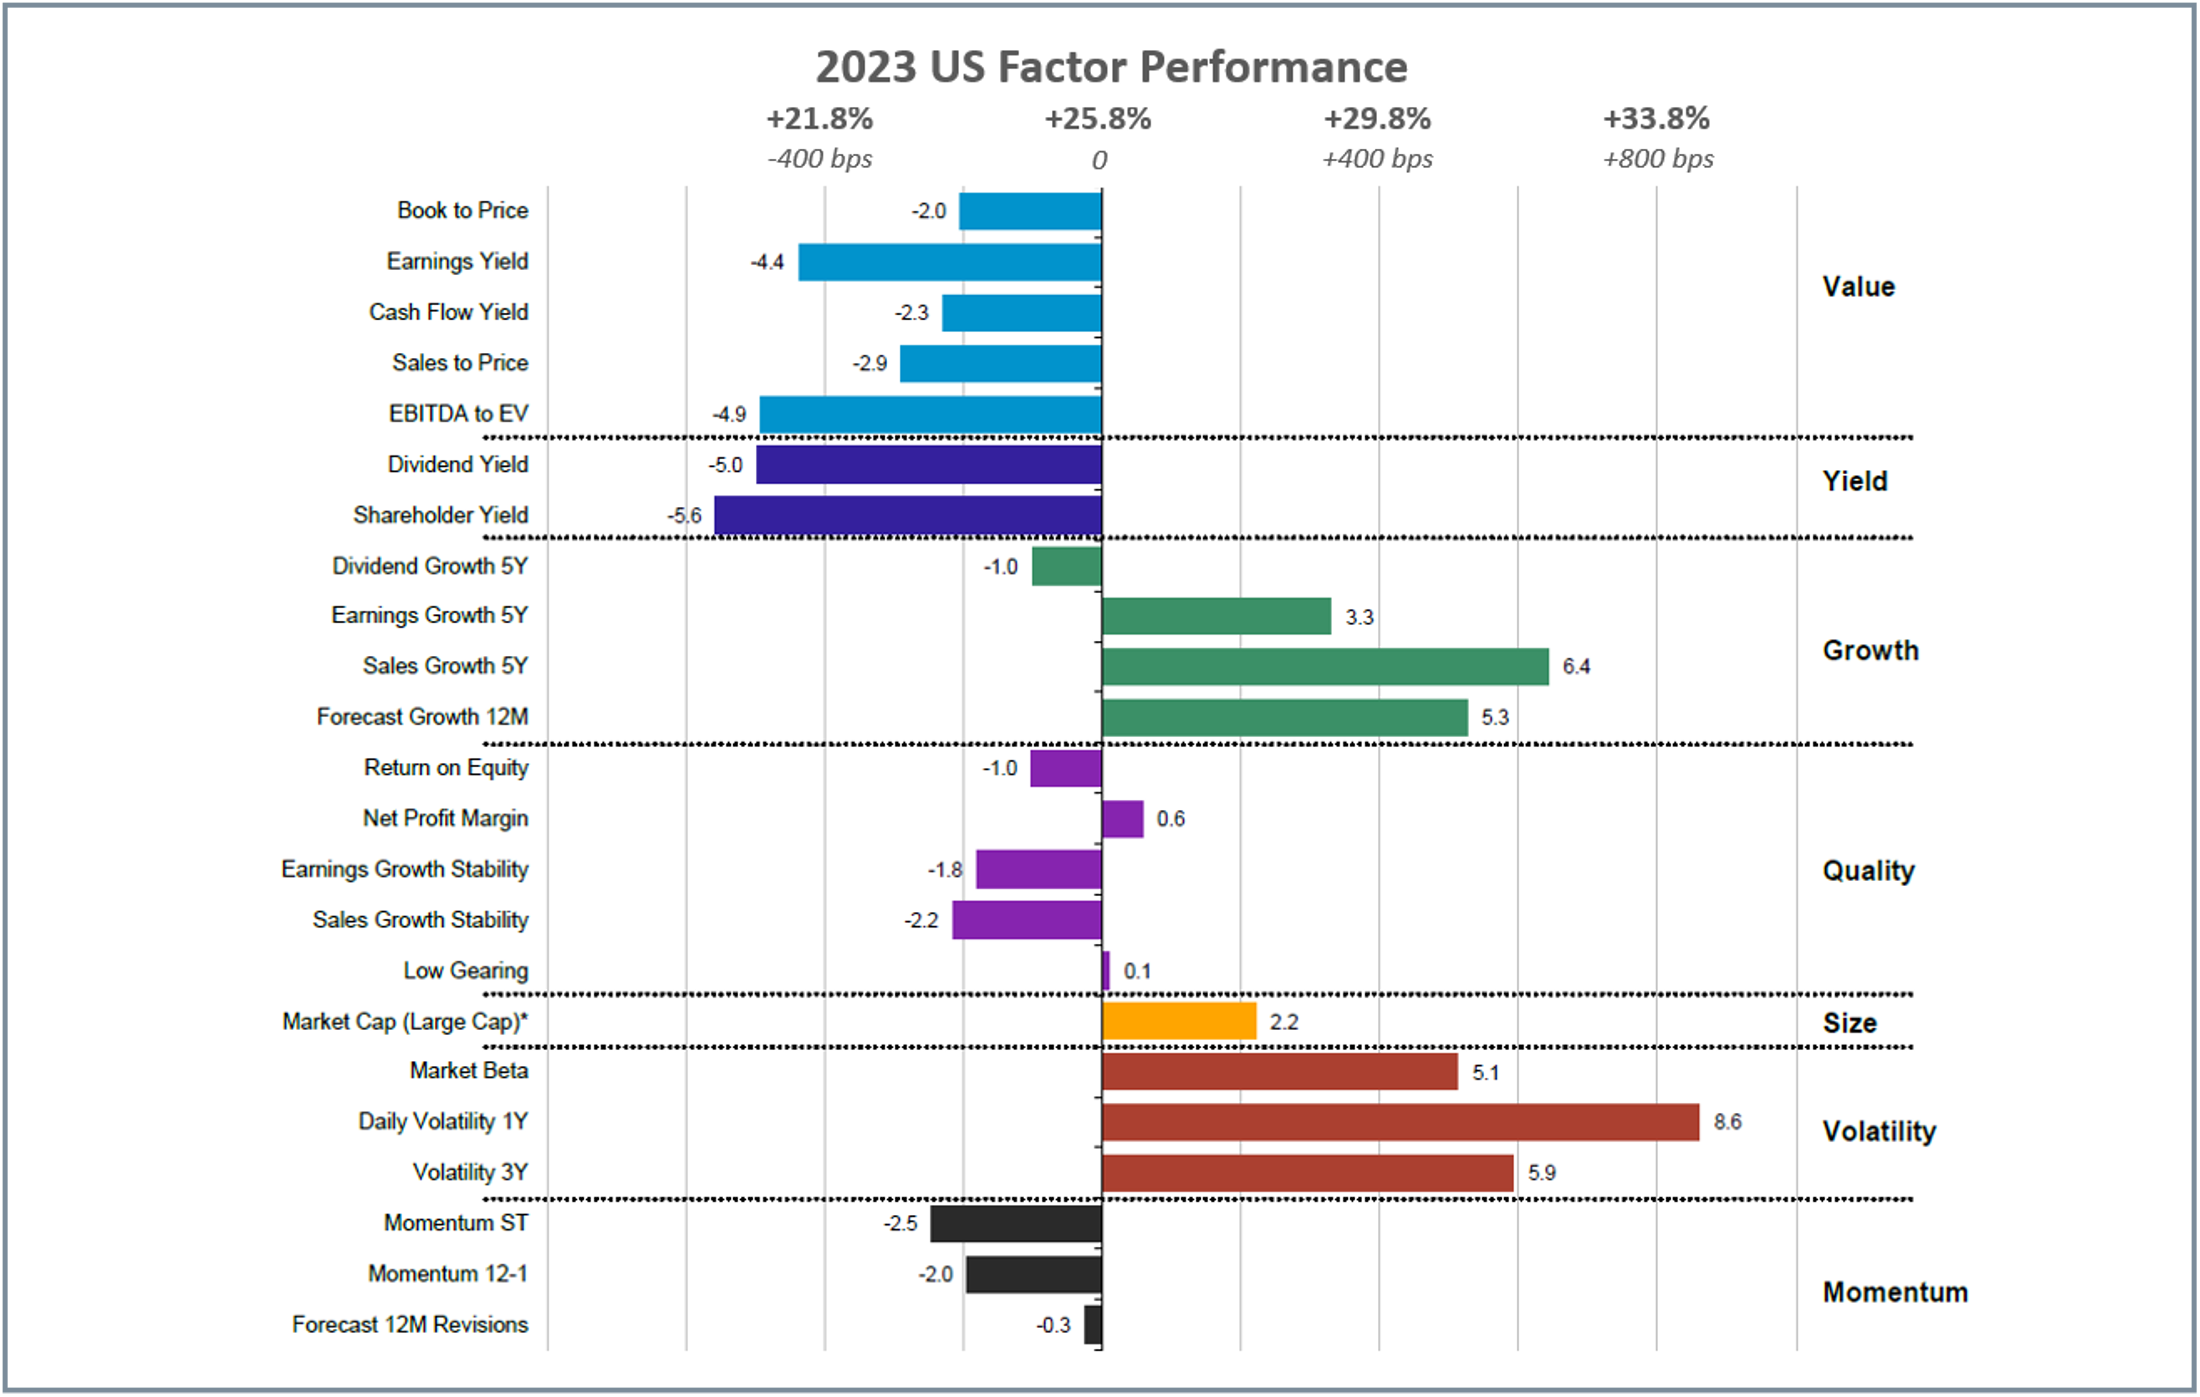
- US Equities: Growth and Volatility outperformed both in Q4 and for 2023.
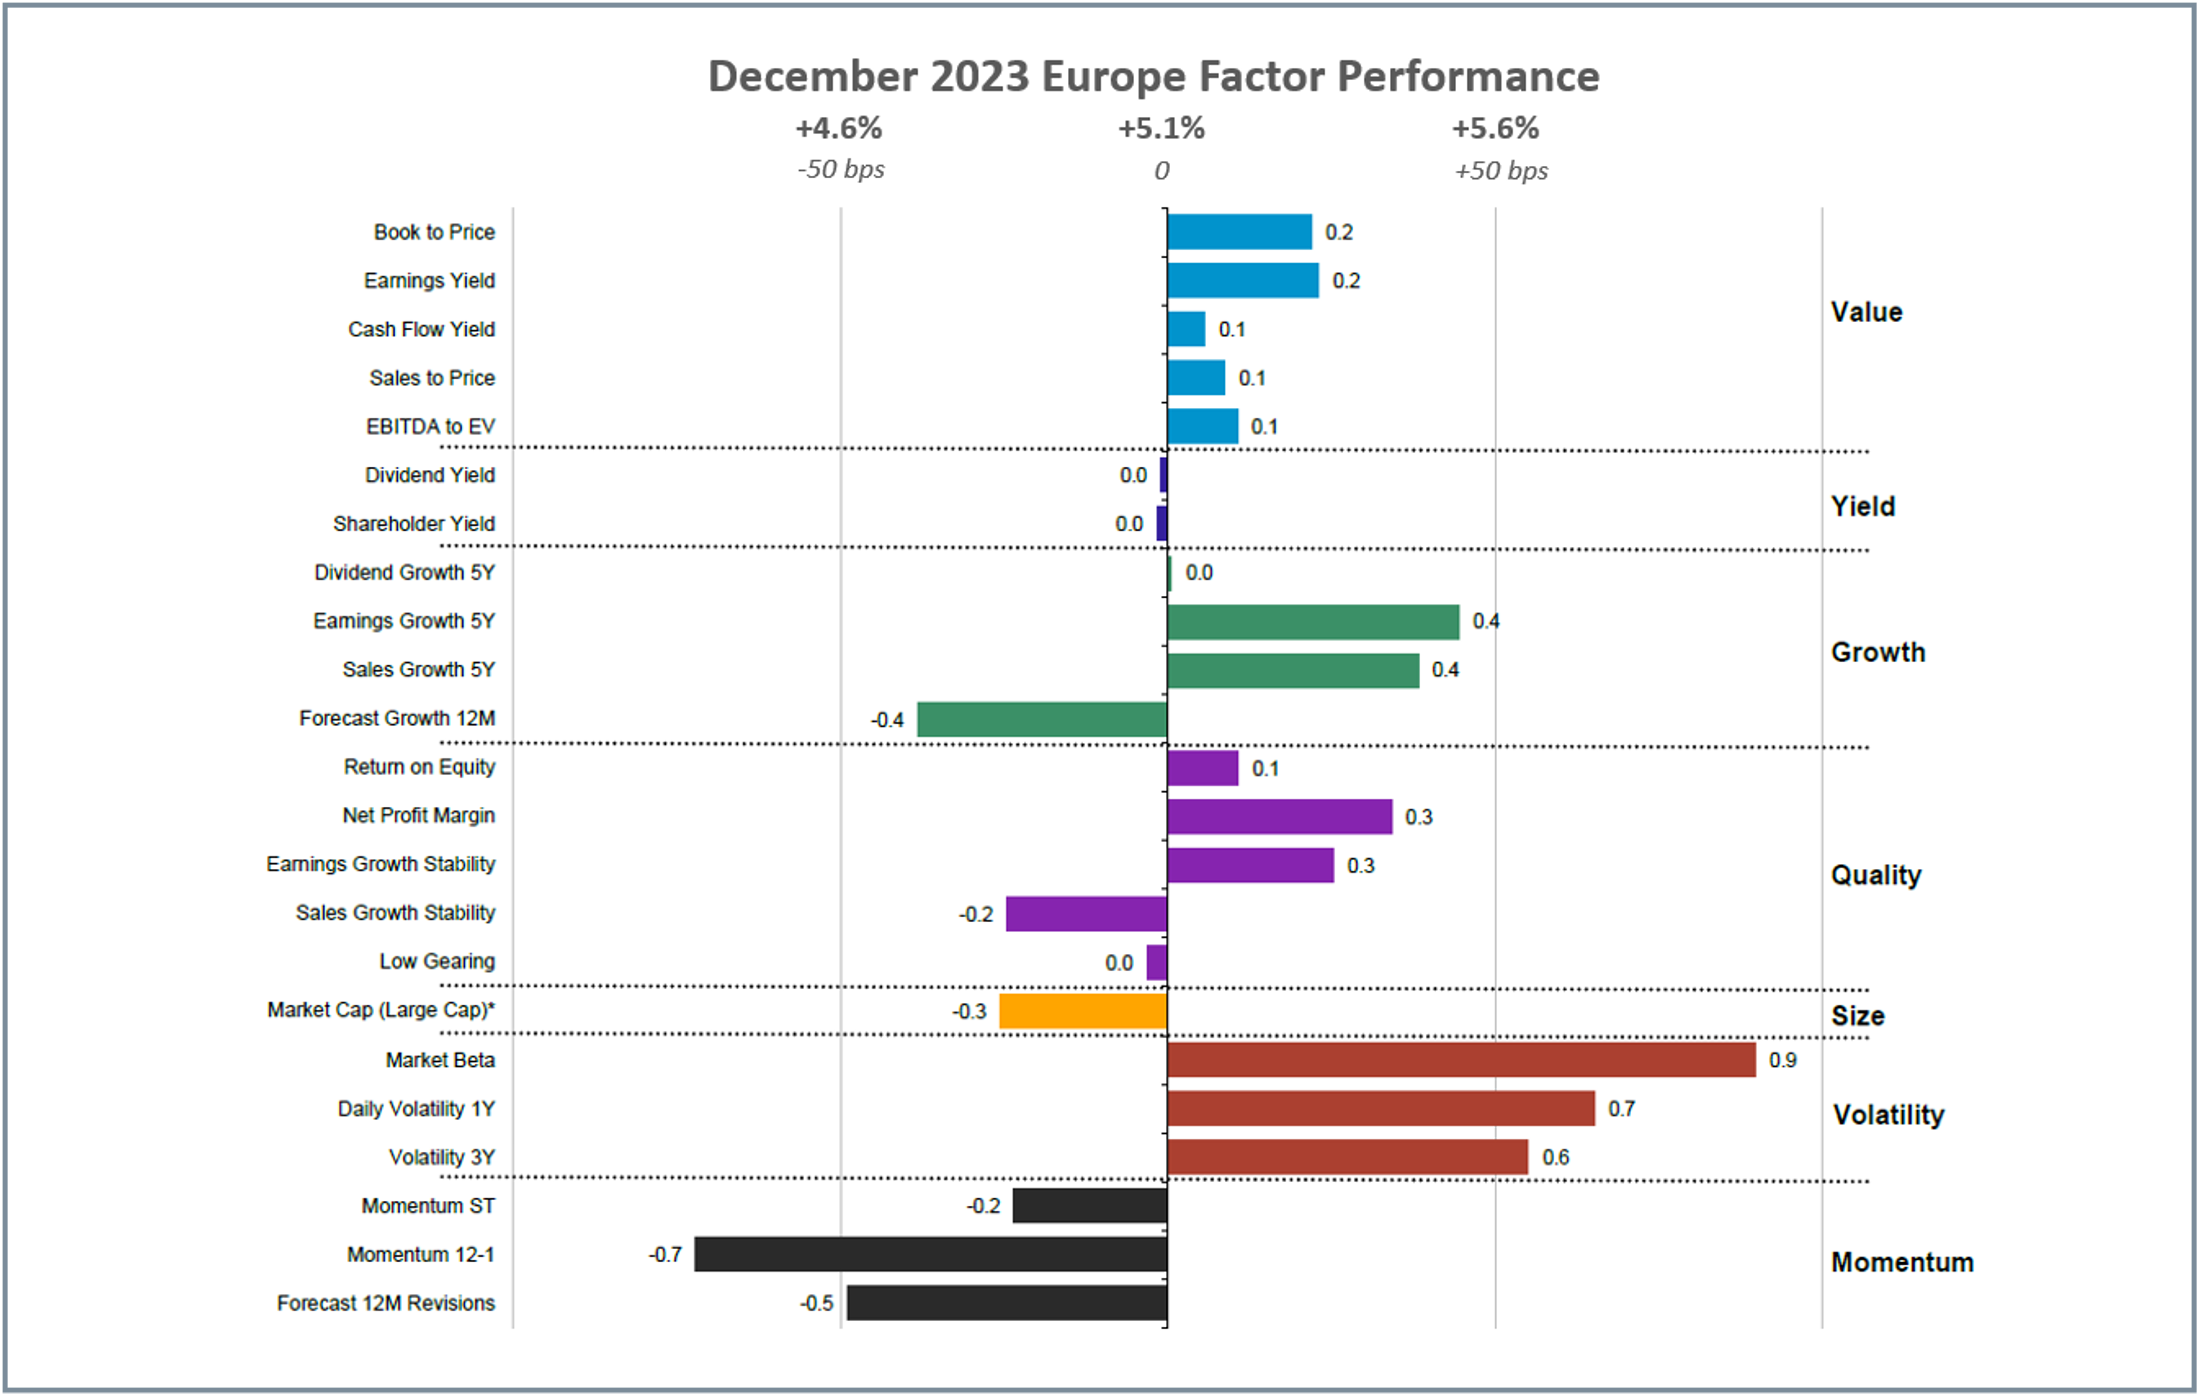
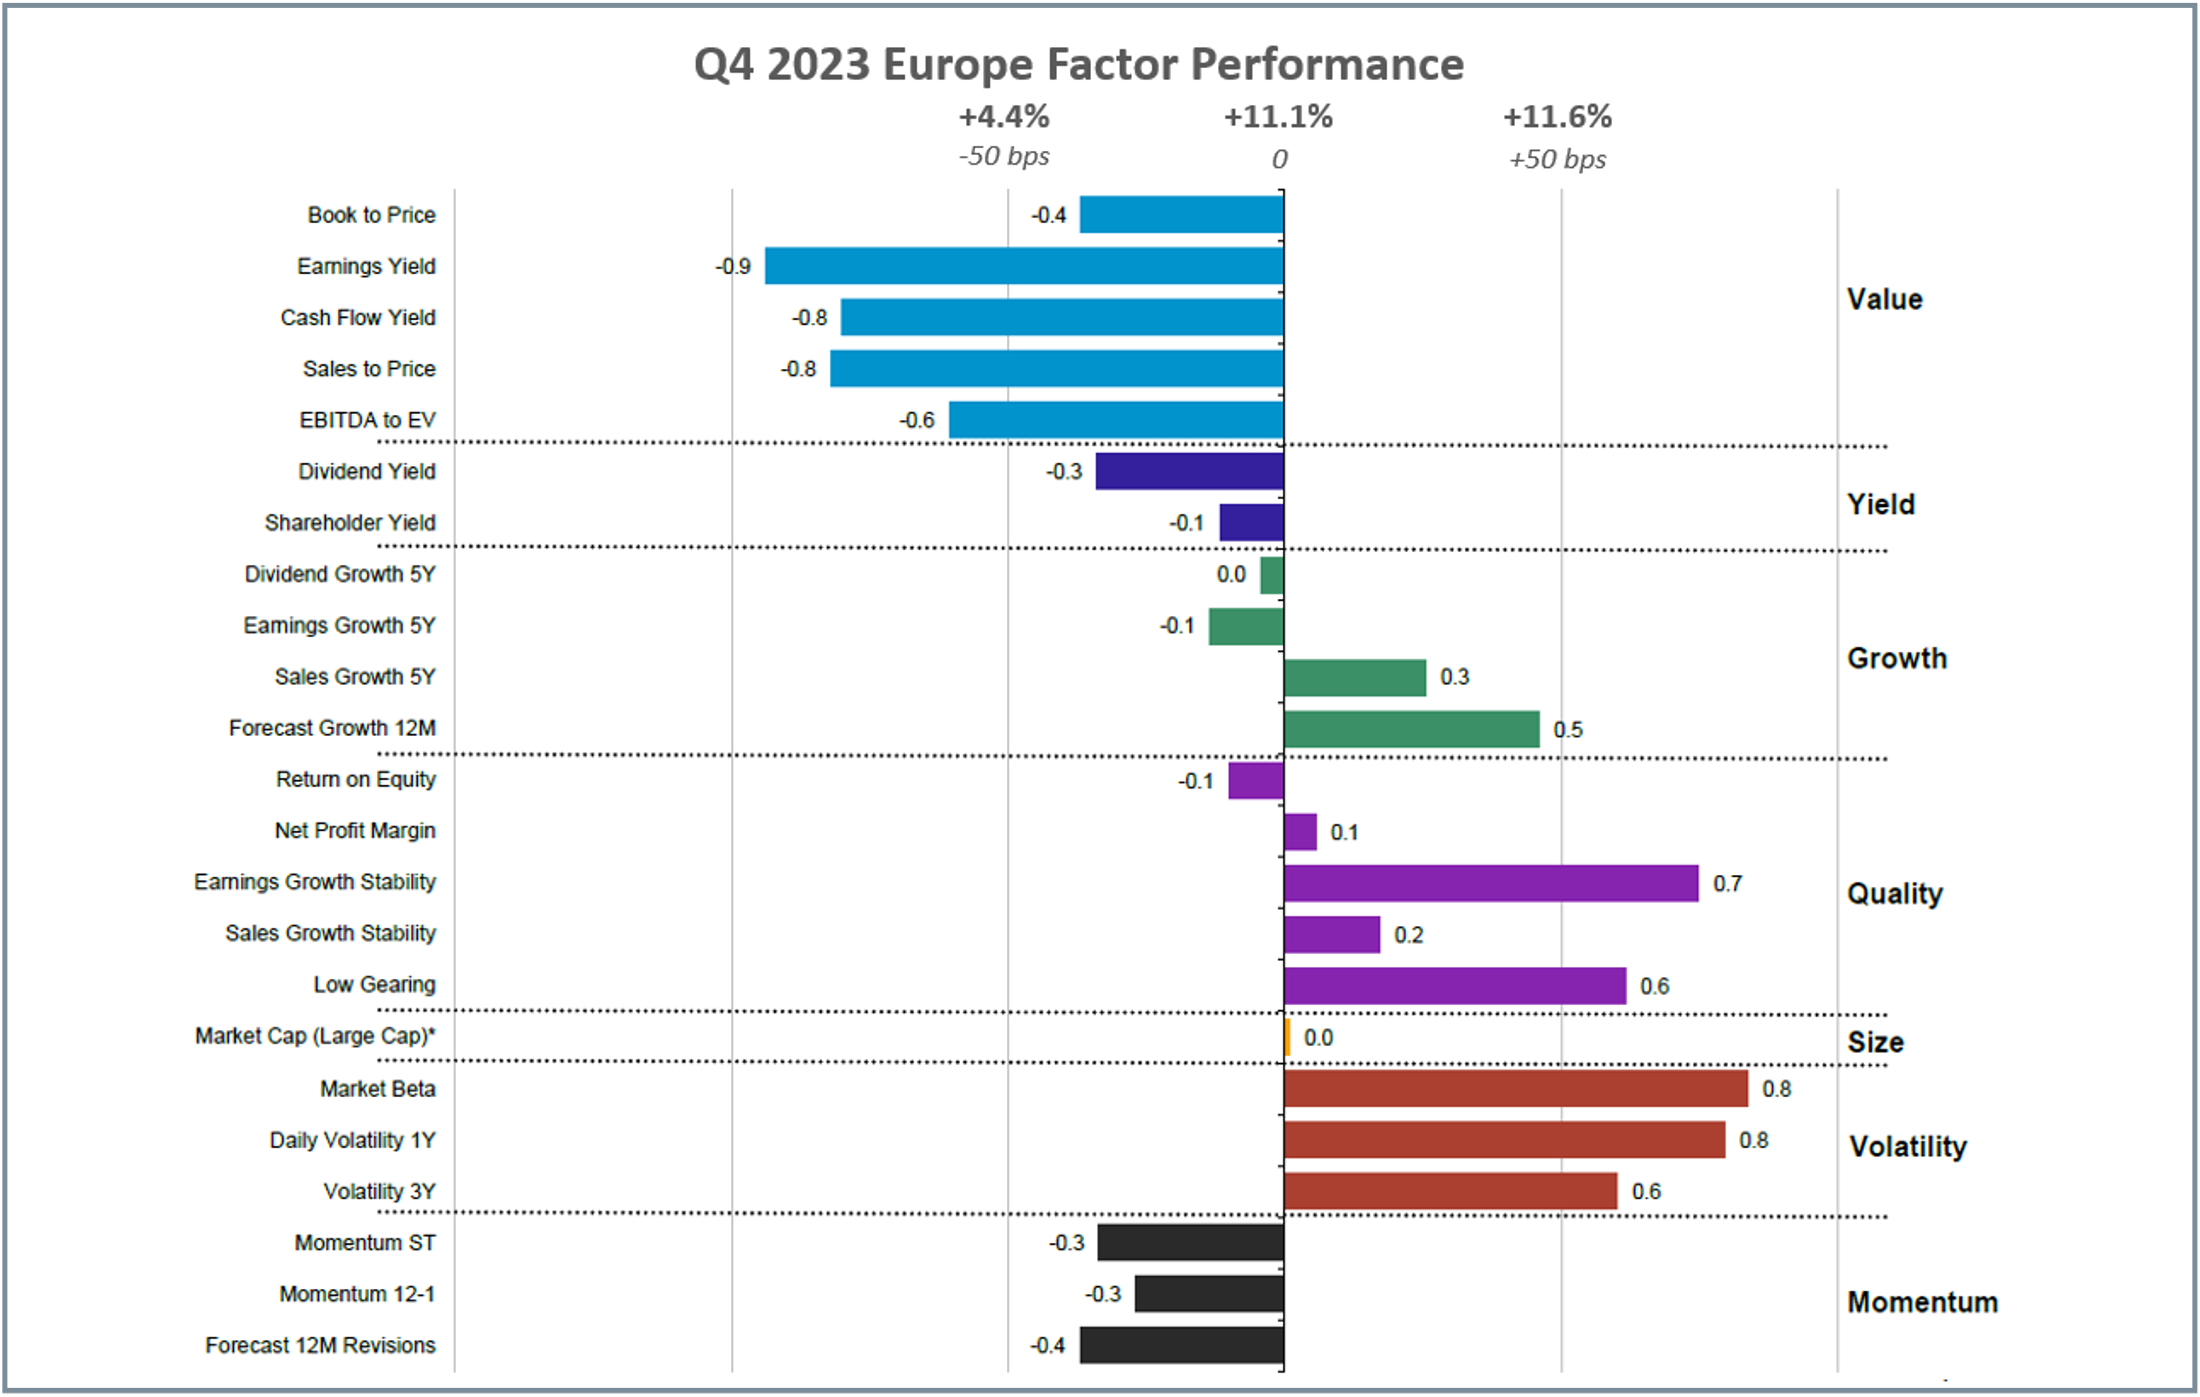
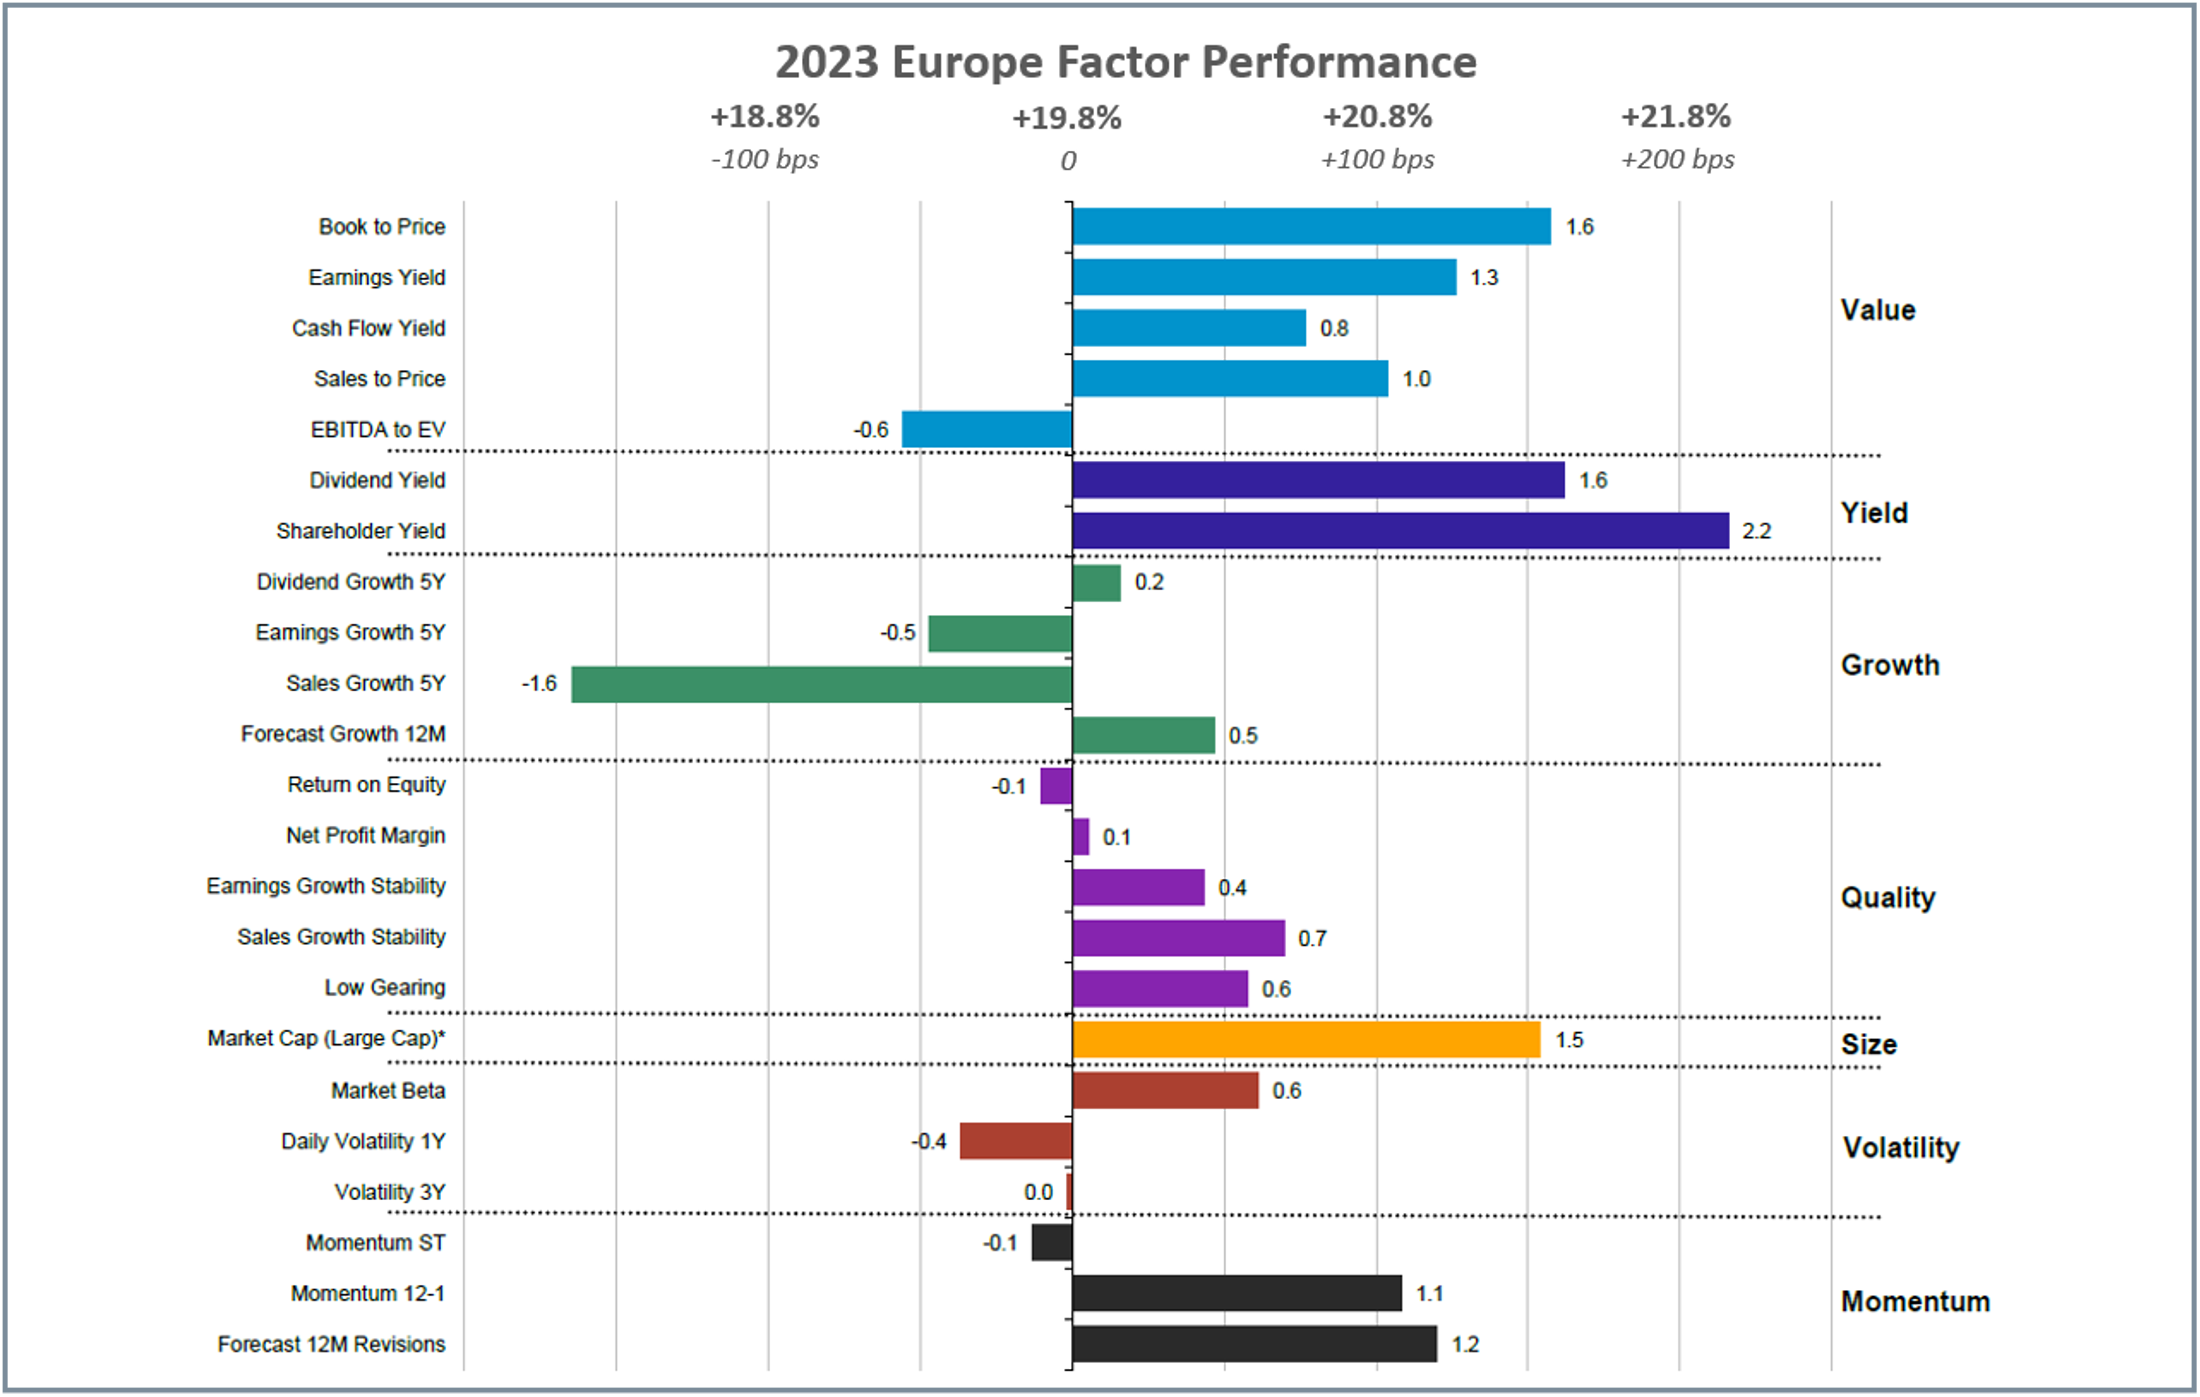
- European Equities : Surge in Q4 led Volatility and Forecast Growth to outperform, but Value, Yield, and Large Cap outperformed in 2023.
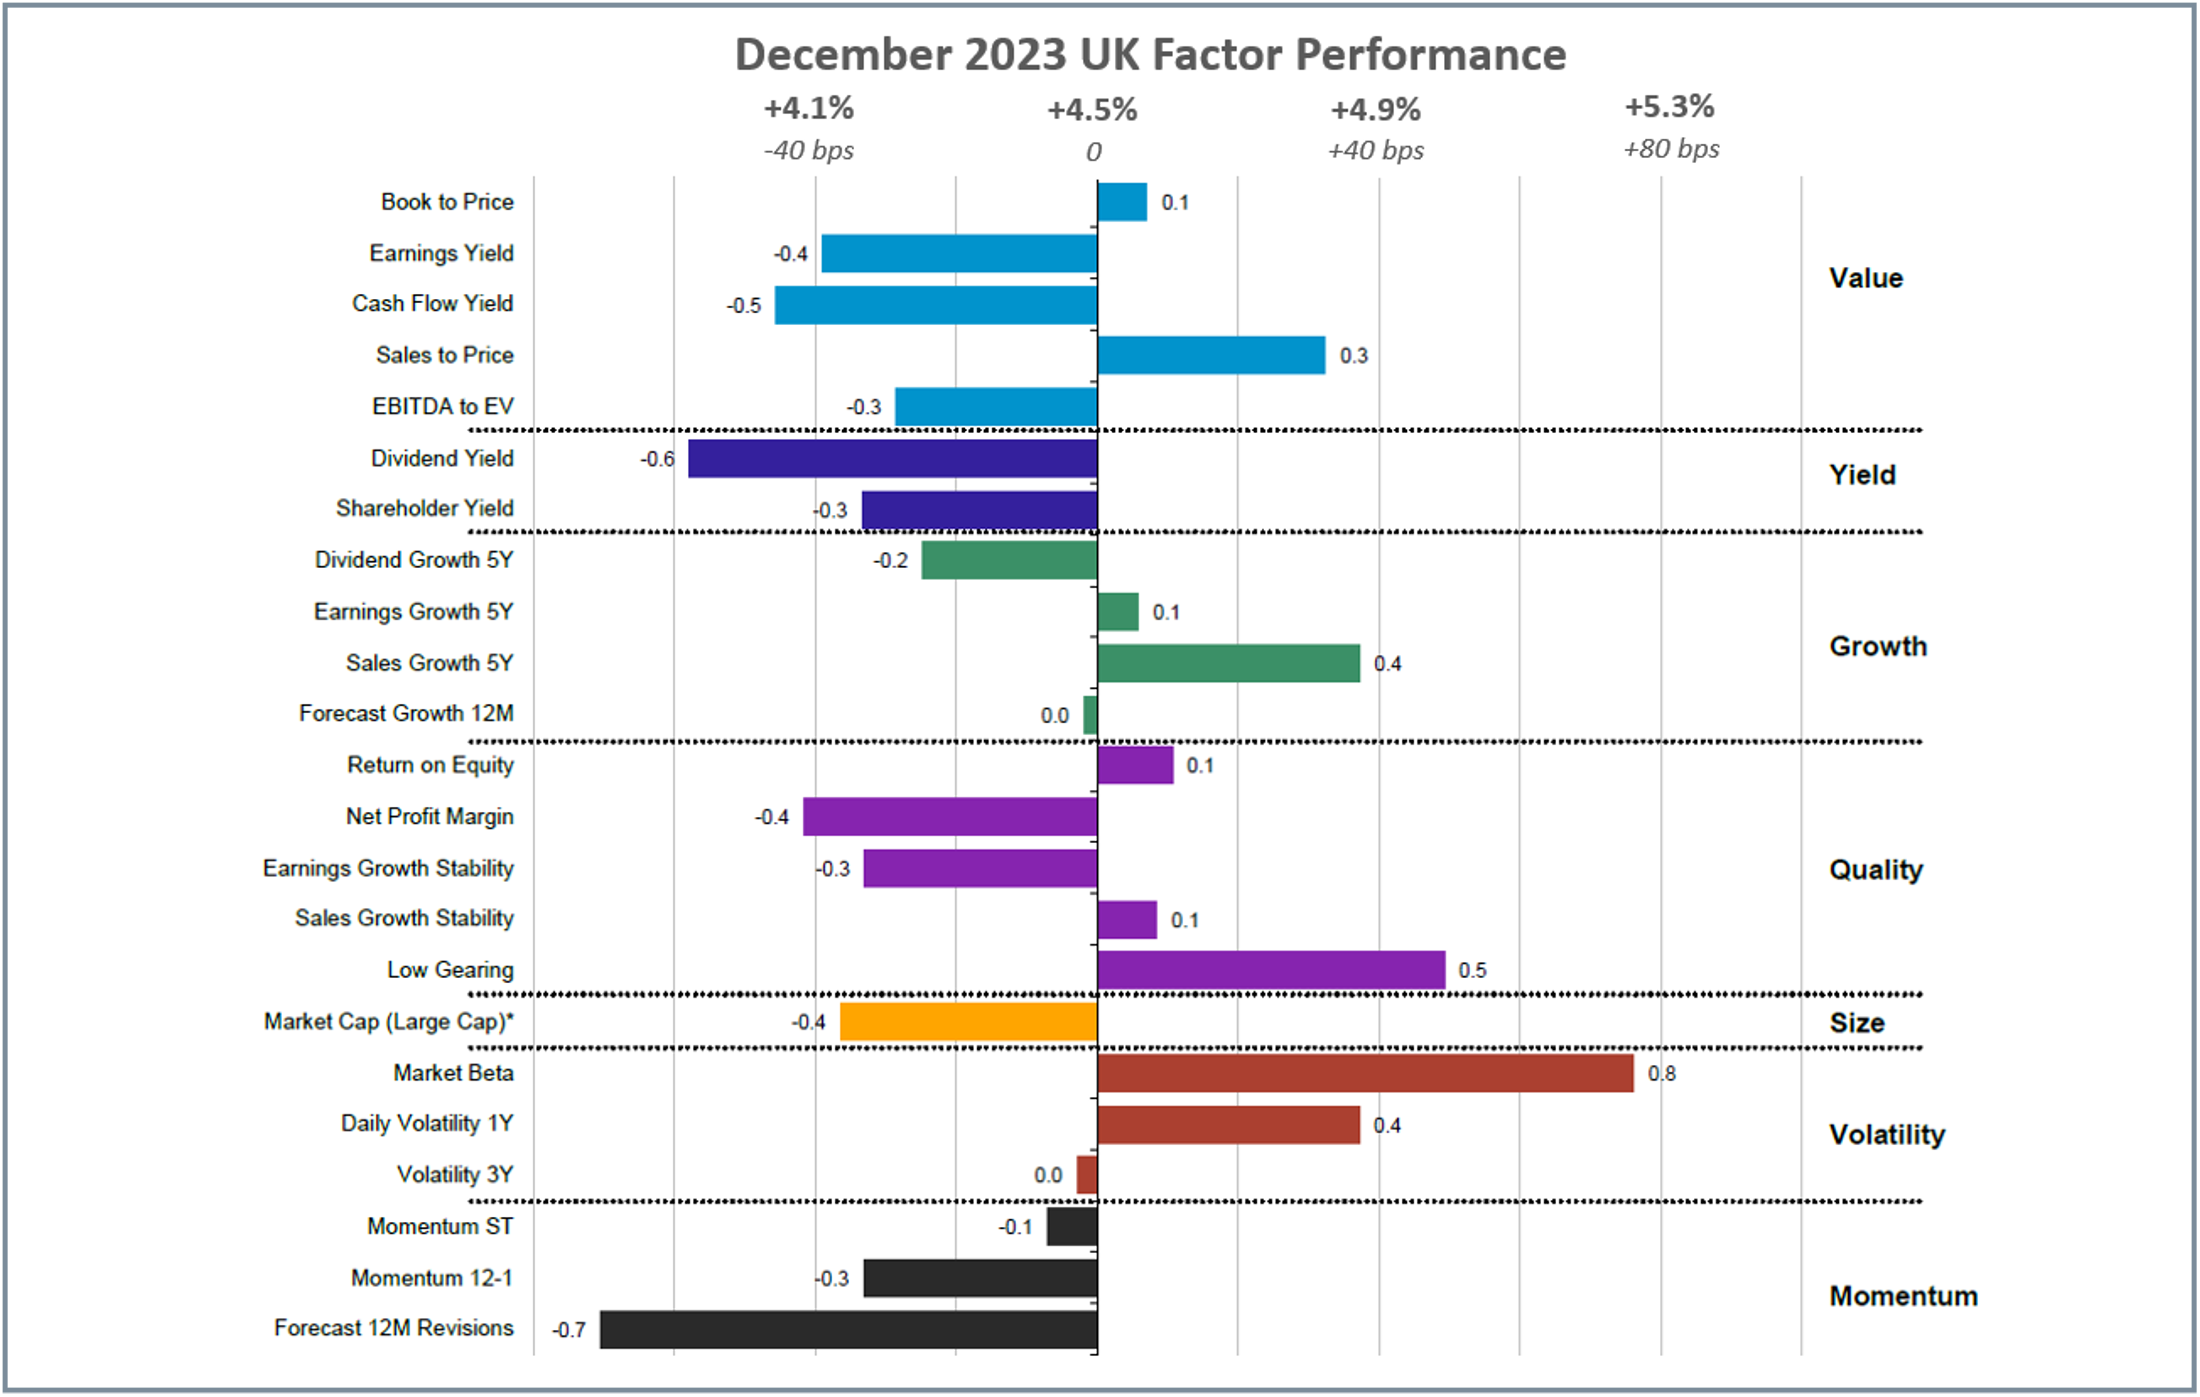
- UK Equities: Value, Yield, and Quality outperformed in 2023, especially Low-Gearing in December and Q4.
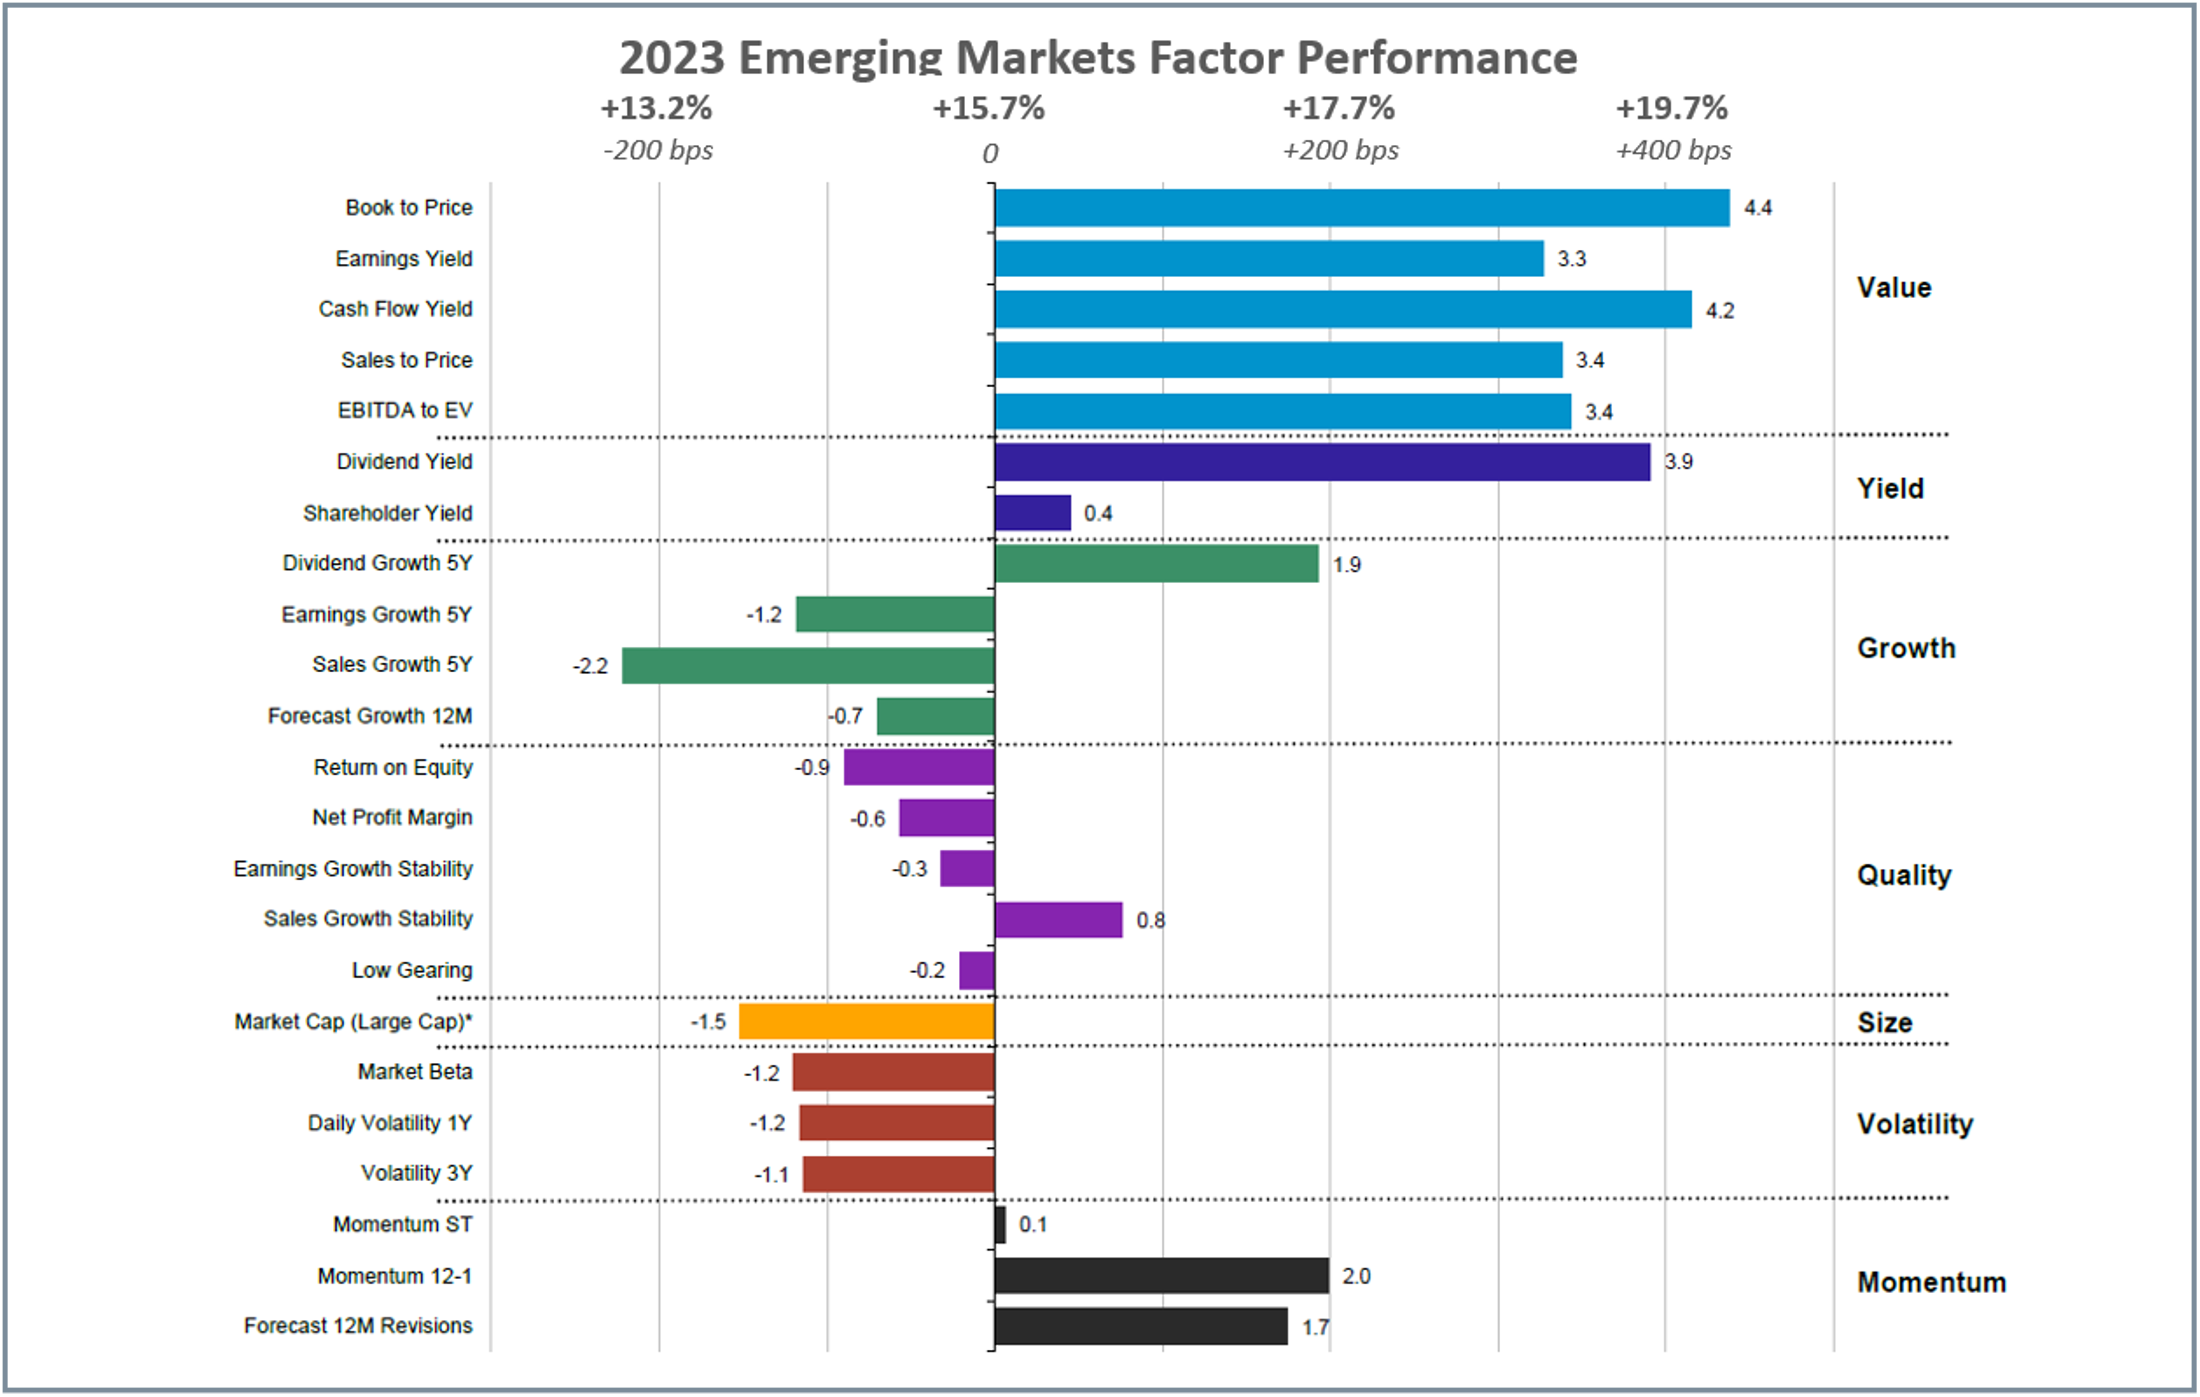
- Emerging Market Equities: Value, Yield, and Dividend Growth outperformed in 2023.
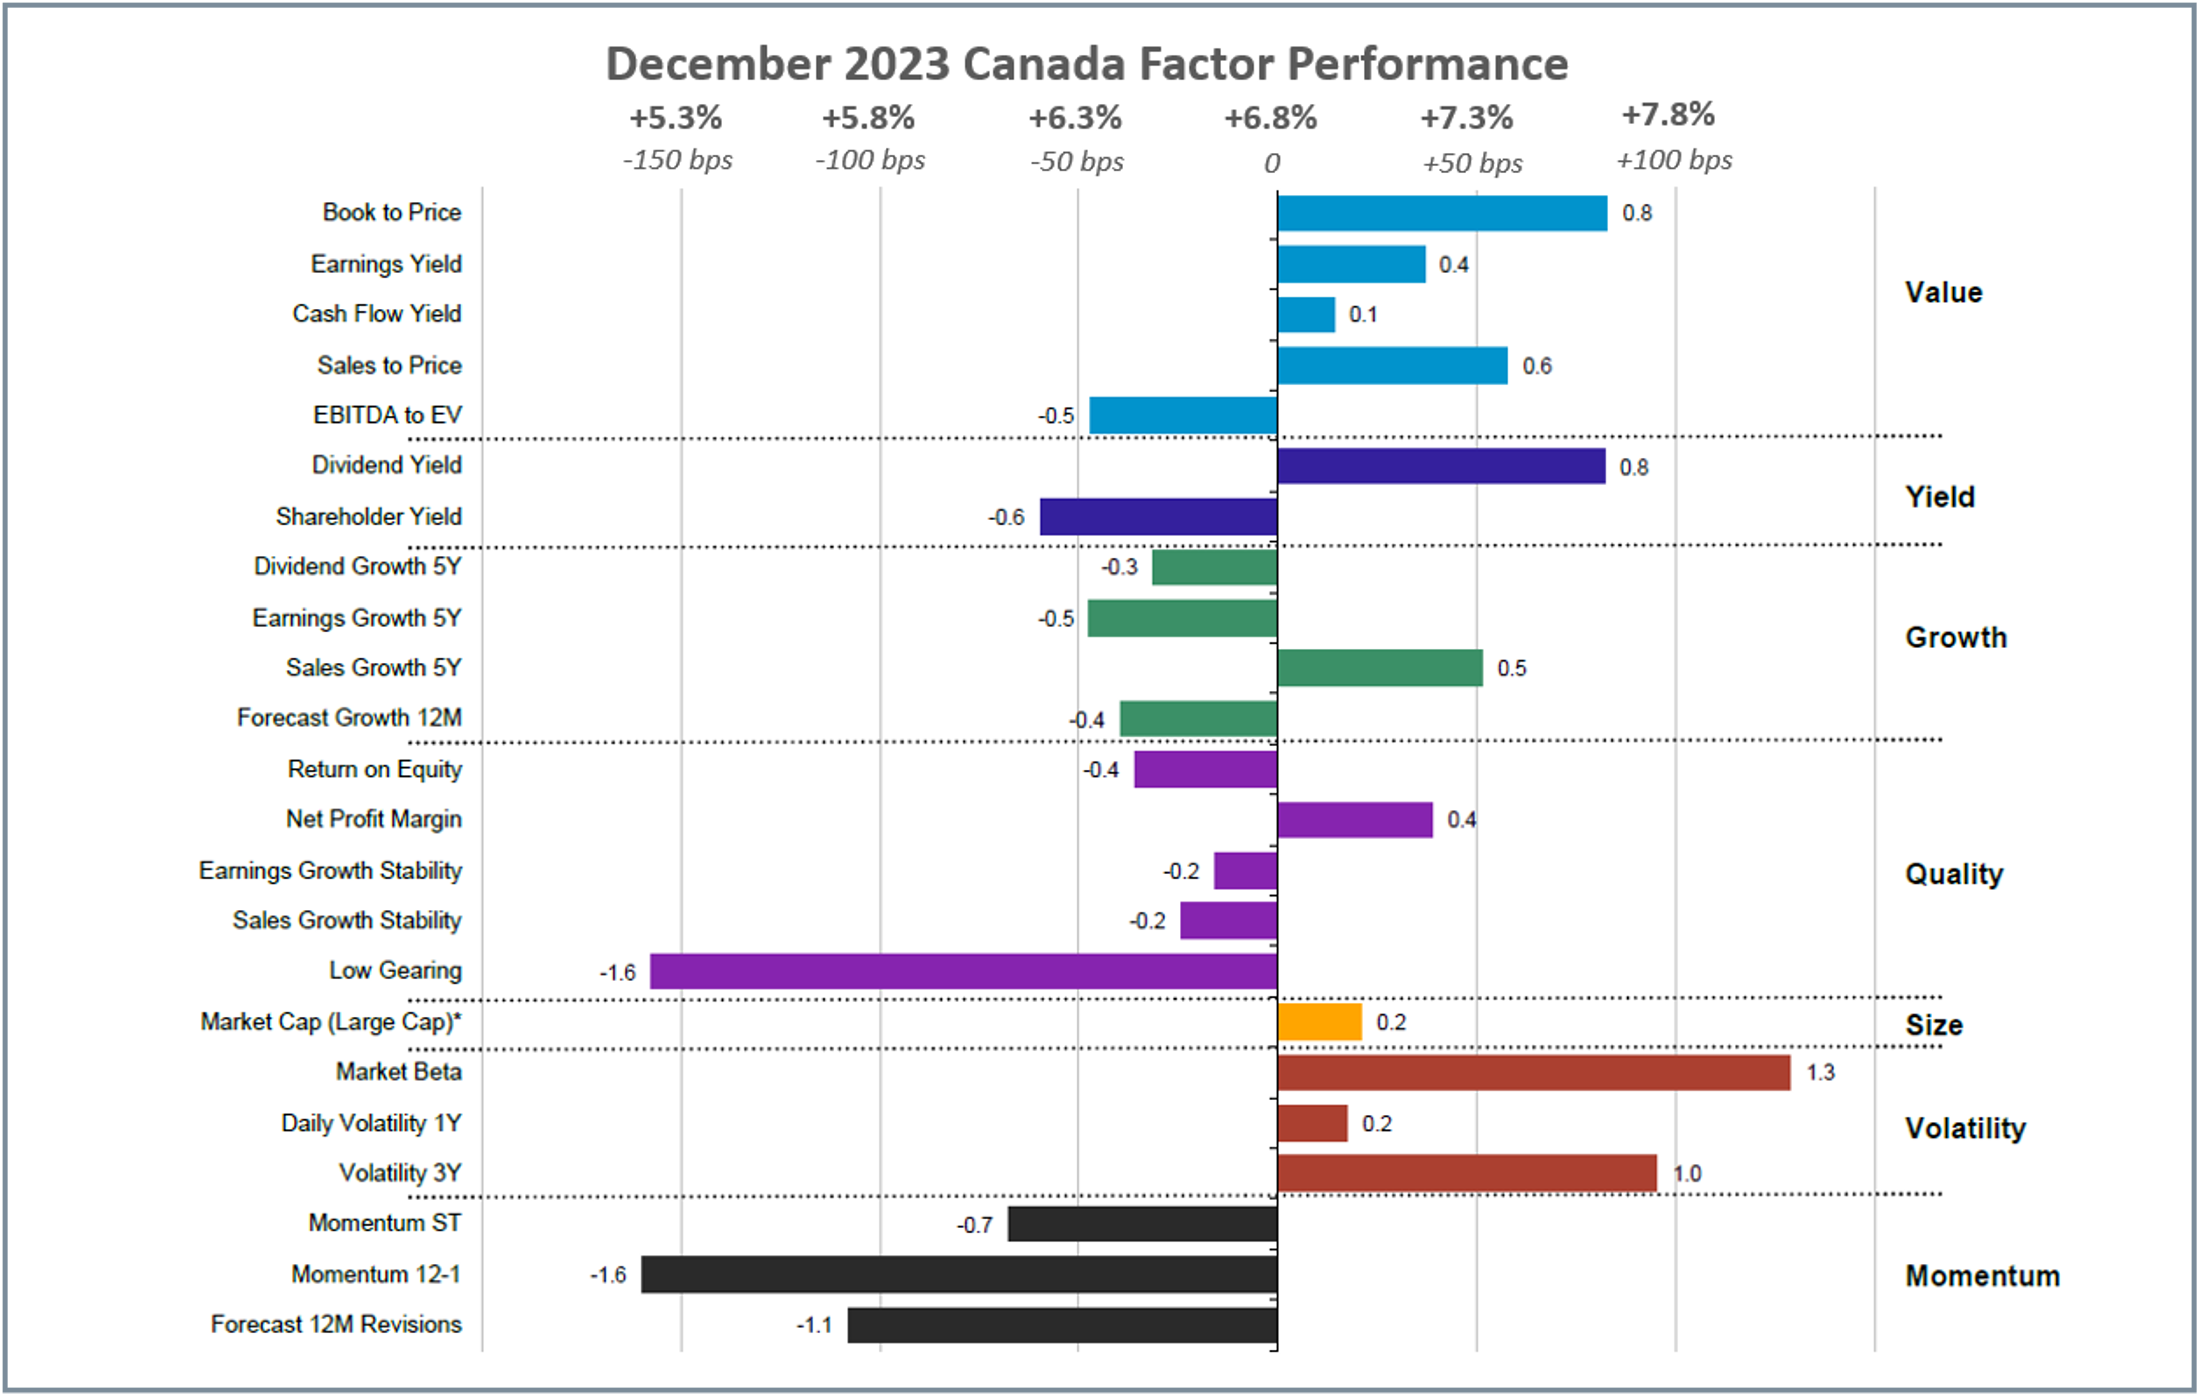
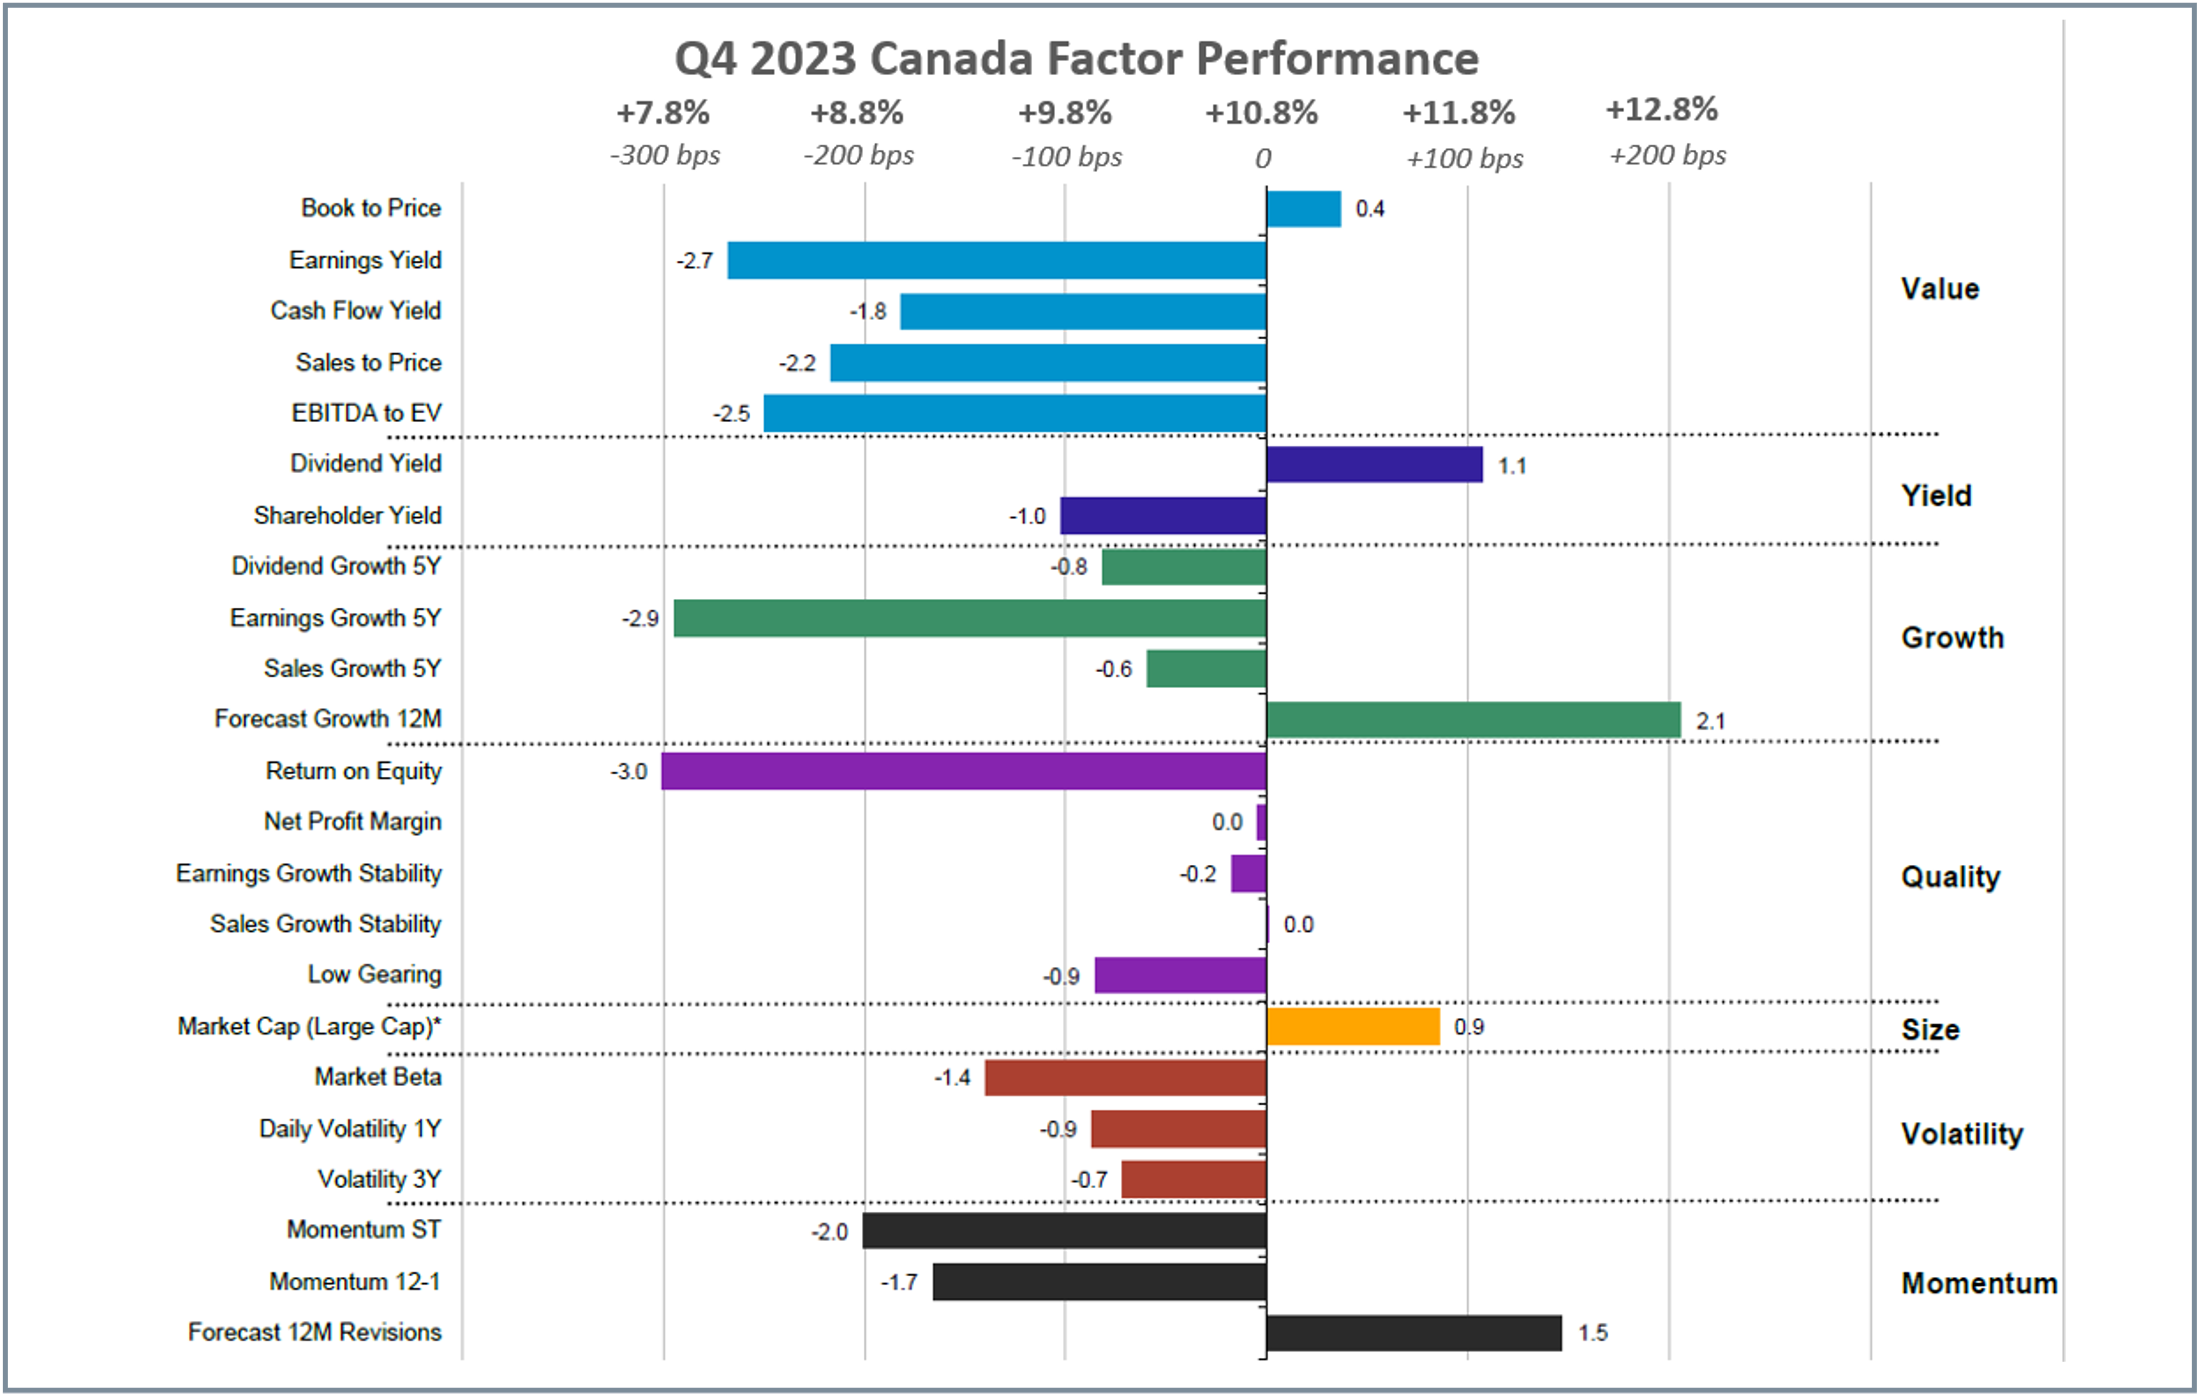
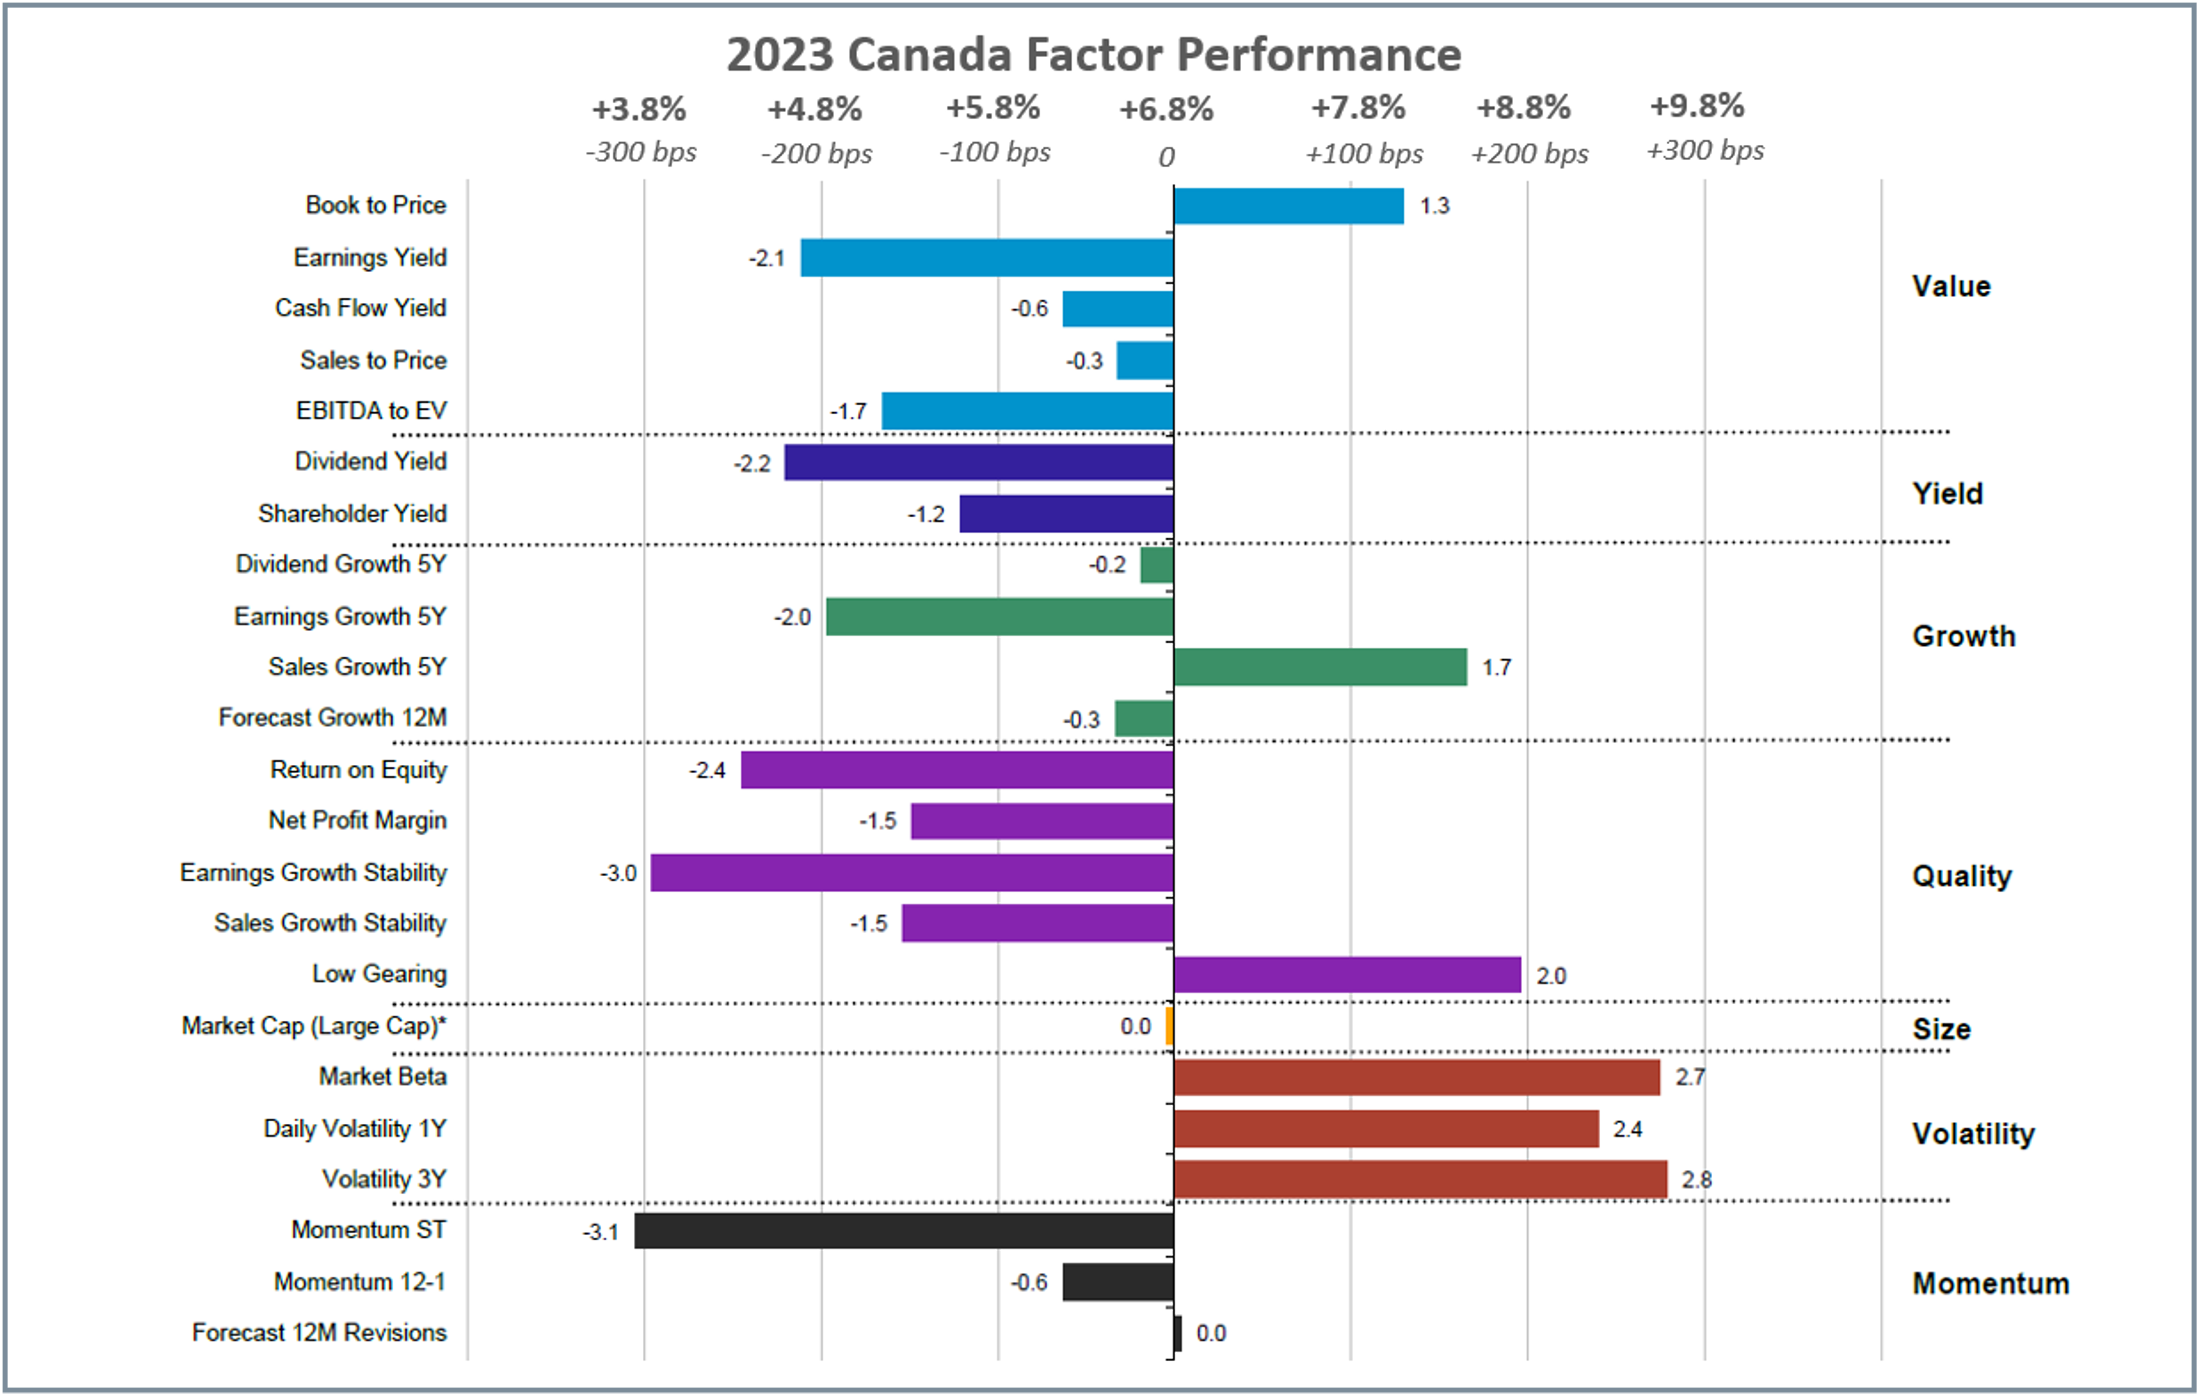
- Canadian Equities: Forecast growth outperformed in Q4, which led to Volatility, low gearing, and sales growth to outperform in 2023.
US Equities
Despite recent optimism, the recent market surge is concentrated, with the majority attributed to the “Magnificent 7” tech stocks. Signs suggest a potential rally broadening, as Invesco’s equal-weighted S&P 500 ETF recorded a record $10B net inflow in 2023, $3B of which occurred just in December. However, without any material changes to anti-trust laws in the US, the Large Cap rally may continue further.
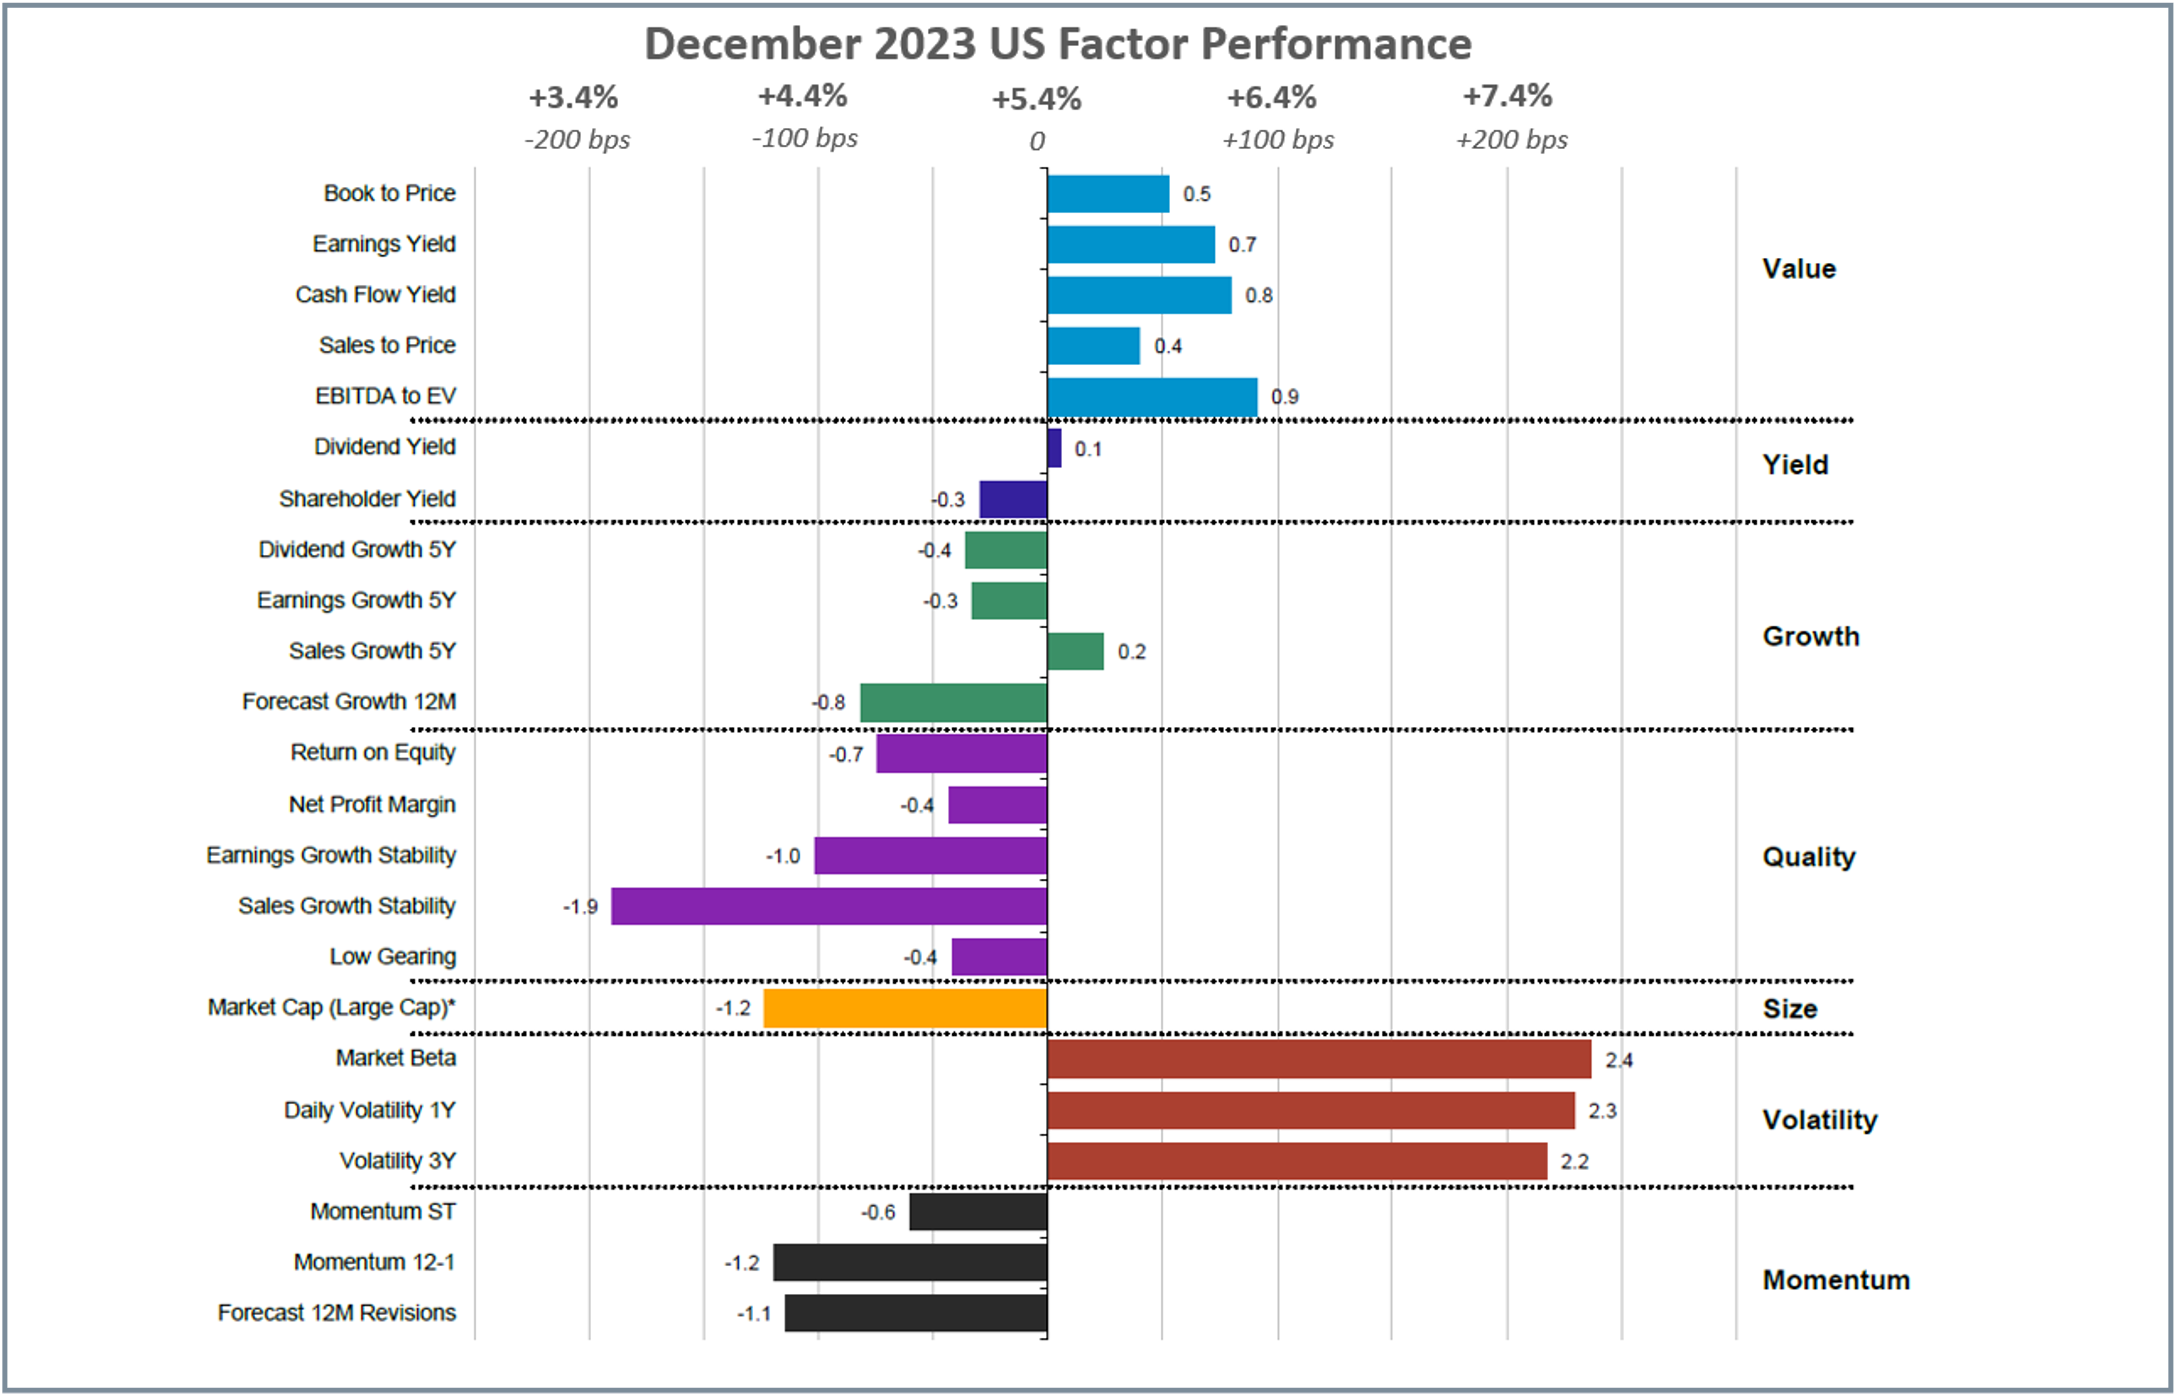
Concentration risk is evident in the factor performance trends for Volatility and Large Cap, but the overall trend reflects optimism. In December and Q4, Volatility surpassed other subfactors to lead in the quarter and for all of 2023. The trends closely echo 2020 but are more conservative. The current emphasis on realized earnings and sales growth, with interest rates above 4%, diverges from 2020’s focus on high-beta and forecasted growth. This shift in subfactor performance signals a maturing and pragmatic approach to a promising 2024.
Daily Volatility over one year (or short-term Volatility) outperformed the other Volatility subfactors, led by tech stocks like AMD and Broadcom, which respectively returned 43% and 35% in Q4, two-thirds of which occurred in December.
Source: Investment Metrics, a Confluence company.
Source: Investment Metrics, a Confluence company.
Source: Investment Metrics, a Confluence company.
European Equities
A noticeable contrast with the US emerges when examining the factor performance trend in Europe, the UK, and Emerging Markets. Value and Yield maintained dominance throughout 2023, aligning with patterns observed in 2022. The spotlight on shareholder yield performance indicates investors’ focus on companies with robust balance sheets actively reducing debt, repurchasing stock, and offering competitive dividend yields.
The factor trend lines up with economic indicators, as the European Union’s inflation rate has consistently decreased each month in 2023, starting at 10% in January and closing off the year at just 3.1%, resulting in an average inflation rate of 2.43% between 2000-2023. Core inflation, though more intricate, has also receded during Q3 and Q4, declining from 6.19% in June to 4.12% in November.
While the German Manufacturing PMI remains in contractionary territory, its upward trend suggests that the worst of that sector’s downturn is likely behind us. In contrast to the US, consumer spending in Germany has stagnated through 2023. However, there are positive signs as building permits, after a year-long slump, have started to pick up, although they remain below pre-pandemic averages.
Additionally, European energy prices remained stable and even decreased from just above €100/MWh to approximately €95/MWh by November. This stability reflects a more controlled and predictable environment going into 2024, in contrast to the chaos from 2022.
Notable outperformers include many German companies like tech firm Siemens (+30% in Q4), shipping company Hapag Lloyd (+19% in December), and chemical producer BASF SE (+15% in December and +18% in Q4).
Source: Investment Metrics, a Confluence company.
Source: Investment Metrics, a Confluence company.
Source: Investment Metrics, a Confluence company.
UK Equities
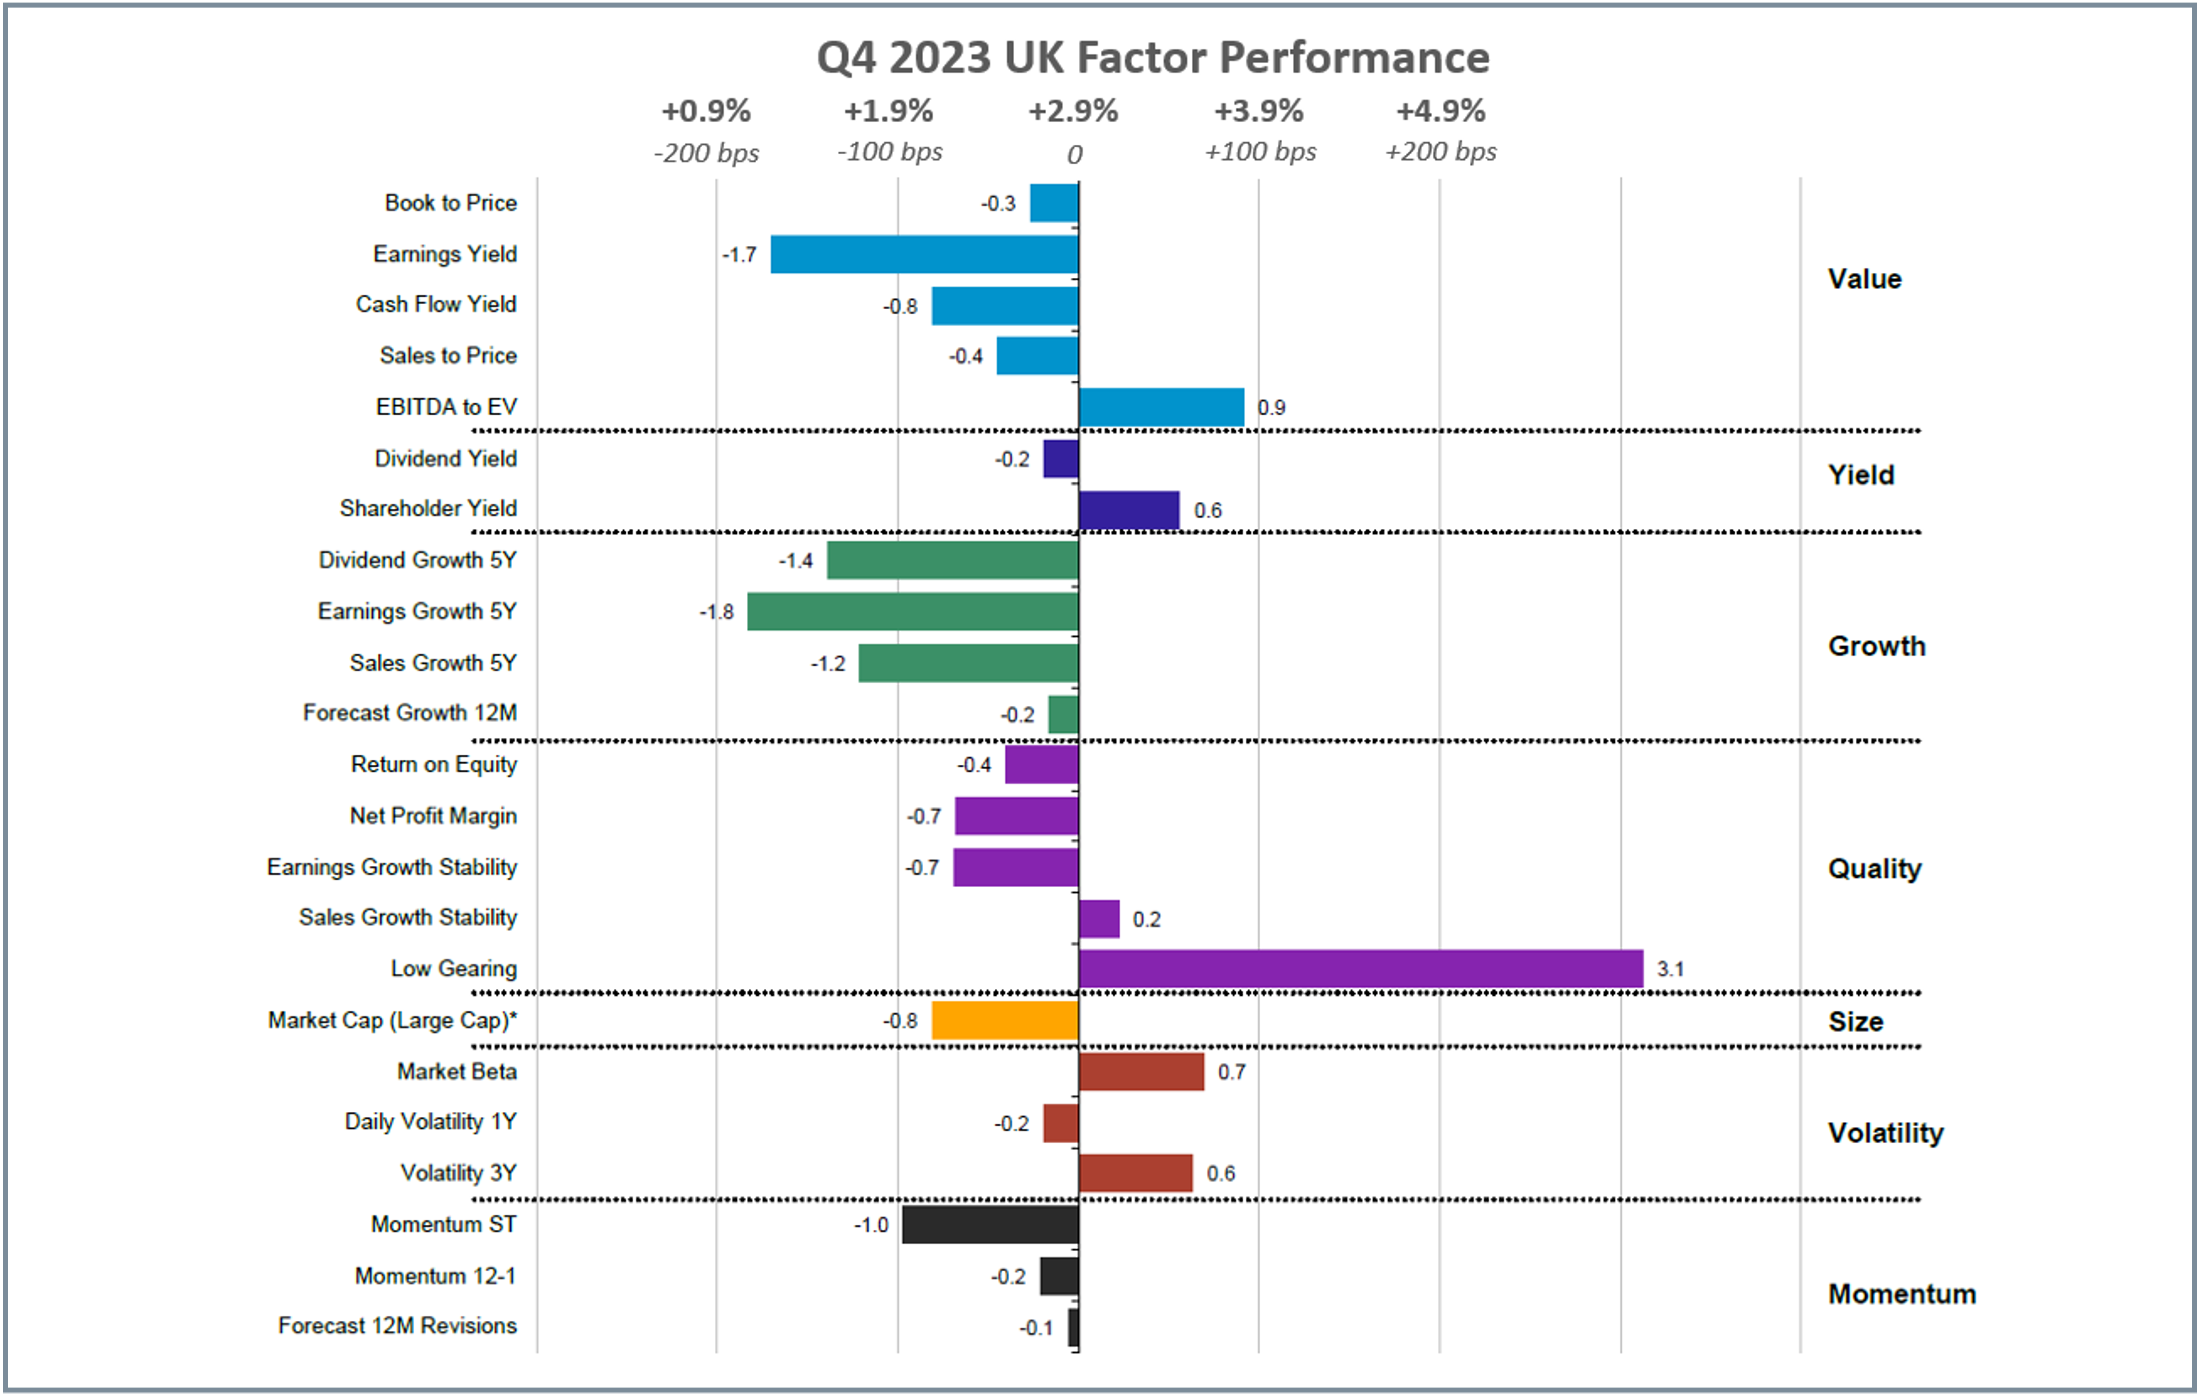
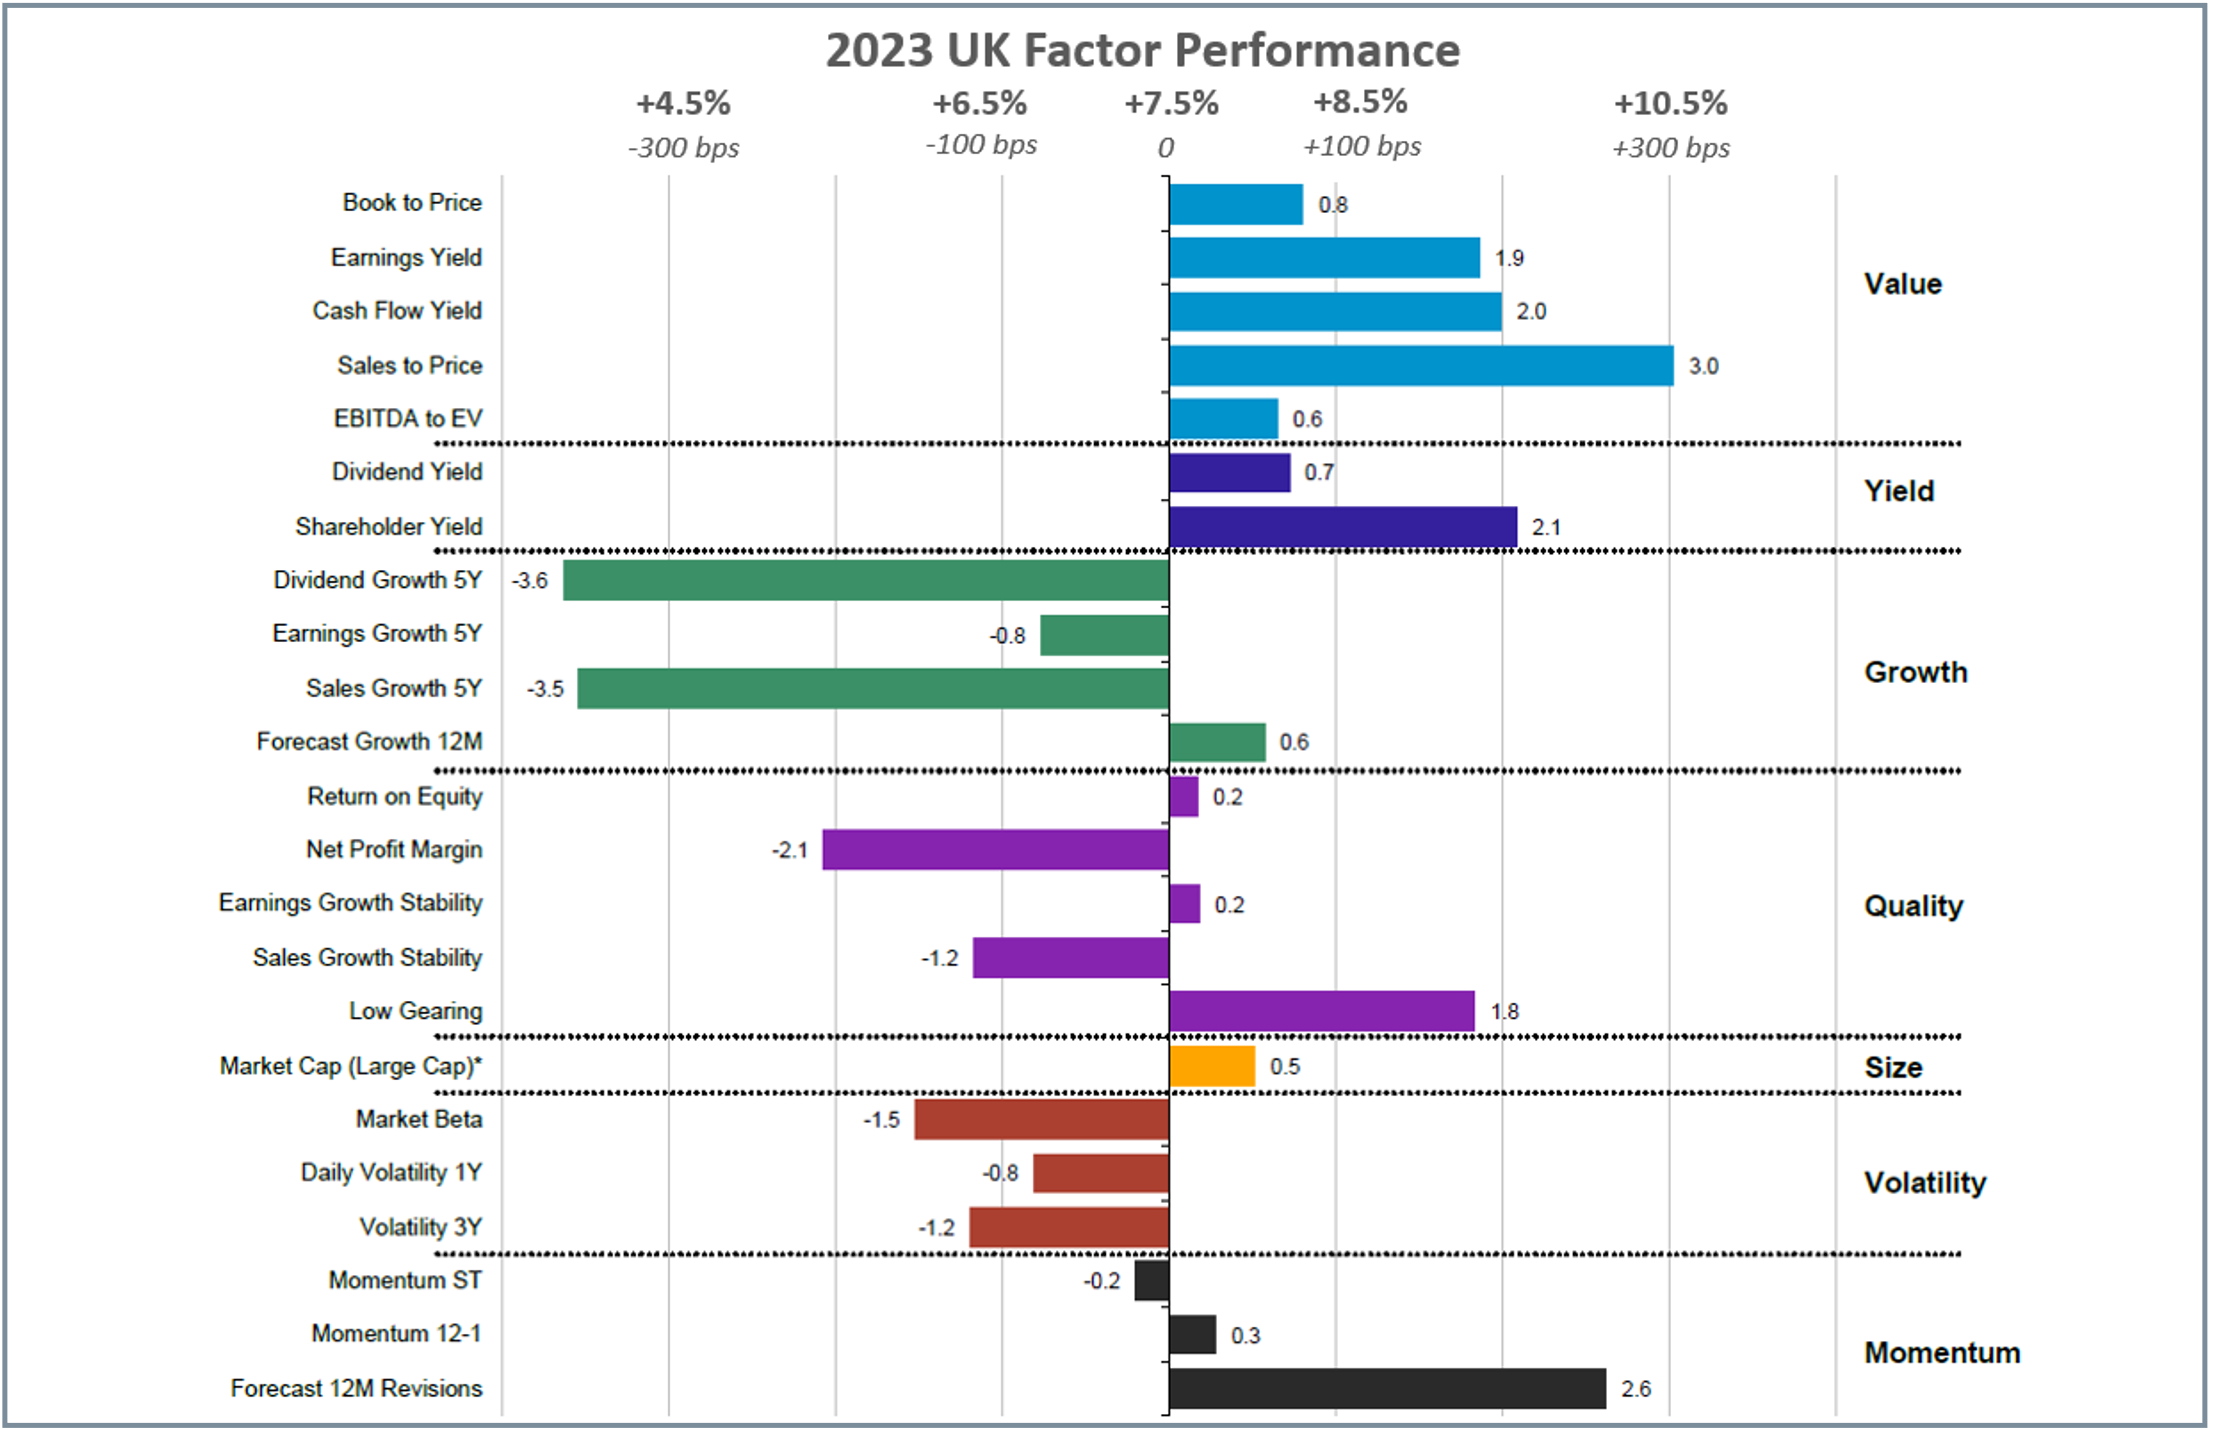
In contrast to Europe’s factor agnostic Q4, the UK exhibited more pronounced factor premiums, reaching up to 300bps compared with Europe’s 50bps. The spotlight on the low-gearing subfactor, present throughout the year in many regions, became particularly prominent in December and Q4, as few other factors offered substantial premiums in the UK market. On an annual basis, Growth, proxied by sales growth, and Value, proxied by sales to price, emerged as perfect substitutes, with the former underperforming by 300bps while the latter outperformed by 300bps.
Like the European Central Bank, the Bank of England (BOE) was less dovish than the Federal Reserve regarding its potential rate cuts next year. Despite this, the BOE’s outlook remained positive. The comments mirror the situation in terms of inflation since the UK economy is still running hotter than the US or Europe, boasting an inflation rate of 4.1% and a core rate of 5.1% as of November. Inflation data suggests that the UK is still navigating the “soft landing,” albeit slightly lagging behind its developed counterparts.
Value equities from a sales-to-price perspective that helped Value outperform in the region include Rolls Royce (+41% in Q4); Airspace company BAE Systems (+18% in Q4); energy firm SSE PLC (+20% in Q4) and grocery retailer Tesco (+17% in Q4).
Source: Investment Metrics, a Confluence company.
Source: Investment Metrics, a Confluence company.
Source: Investment Metrics, a Confluence company.
Emerging Market Equities
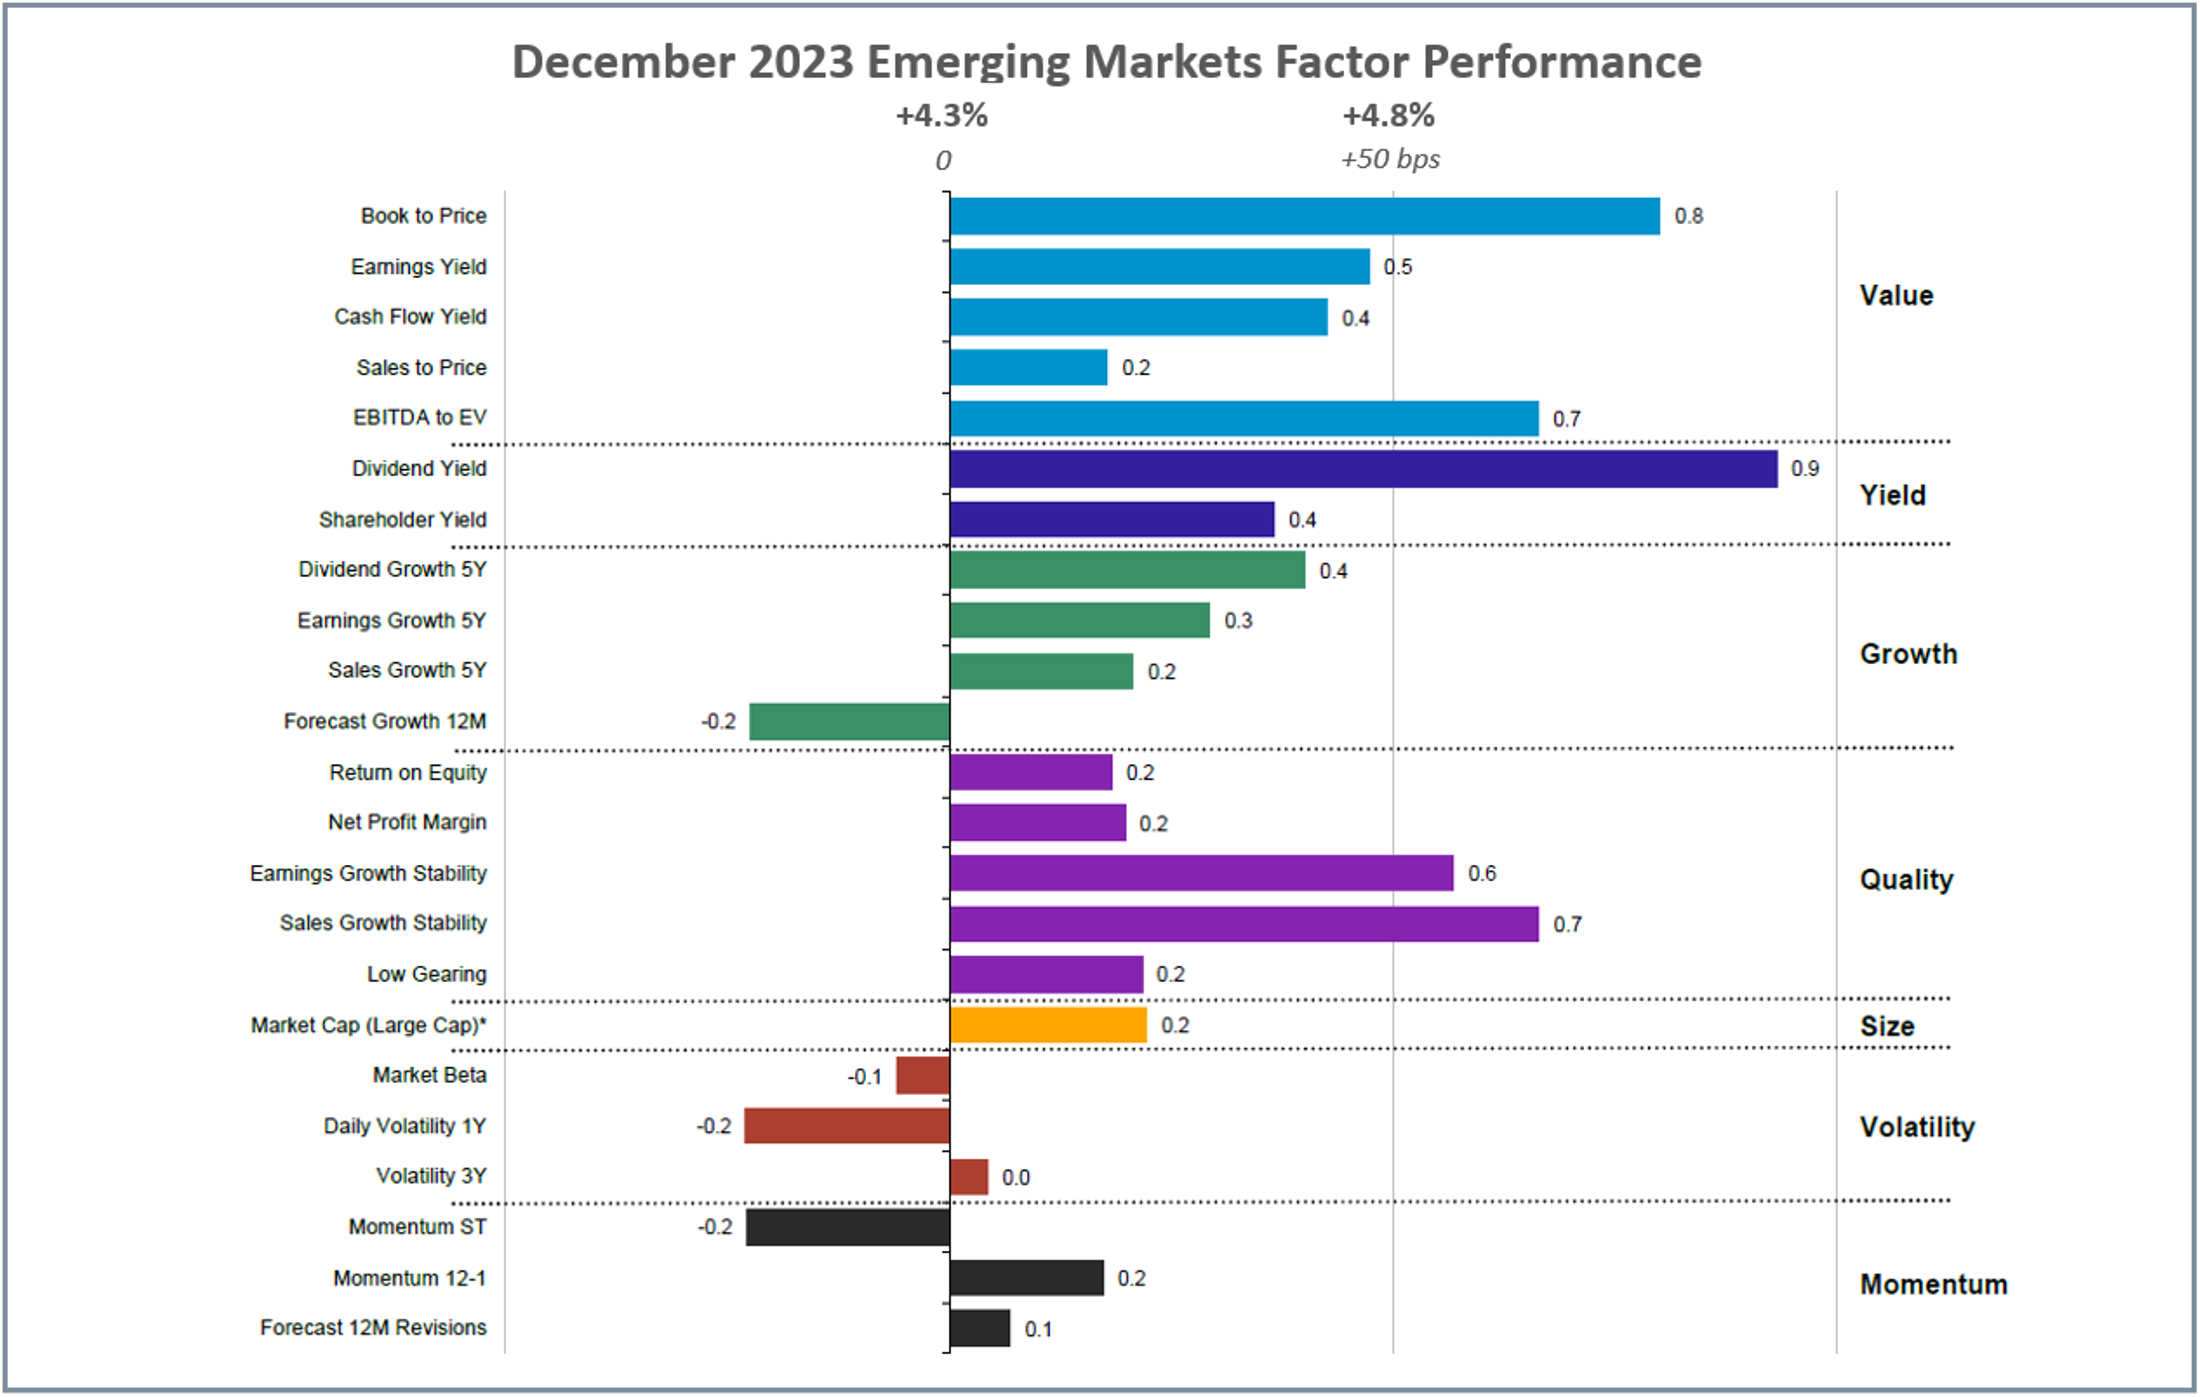
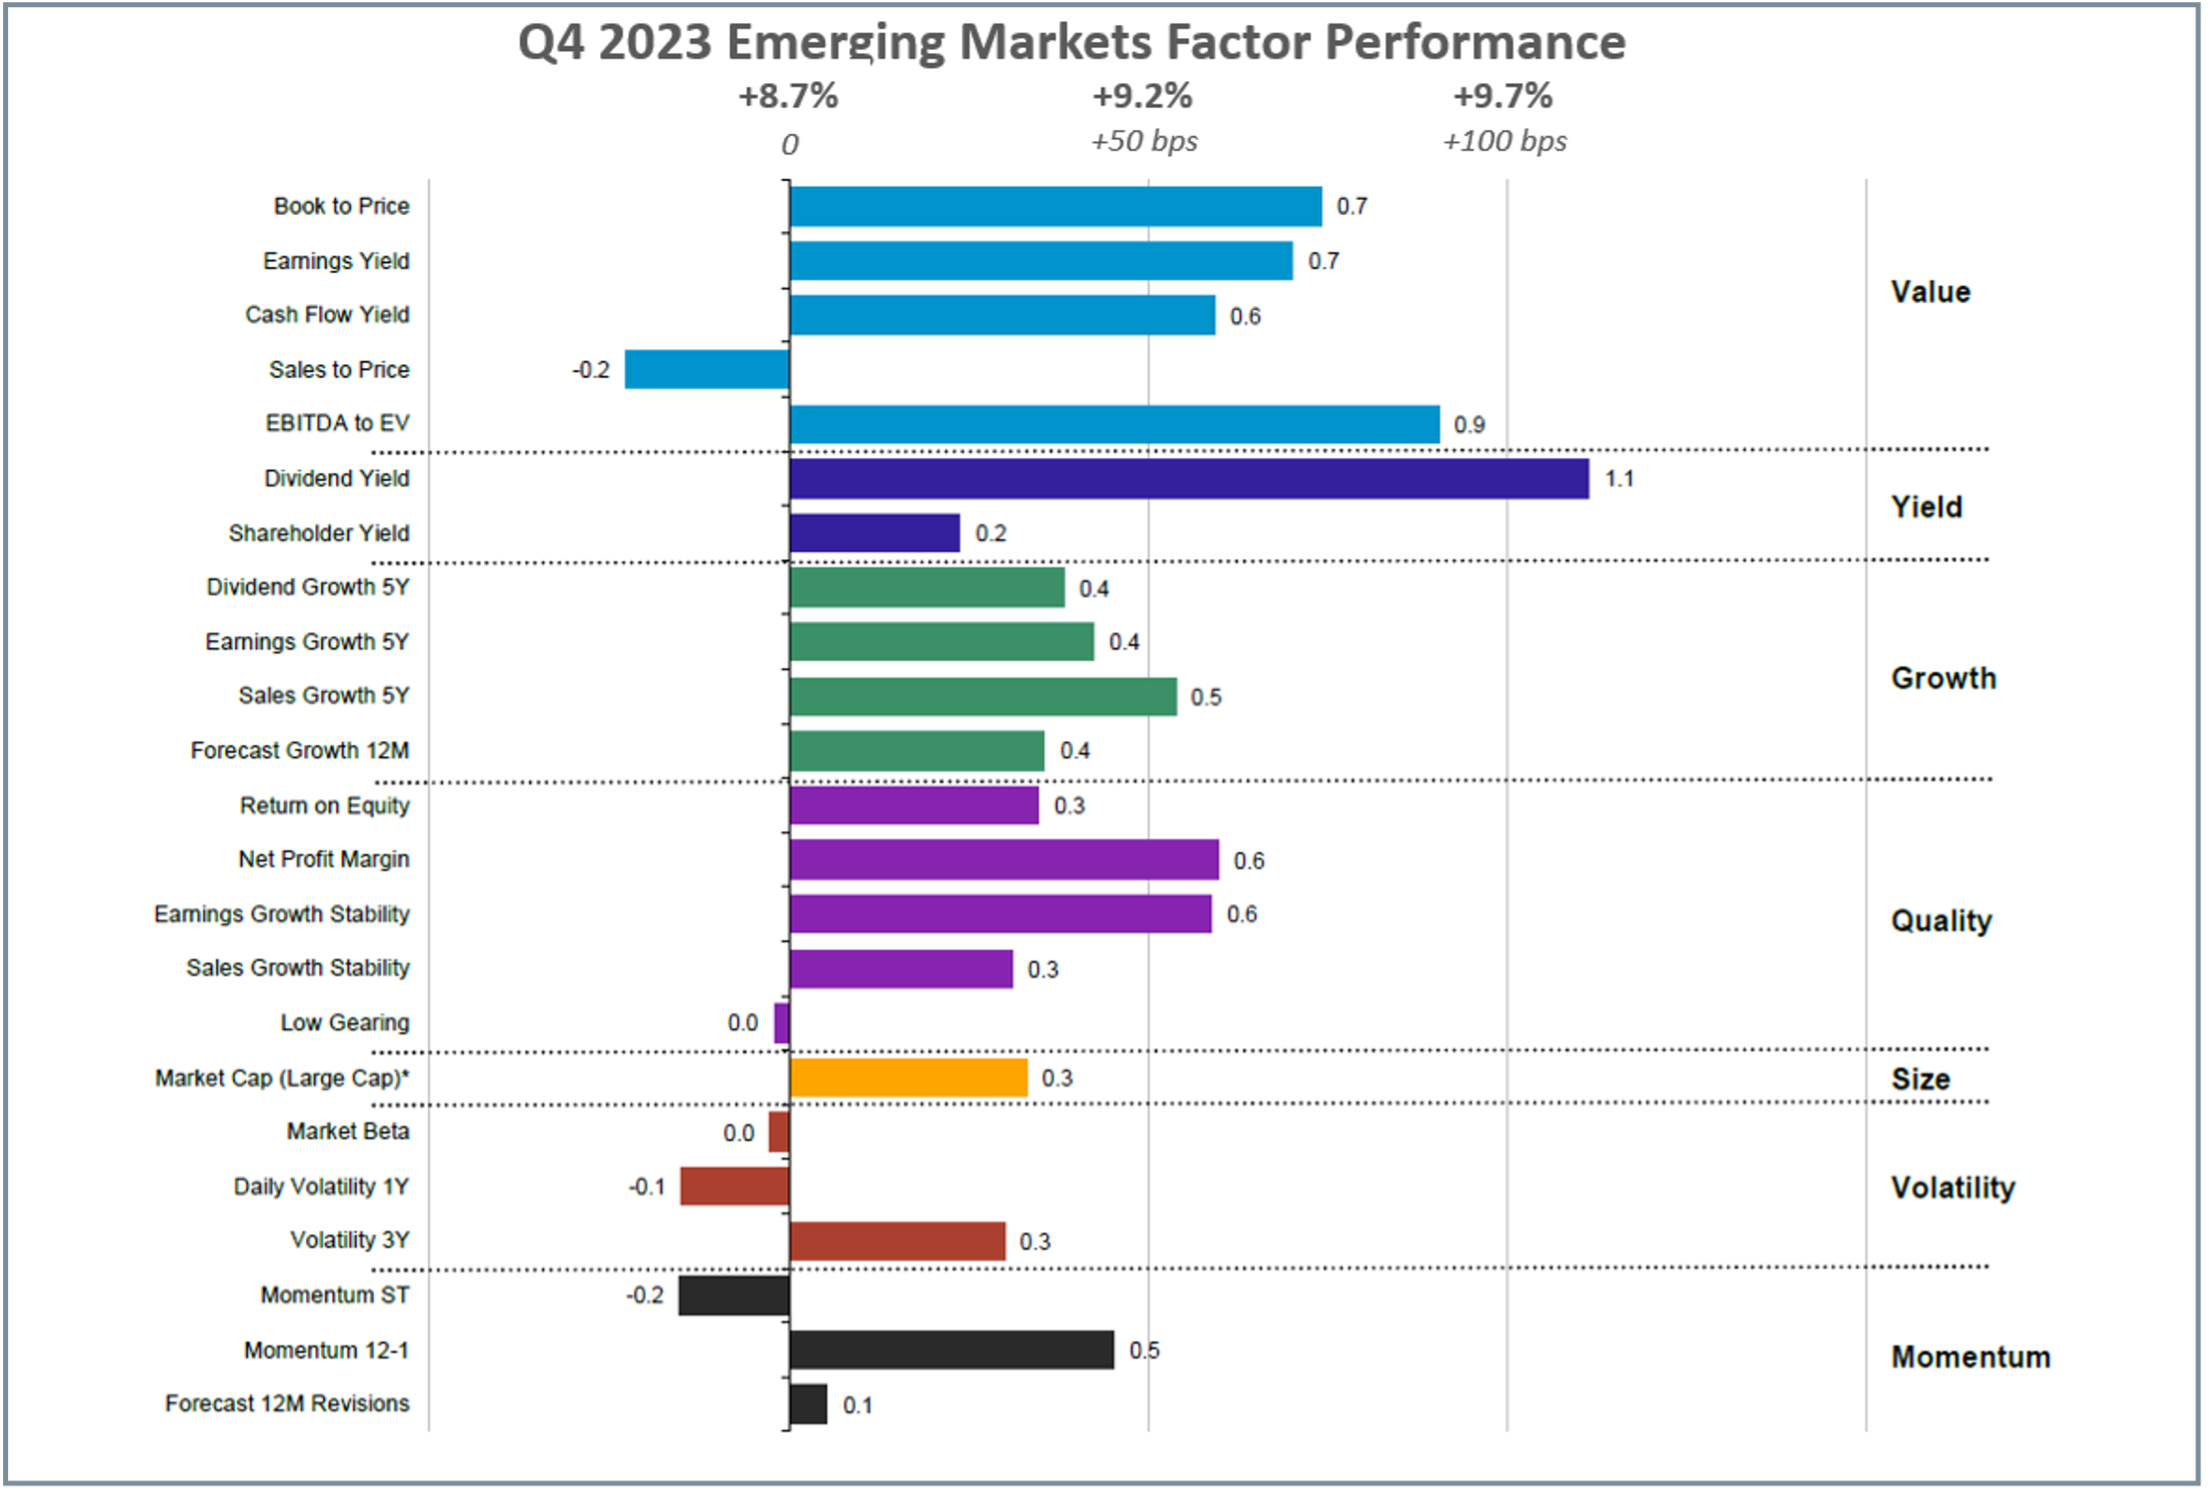
Consistent with the region’s trend over the last few years, the factor premium tends to be positive. It’s only when viewed annually that a significant factor discount becomes apparent, which in 2023 takes the form of Growth and Volatility, which underperformed by approximately 120-220bps.
Investors seem to be focused on smaller Value companies that also have robust dividend yields. Unlike Europe and the UK, investors in Emerging Markets are steering clear of shareholder yield, which includes net buybacks and debt paydown, placing a greater focus on companies capable of making consistent dividend payments. A notable development in the last quarter has been an increase in stocks with high sales growth. This renewed focus on Growth comes with a key caveat – an emphasis on the stability of the said sales growth, unlike what was observed in the US during the onset of the Covid pandemic.
From a book to price perspective, companies like Chinese tech manufacturer Xiaomi Corp (+30% in Q4);
Indian defense company Hindustan Aeronautics (+45% in Q4); Taiwanese semi-conductor manufacturer MediaTek Inc (+45% in Q4) and Indian Oil Corporation (+49% in Q4) led the outperformance observed in Emerging Markets Value equity.
Source: Investment Metrics, a Confluence company.
Source: Investment Metrics, a Confluence company.
Source: Investment Metrics, a Confluence company.
Canadian Equities
Despite Value’s marginal outperformance in December, this does not translate when examined from a quarterly or annual perspective. Quarterly data supports the growth picture, with the forecast growth subfactor outperforming by 210 bps. However, even with this robust pattern, the Canadian market underperformed even the UK in 2023, which lagged the US, Europe, and Emerging Markets.
Beyond Volatility, despite a general underperformance by the remaining factors, a distinctive trend emerges from the annual data. Companies with impressive book to price ratios and strong sales growth over five years have outperformed the market. Notably, these two subfactors are the only in their category to do so. Similarly to the UK, Canadians also preferred companies with low levels of debt relative to their equity.
The companies that led Canadian Volatility to outperform include banks like Bank of Montreal (+21% in December); Canadian Imperial Bank of Commerce (+26% in Q4, +18% in December); Brookfield Corp (+28% in Q4); Shopify Inc. (+42% in Q4).
Source: Investment Metrics, a Confluence company.
Source: Investment Metrics, a Confluence company.
Source: Investment Metrics, a Confluence company.
Appendix: How to read the charts
For example, for the book-to-price factor, we determine the period’s performance of the basket of stocks with the highest book-to-price values, relative to the total market. Each factor is analyzed independently, market and fundamental data are adjusted to enable sector-average (within each country) relative data to be used, and the performance measurement isolates the factor’s contribution to return.
Disclaimer
The information contained in this communication is for informational purposes only. Investment Metrics, a Confluence company, is not providing, legal, financial, accounting, compliance or other similar services or advice through this communication. Recipients of this communication are responsible for understanding the regulatory and legal requirements applicable to their business.

