2023
Active Developed Market Equity Fee Study
by:
Executive Summary
Data & Methodology
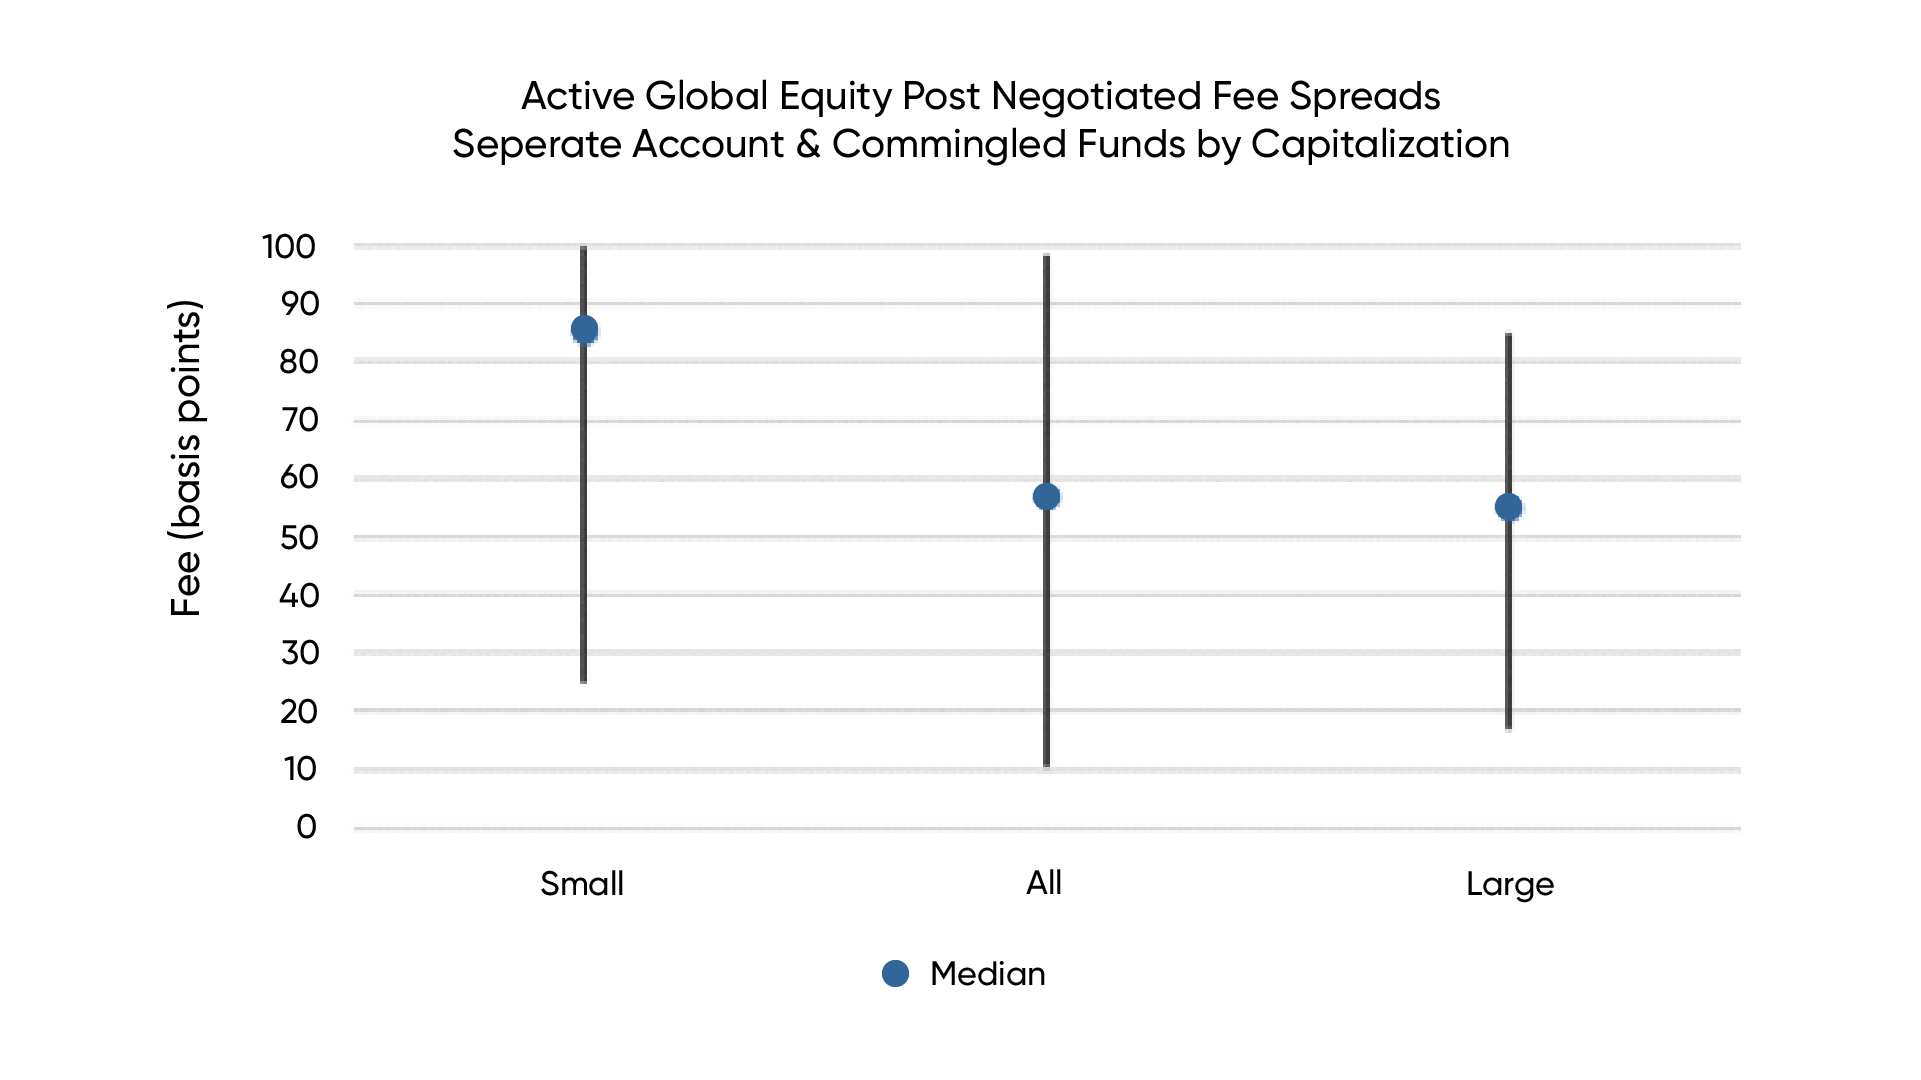
The report is based on actual post-negotiated fees, not listed fees, for separate accounts and commingled funds. We examined fees as of Q4 2023 by capitalization and style across U.S., International, and Global equity mandates. All accounts were actively managed.
Highlights
- Across developed market equities, a premium is paid for active small-cap averaging greater than 20 basis points.
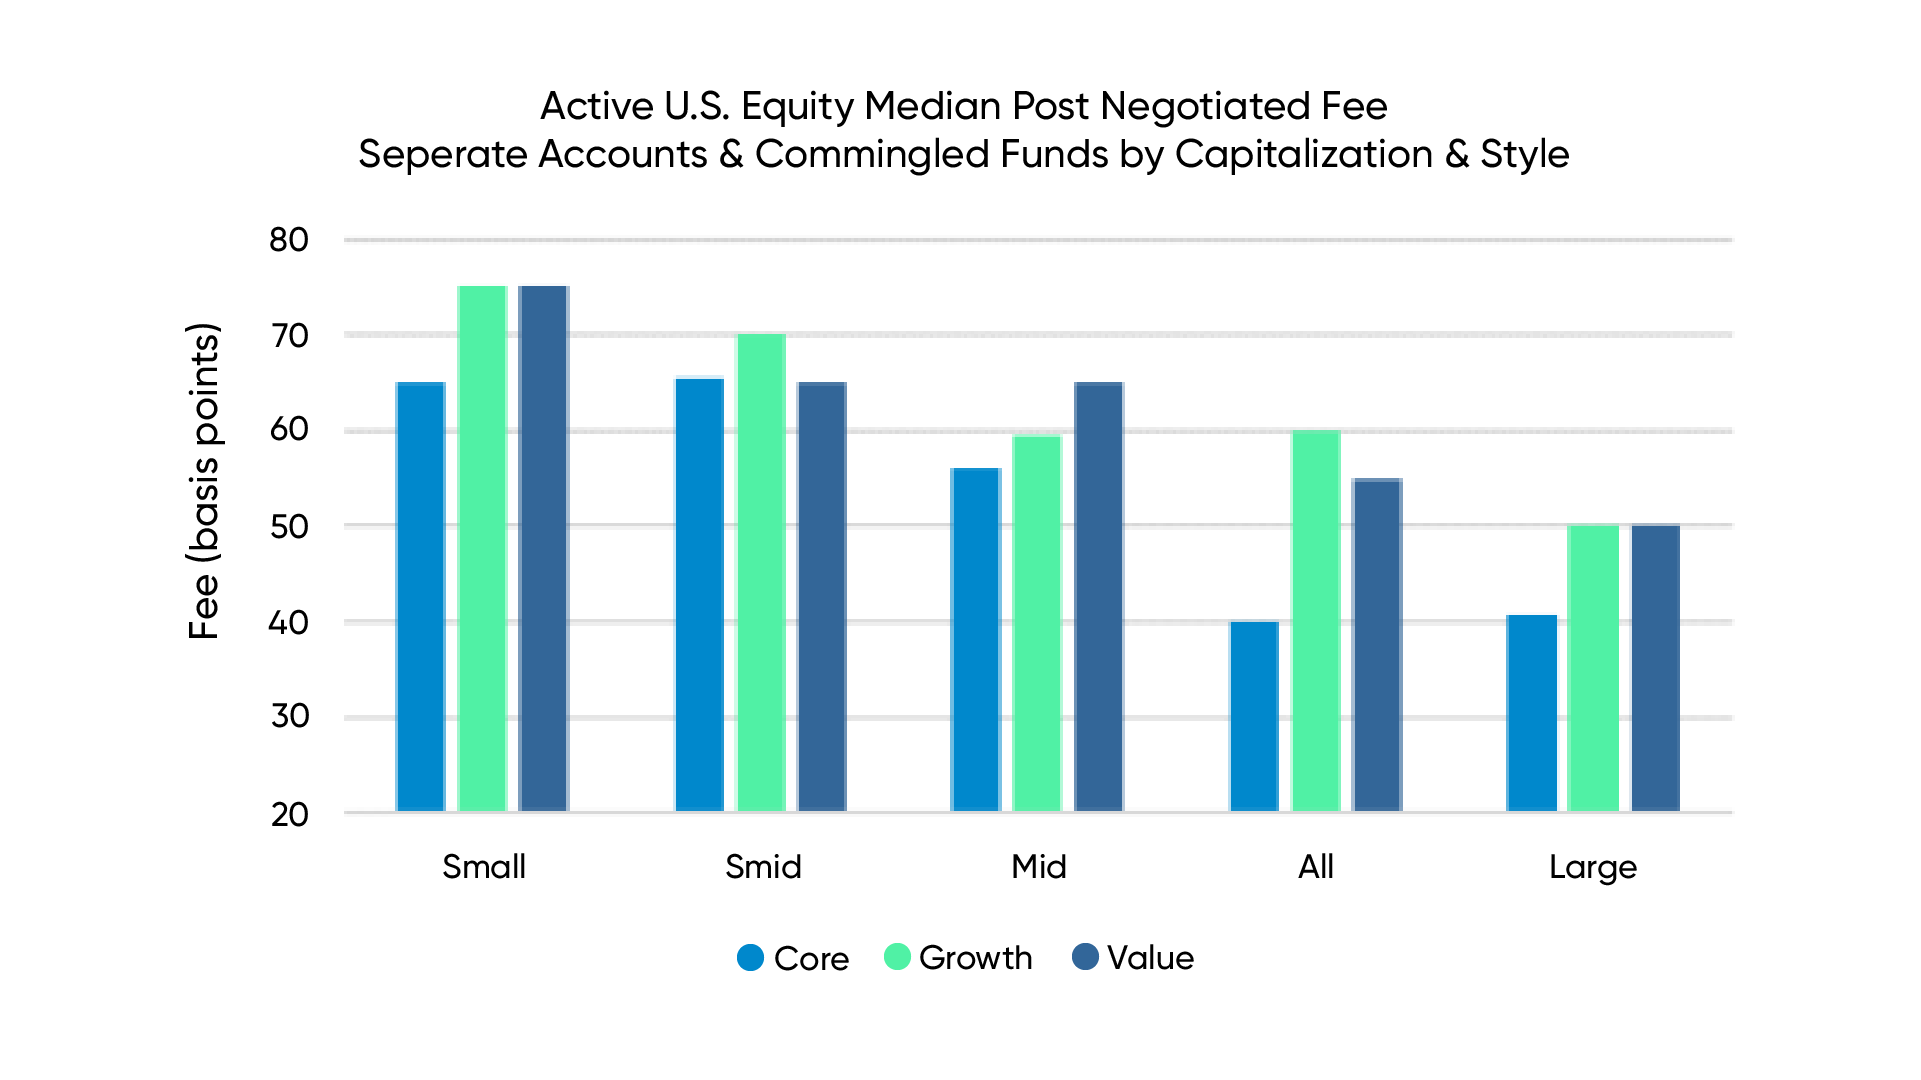
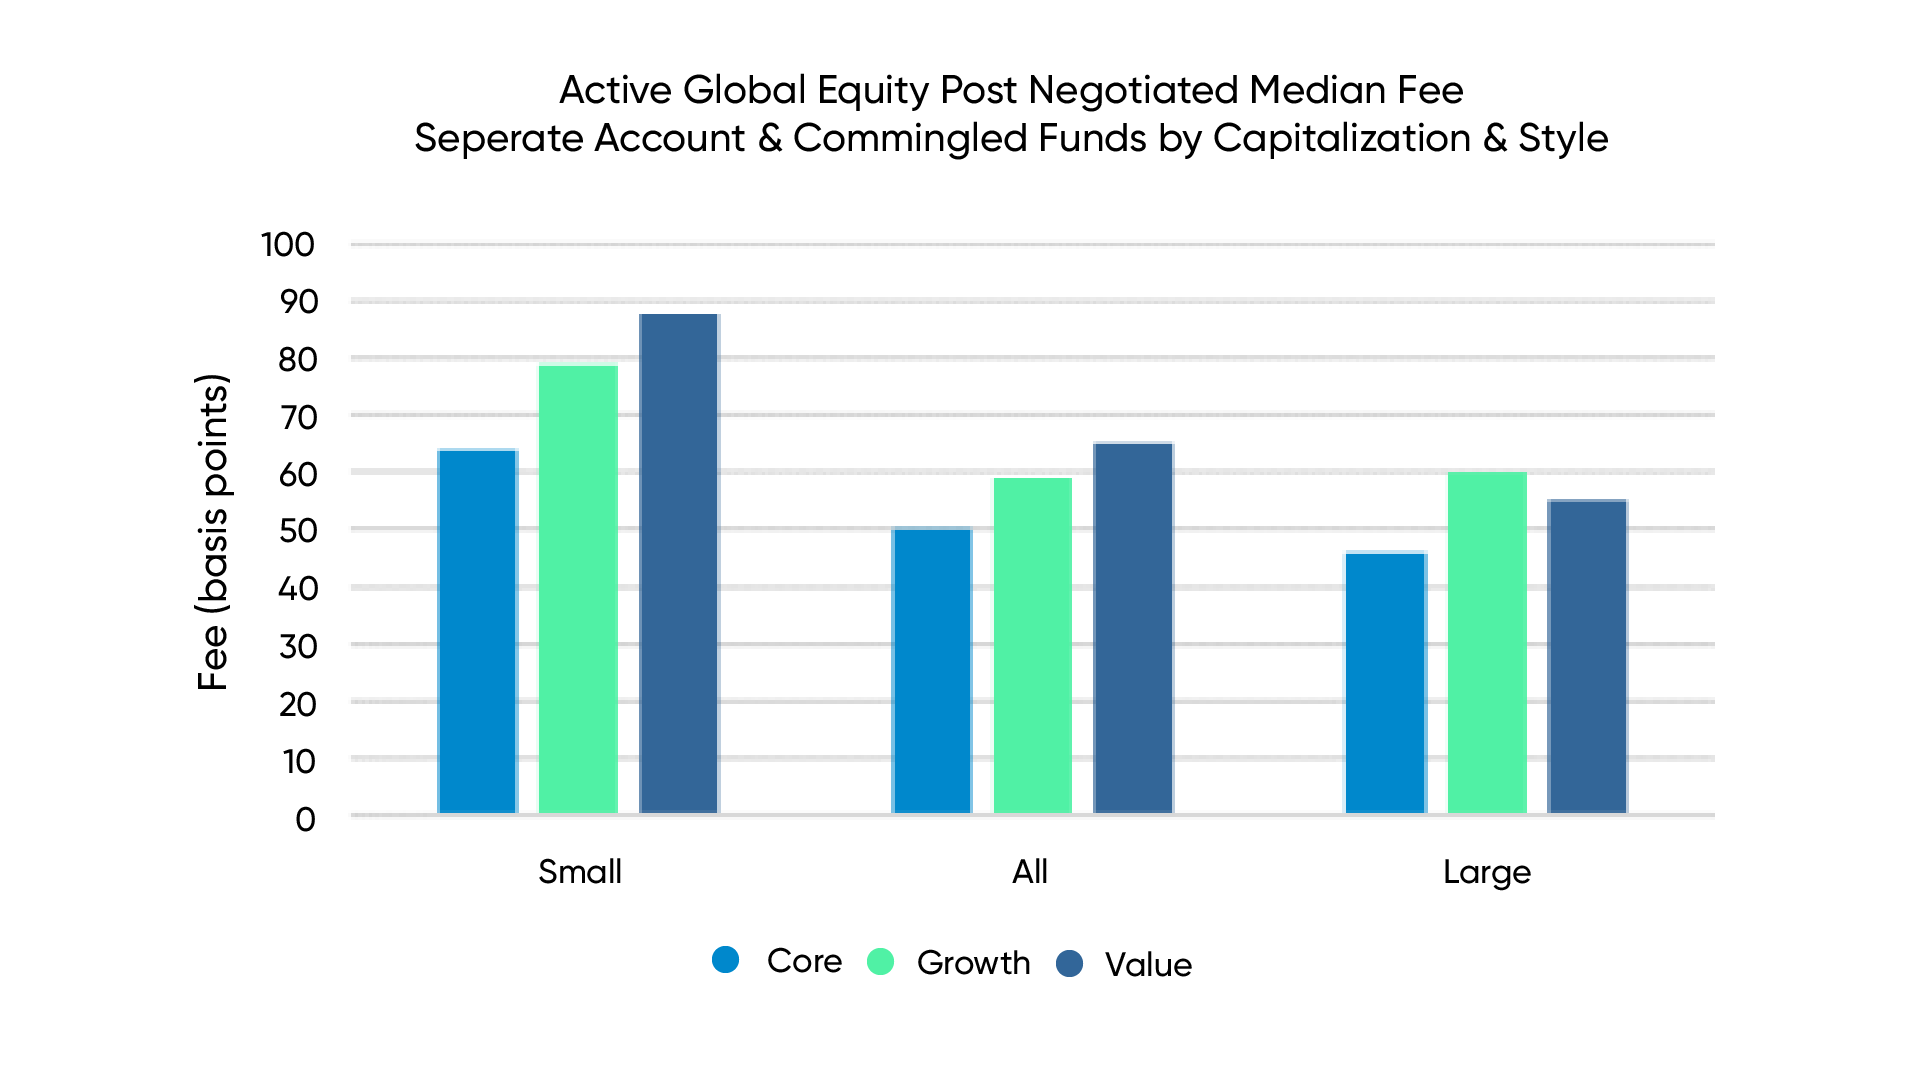
- There is no premium paid within U.S. large-cap equity by style. However, there is for International value and Global growth.
- There is a premium paid for all cap value in International & Global equity compared to U.S. equity, where the all-cap premium favors growth.
- Developed markets median fees have come down an average of 3.3% over the last three years.
- Global large-cap value has seen the greatest fee compression (10%) since 2020.
US Equities
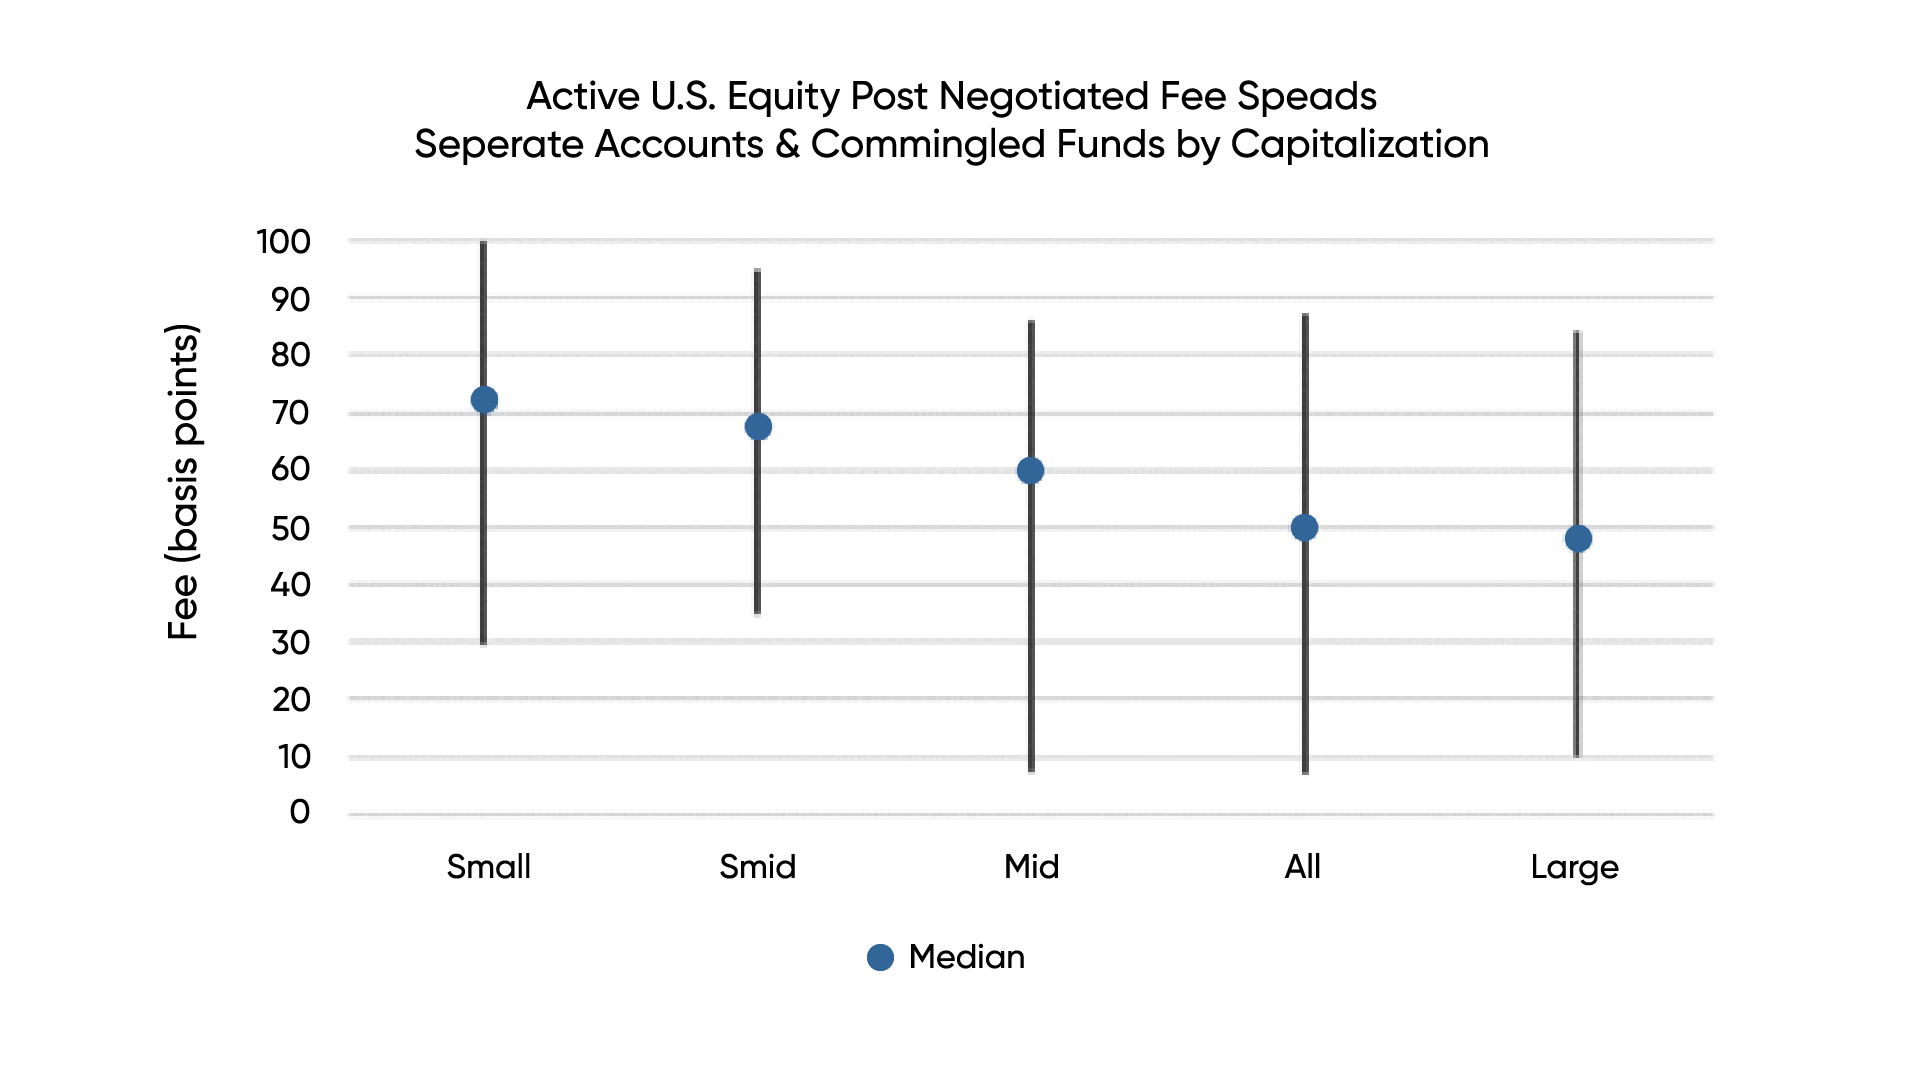
Chart 1: Active U.S. Equity Separate Account Post Negotiated Fee Spreads Capitalization
After examining the median fees by style and capitalization for active U.S. Equity, we observed an average 10-basis point premium for styles (value or growth) compared to core. While there was no difference comparing growth to value within large and small cap mandates, there is a premium paid for growth of 5 basis points within All and SMID cap. Interestingly, in the mid-cap space, we saw the opposite, as the median value fee was 5.5 basis points more than growth.
International & Global Equity Fees
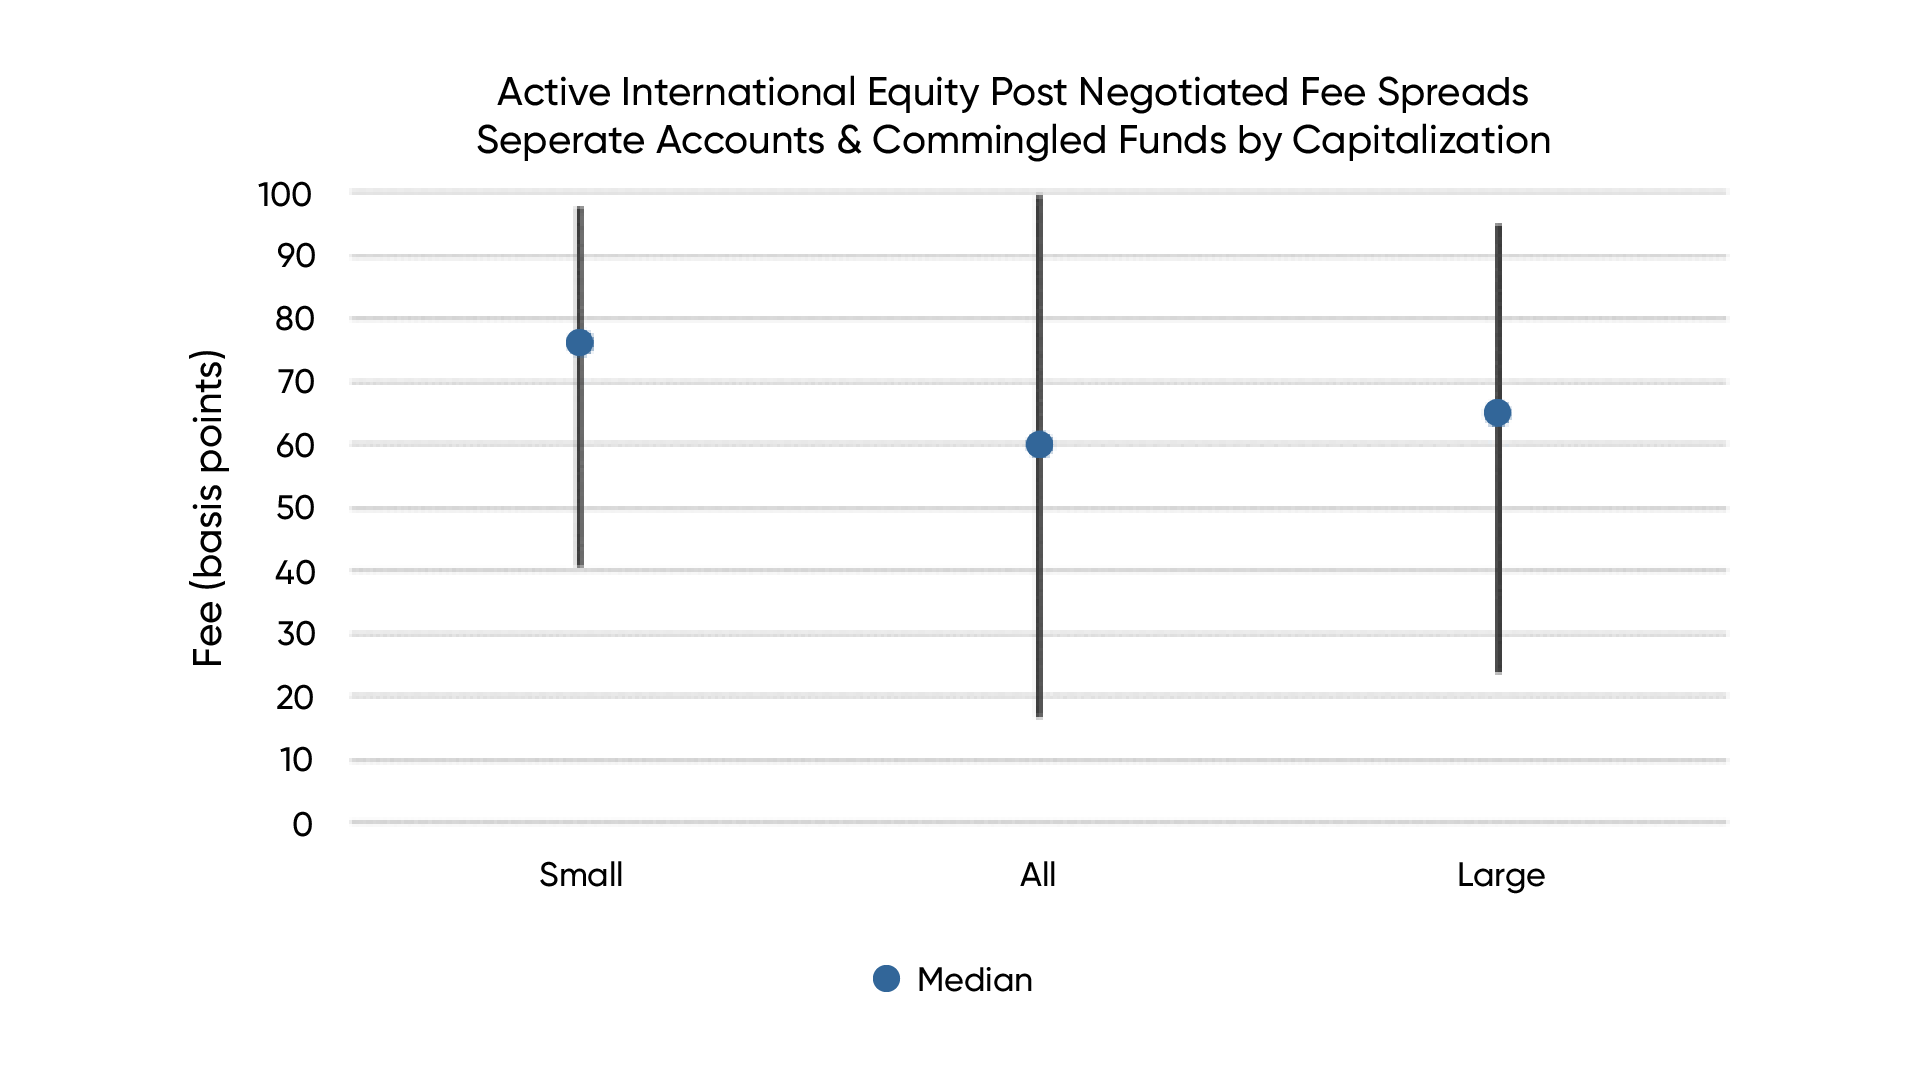
Chart 3: Active International Equity Separate Account Post Negotiated Fee by Capitalization
Within the small cap space, there were minimal differences by styles at the median level, with a slight premium for growth. Up the cap spectrum however, we observed a clear bias toward value in all and large caps.
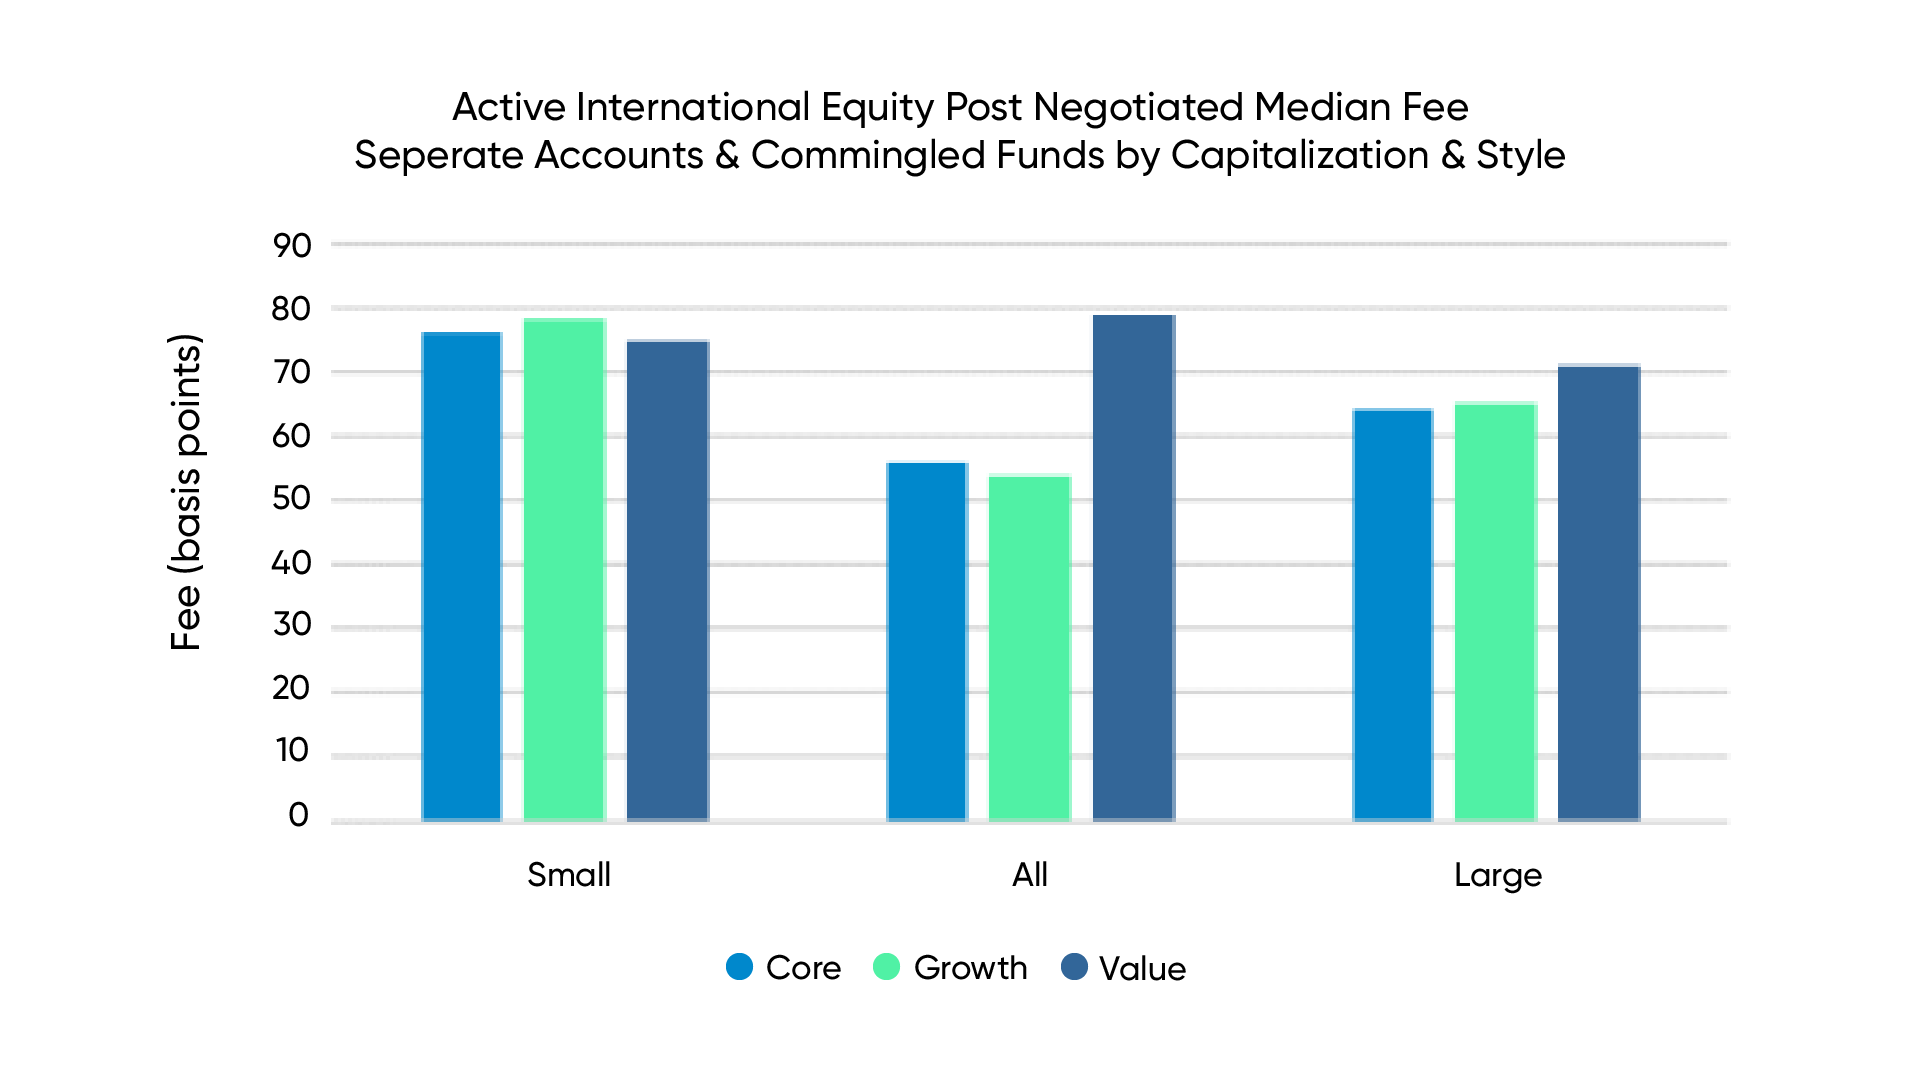
From a style perspective, there was a clear premium paid (6-8 basis points) for value over growth within small and all-cap. The opposite held within the global large cap, where we found a premium for growth.
Median Fees Compared to 2020
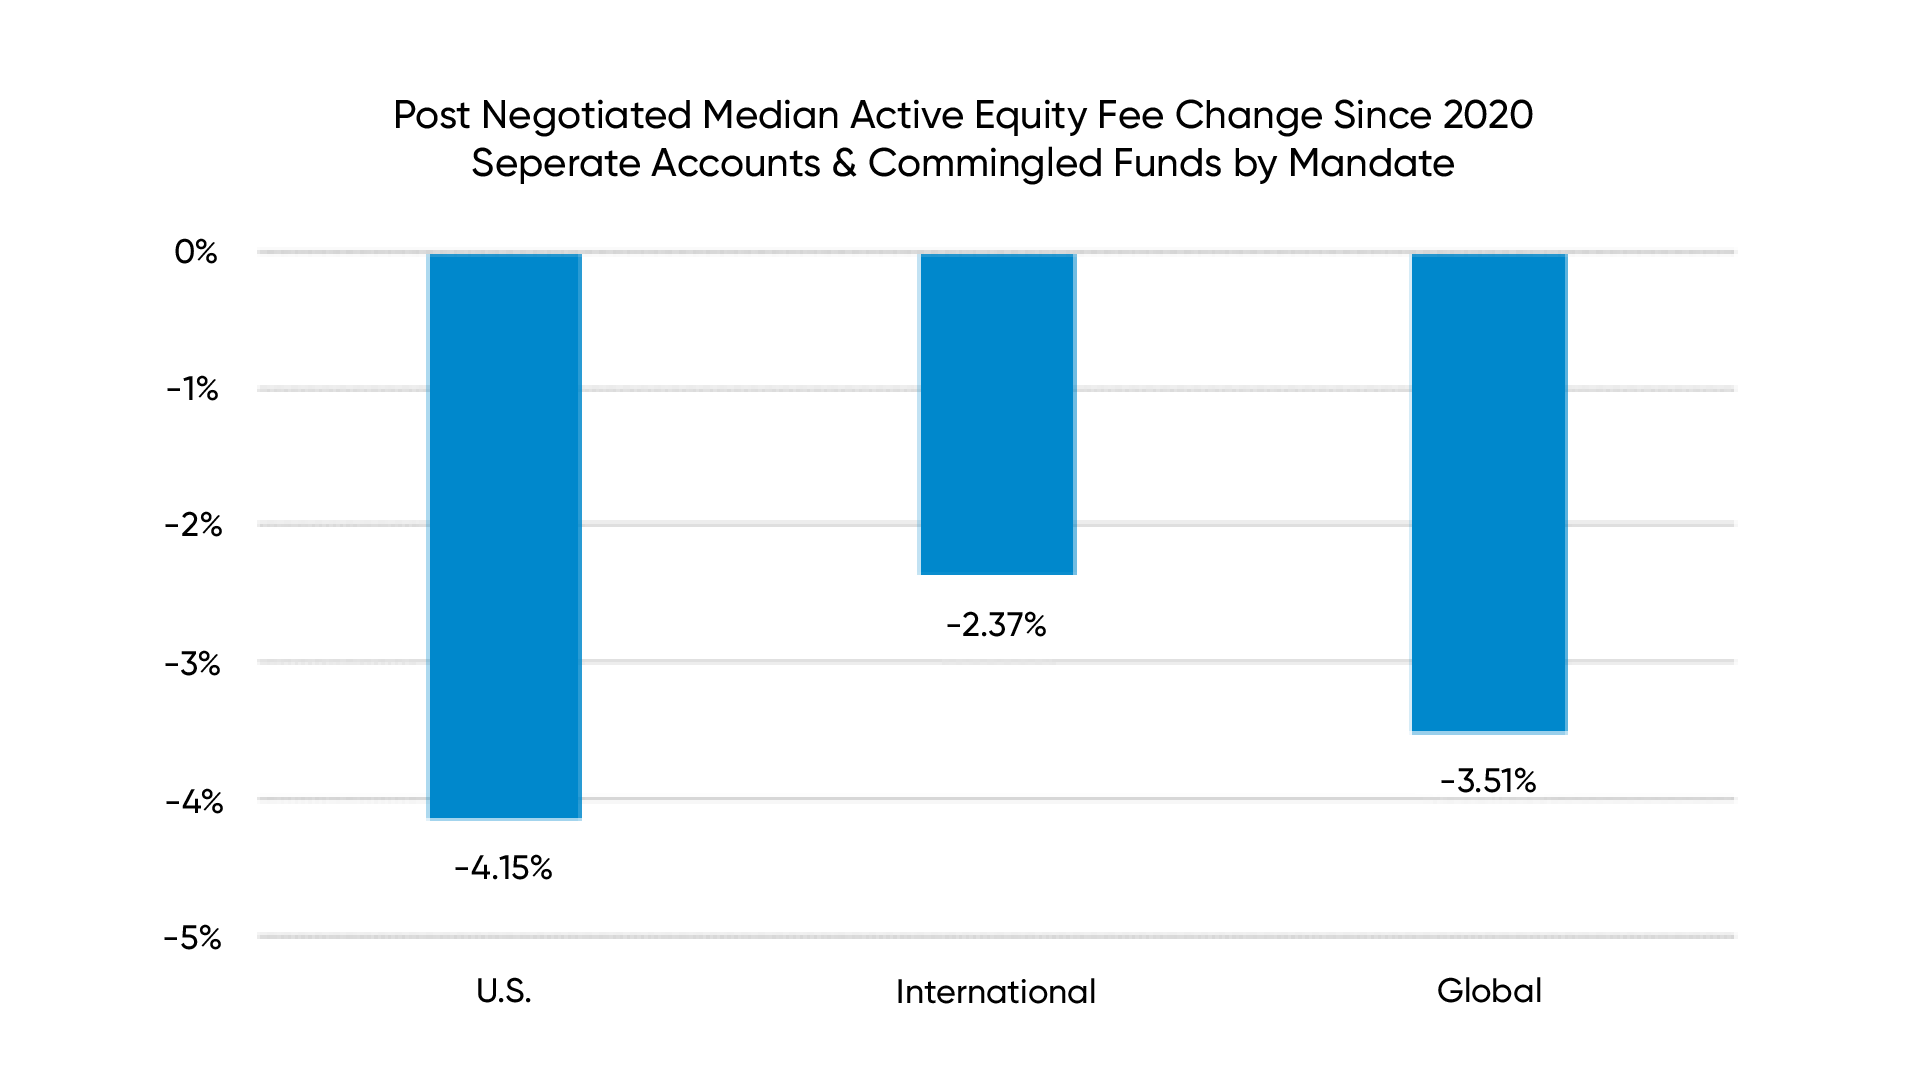
Chart 7: Median Equity Separate Account & Commingled Fund Post Negotiated Fee Change: 2020 to 2023
Across all developed markets, regardless of capitalization, we have seen the median post-negotiated fee come down over the last three years. As the chart above demonstrates, U.S. equity fees have seen the largest decrease, greater than 4%, while International has been the most resilient, decreasing 2.37%. Along style lines, global value has seen the greatest fee compression at 10%, while U.S. growth fees have remained steady.
Disclaimer
The material presented in this document is an assessment of the market environment as of the date indicated; is subject to change; and is not intended to be a forecast of future events or a guarantee of future results. This information should not be relied upon by the reader as research or investment advice regarding any funds or any issuer or security or similar.
This document contains general information only, does not consider an individual’s financial circumstances and should not be relied upon for an investment decision. Rather, an assessment should be made as to whether the information is appropriate in individual circumstances and consideration should always be given to consult a Financial Advisor before making an investment decision.
Investment Metrics, a Confluence company, does not provide investment advice and nothing in this document should be considered any form of advice.
Investment Metrics, a Confluence company, accepts no liability whatsoever for any information provided or inferred in this document.
About Investment Metrics, a Confluence company
Investment Metrics, a Confluence company, is a leading global provider of investment analytics, reporting, data, and research solutions that help institutional investors and advisors achieve better financial outcomes, grow assets, and retain clients with clear investment insights. Our solutions drive insights across 20K+ institutional asset pools, 28K+ funds, and 910K+ portfolios, representing $14T+ in AUA. With over 400 clients across 30 countries and industry-leading solutions in institutional portfolio analytics and reporting, style factor and ESG analysis, competitor and peer analysis, and market and manager research, we bring insights, transparency, and competitive advantage to help institutional investors and advisors achieve better financial outcomes. For more information about Investment Metrics, a Confluence company, please visit www.invmetrics.com.
