

Q3 2026 Factor Performance Analysis
Market background
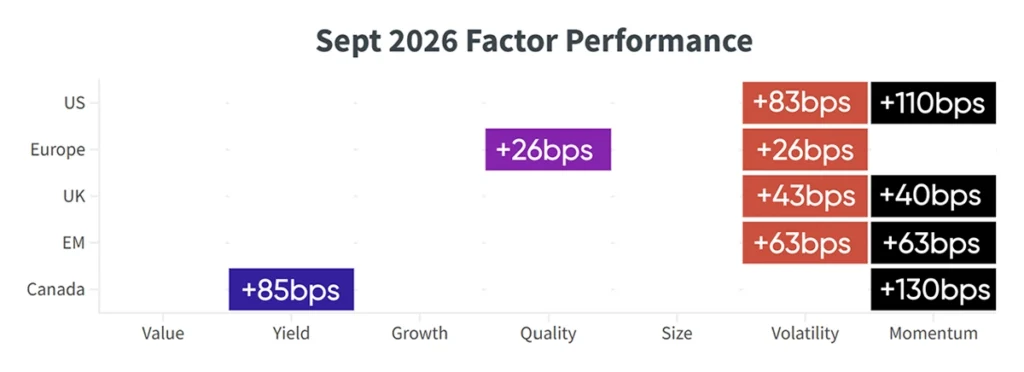
September’s equity market declines were accompanied by renewed strength in twelve-month Momentum across the US, Europe, UK, Emerging Markets and Canada. Value and income-based exposures also recovered across several regions, while Quality performance was mixed. Higher-volatility stocks outperformed in the US, UK and Emerging Markets but lagged in Canada. These monthly patterns contrasted with the broader Q3 rotation toward Value, Yield and selected measures of fundamental stability.
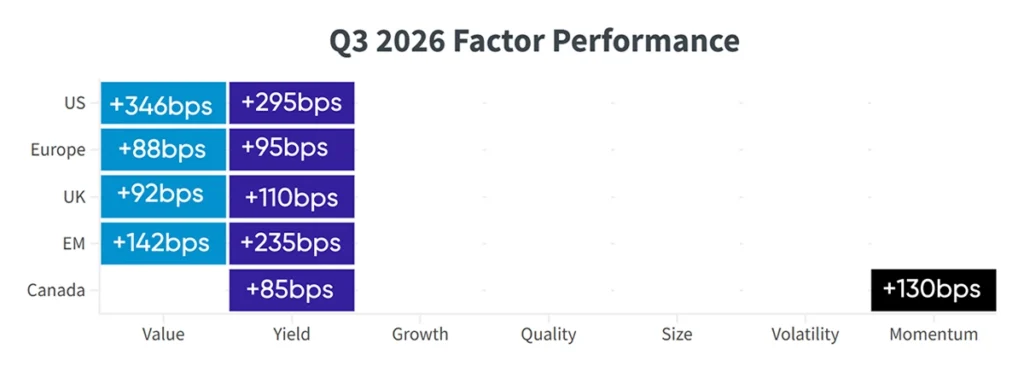
Across the third quarter, Value and Yield emerged as consistent outperformers across regions, alongside selected measures of earnings stability and fundamental strength. This contrasted with Q2’s stronger leadership from higher-risk and momentum exposures in several markets. Price Momentum weakened in the US, Europe, UK and Emerging Markets, while Canada retained positive momentum performance. Overall, the quarterly picture placed greater emphasis on valuation and income, despite September’s renewed strength among previous price winners.
Crude oil rose during September, trading near $90.50 per barrel on September 30, while gold traded around $4,150 per ounce.
Factor summary – Q3
- US equities: Volatility and Momentum outperformed.
- European equities: Volatility and Momentum outperformed.
- UK equities: Value and Momentum outperformed.
- Emerging markets equities: Growth and Volatility outperformed.
- Canadian equities: Yield and Momentum outperformed.
US equities
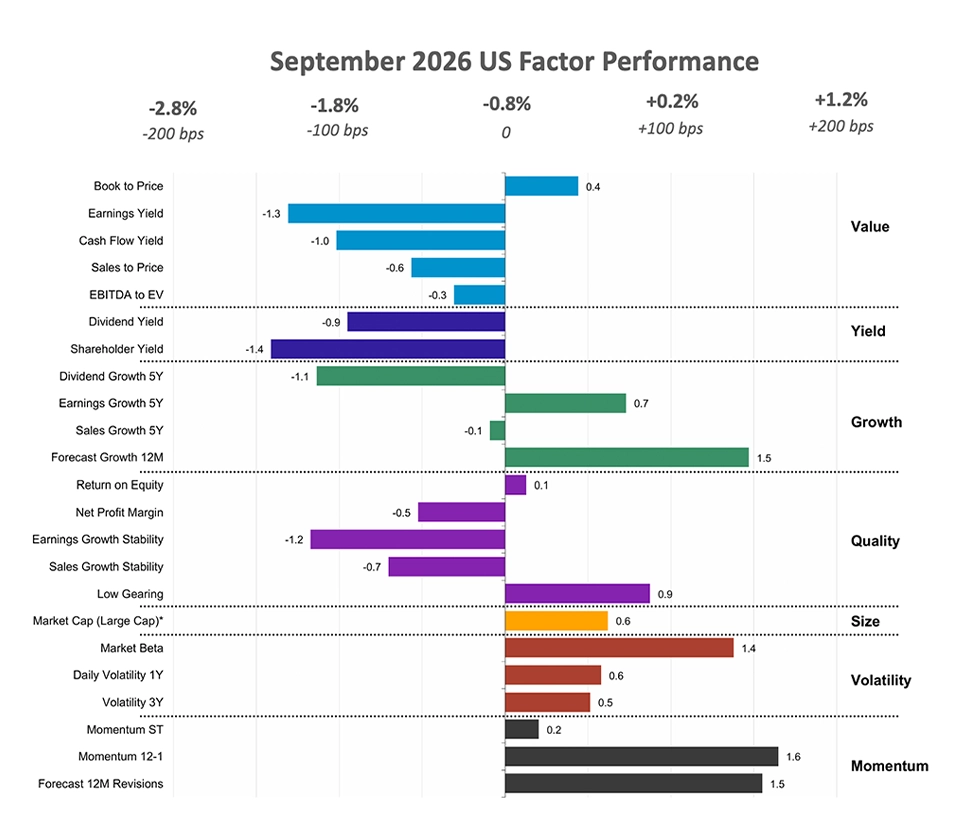
U.S. equities declined in September, but factor leadership shifted toward Momentum, Volatility and selected Growth characteristics. Stocks with stronger momentum 12-1, earnings forecasts and expected growth outperformed the market. Value and Yield generally remained weak, while Quality was mixed. This contrasted with August, when most factors underperformed and strength was largely limited to Sales Growth. September therefore marked a recovery in momentum and forward-looking growth exposures, even as the broader market weakened.
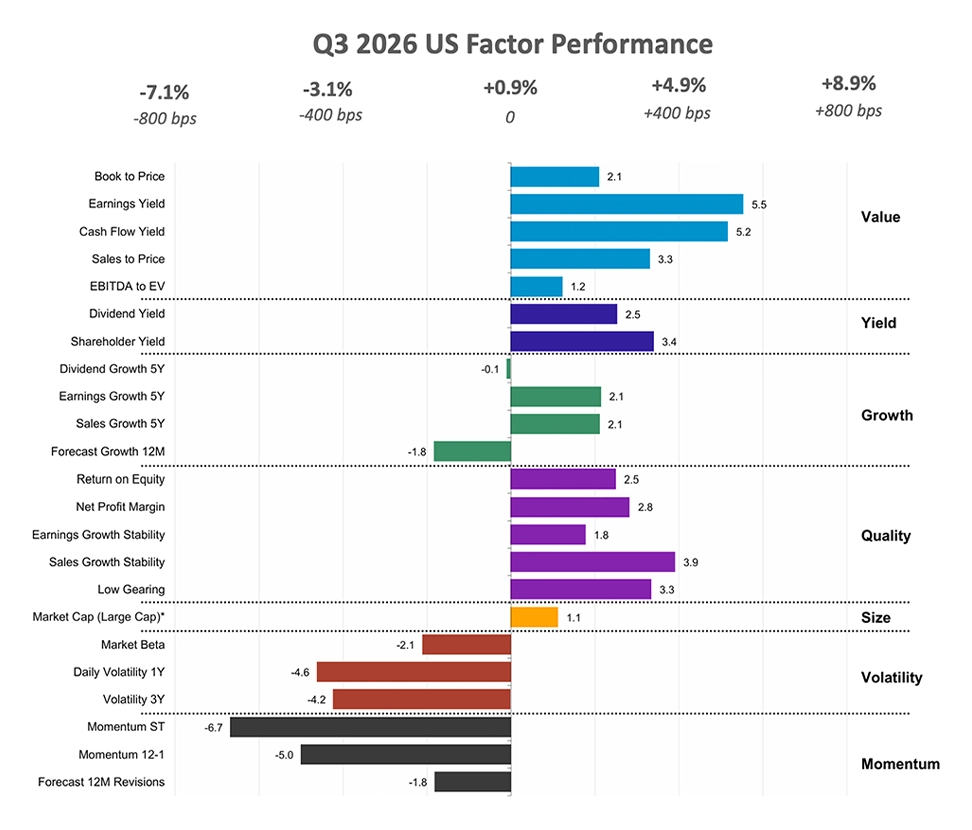
Across Q3, however, the dominant pattern was a sharp reversal of Q2’s leadership. The US market gained just 0.9%, compared with 15.5% in Q2, while Value, Yield and Quality moved ahead of Momentum and higher-Volatility stocks. Earnings yield and cash flow yield outperformed, reversing their Q2 weakness.
The annual inflation rate in the U.S. held steady at 3.4% in August 2026. Meanwhile, the unemployment rate rose to 4.2% in September, up from 4.1% in August and slightly above market expectations of 4.1%. U.S. manufacturing output declined by 0.3% in August.
Stocks with high momentum 12-1 which contributed to the performance of U.S. equities in Sept include info tech company Apple Inc (15% in Q3) and energy company Exxonmobil Holdings Corp (20% in Q3). Additionally, companies with strong earnings yield that contributed to the region’s performance in Sept include info tech company Meta Platforms (27%% in Sept) and Alphabet Inc (1.7% in Sept).
Source: Confluence® Style Analytics®
Source: Confluence® Style Analytics®
European equities
European equities declined 4.7% in September, reversing August’s 1.7% gain, while factor leadership shifted toward Momentum and Growth. Stocks with stronger 12-1 momentum and improving earnings forecasts outperformed the region, alongside companies with sustained dividend growth and higher forecast growth. Most Value measures also recovered from August’s underperformance. In contrast, Quality weakened, with Return on Equity, Net Profit Margin and Sales Growth Stability lagging, while higher-volatility exposures lost August’s strength. September therefore combined resilience among previous price winners and companies with improving growth expectations with a modest recovery in valuation-based exposures.
Across Q3, European equities returned −1.4%, compared with +10.4% in Q2, and the broader factor pattern favored Value, Yield and selected Quality characteristics. Stocks with higher sales, earnings and cash flow yields outperformed, alongside dividend-paying companies and those with stronger Return on Equity and Earnings Growth Stability. This contrasted with Q2, when Growth, higher-beta and higher-volatility stocks, and Momentum led performance. Most historical Growth measures and price-momentum exposures lagged in Q3, although Forecast Growth remained positive. Overall, the quarter marked a shift toward valuation, income and selected fundamental strengths, despite September’s recovery in Momentum and Growth.
Eurozone inflation accelerated during the period, with annual consumer price inflation rising to 3.8% in September 2026, up from 3.2% in August. Meanwhile, labor market conditions remained relatively resilient, with the seasonally adjusted unemployment rate standing at 6.4% in August 2026. Economic activity showed signs of weakness, as Eurozone industrial production declined by 0.1% month on month in July 2026.
Key European stocks with sales to price factor that outperformed in the third quarter of 2026 include info tech companies ASML Holdings (+7.5% in Sept) and Infineon Technologies AG (3.4% in Sept). Leading the market through momentum 12-1 performance in Q3 include financials companies Banco Bilbao Vizcaya Argentaria (13% in Q3) and Ing Groep (14.5% in Q3).
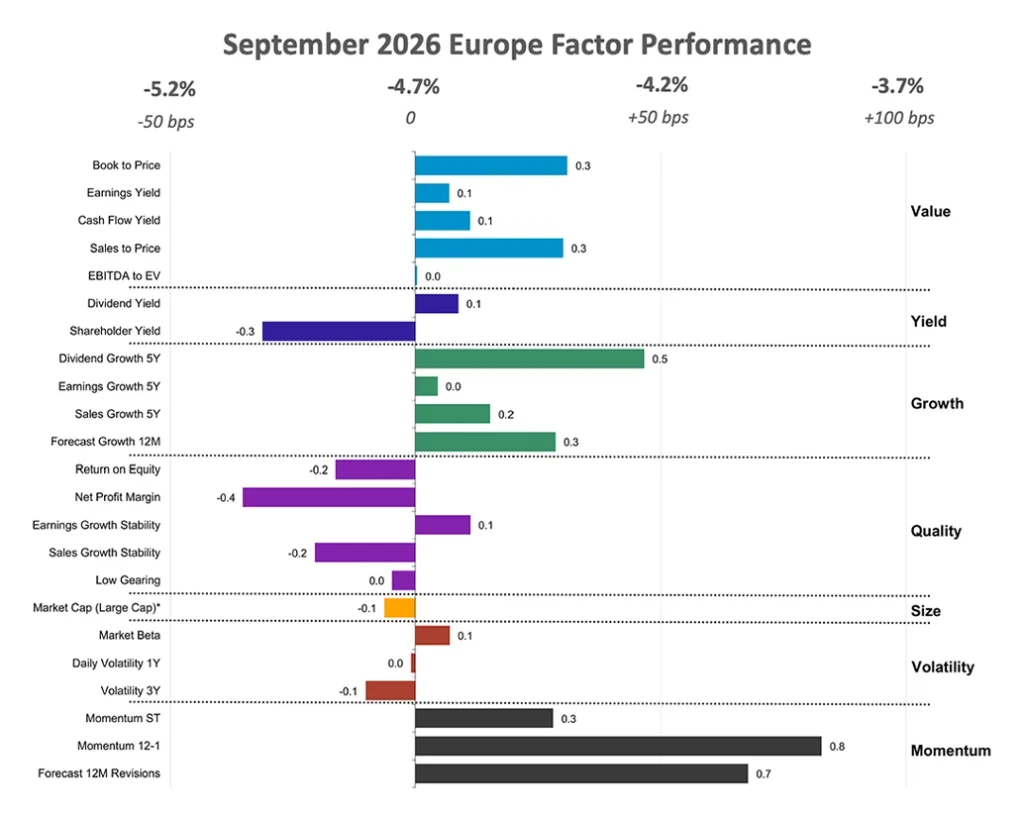
Source: Confluence® Style Analytics®
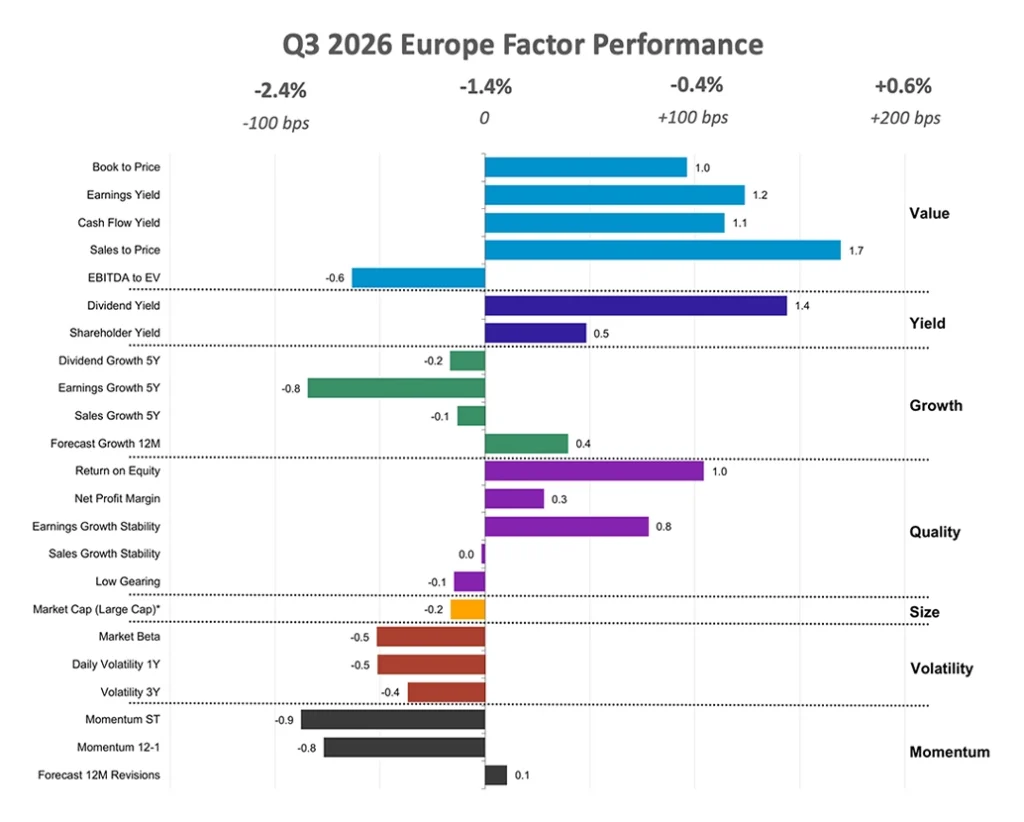
Source: Confluence® Style Analytics®
UK equities
UK equities declined 1.9% in September, reversing August’s 0.5% gain, while factor leadership shifted away from Quality toward twelve-month Momentum and selected Growth characteristics. Stocks with sustained dividend and earnings growth outperformed, reversing their August weakness, while most Value measures and Dividend Yield also recovered. Higher-beta and higher-volatility stocks continued to outperform, although three-year Volatility’s advantage narrowed. In contrast, Quality weakened, with profitability, sales growth stability and Low Gearing lagging. September therefore showed relative strength among previous price winners and companies with established growth records, rather than the profitability and balance-sheet characteristics that performed well in August.
Across Q3, UK equities gained 2.4%, compared with 4.5% in Q2, with Value and Yield emerging as the clearest outperformers. Higher cash flow and sales yields led the valuation-based exposures, while Dividend Yield and Shareholder Yield reversed their Q2 underperformance. Quality remained mixed: Earnings Growth Stability strengthened, but Net Profit Margin and Low Gearing lagged.
UK inflation accelerated during the period, with the annual consumer price inflation rate rising to 3.1% in August 2026, its highest level in five months. Meanwhile, labor market conditions remained stable, with the unemployment rate holding at 4.9% for the fourth consecutive period. Manufacturing activity strengthened, with production increasing by 0.9% month on month in July 2026.
British stock with strong cashflow yield that outperformed this quarter include energy company BP Plc (+19% in Q3) and communication services company Vodafone Group Public Ltd Company (23% in Q3). Stocks that led the region’s momentum 12-1 outperformance in September include – energy company Shell Plc (5% in September) and financials company Standard Chartered Plc (3.4% in September).
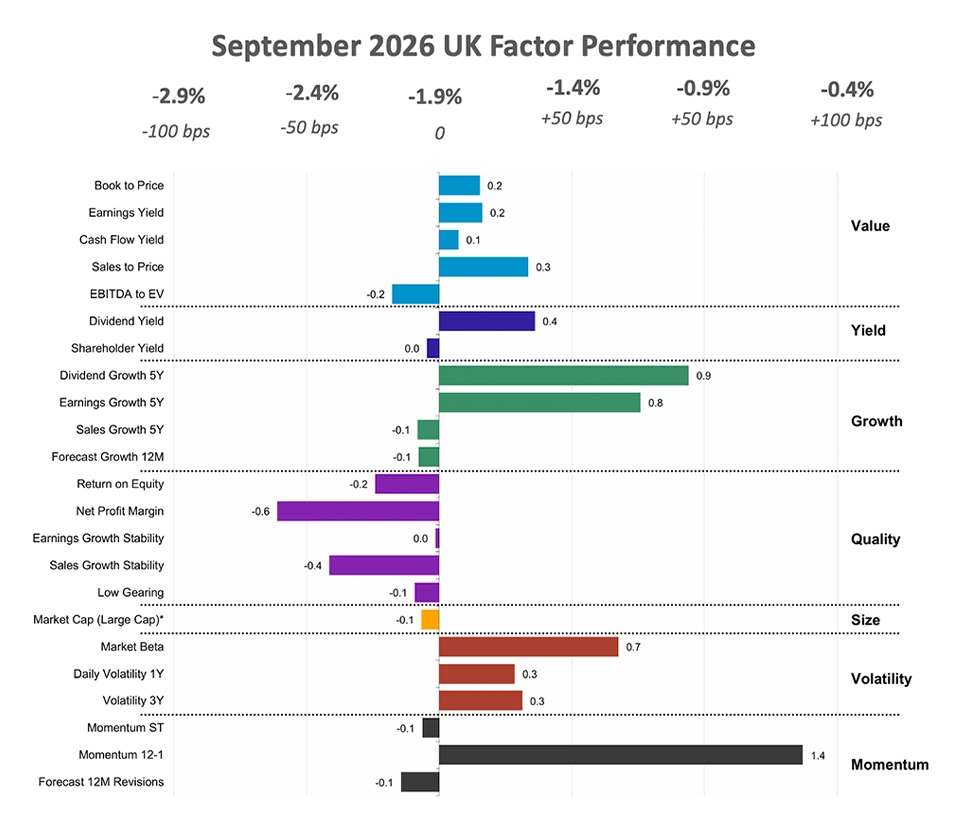
Source: Confluence® Style Analytics®
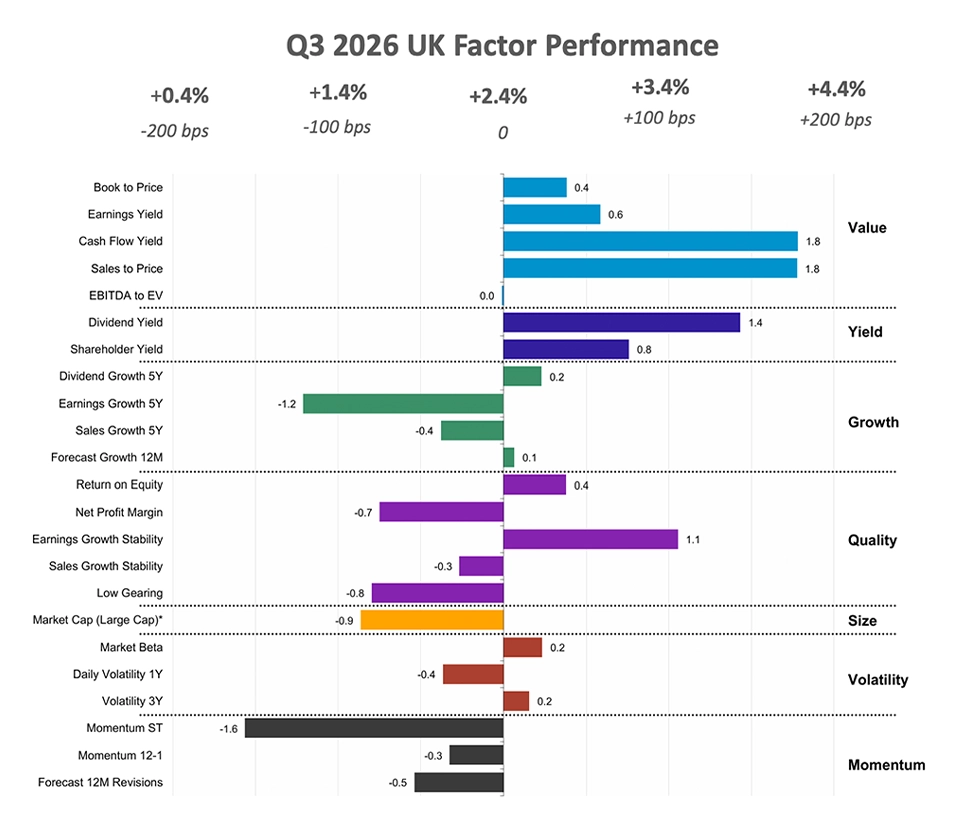
Source: Confluence® Style Analytics®
Emerging markets equities
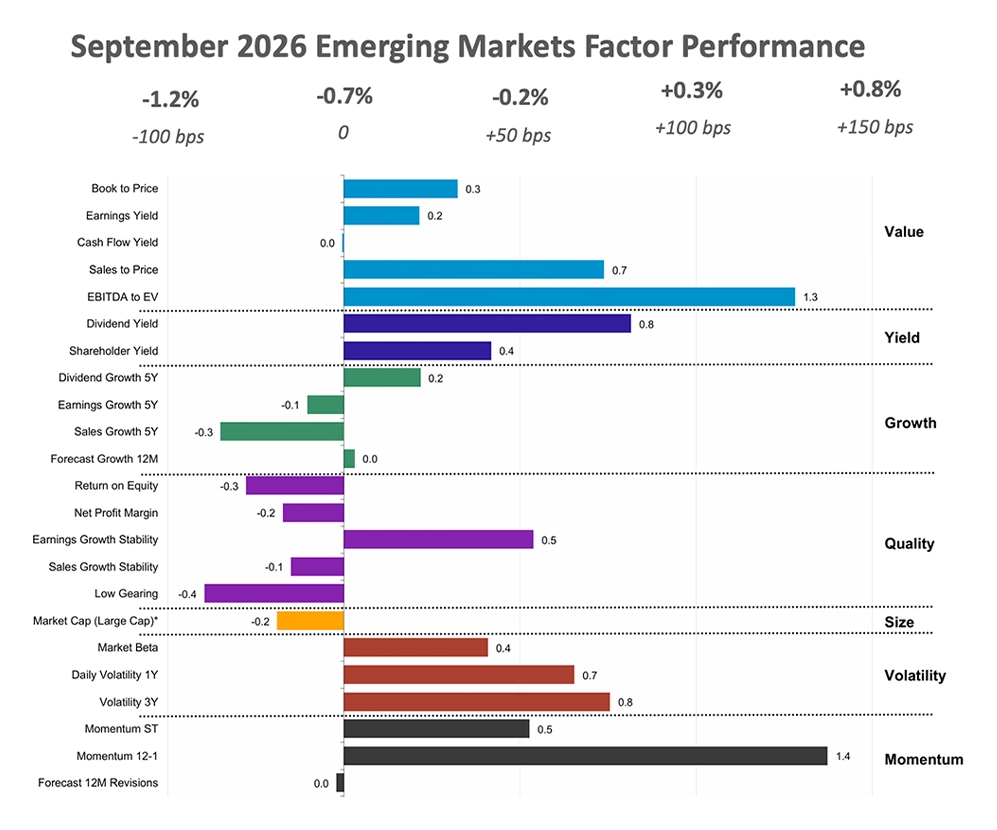
Emerging market equities declined 0.7% in September, reversing August’s 4.7% gain, but factor outperformance broadened to include Value and Yield alongside Momentum and Volatility. Twelve-month Momentum and EBITDA to EV were the strongest-performing exposures, while Dividend Yield and Shareholder Yield recovered from August’s weakness. Higher-beta and higher-volatility stocks continued to outperform, although their advantage narrowed. Growth and Quality remained mixed: historical earnings and sales growth lagged, while Earnings Growth Stability improved. September therefore combined continued strength among previous price winners and higher-risk stocks with a recovery in valuation and income-based exposures.
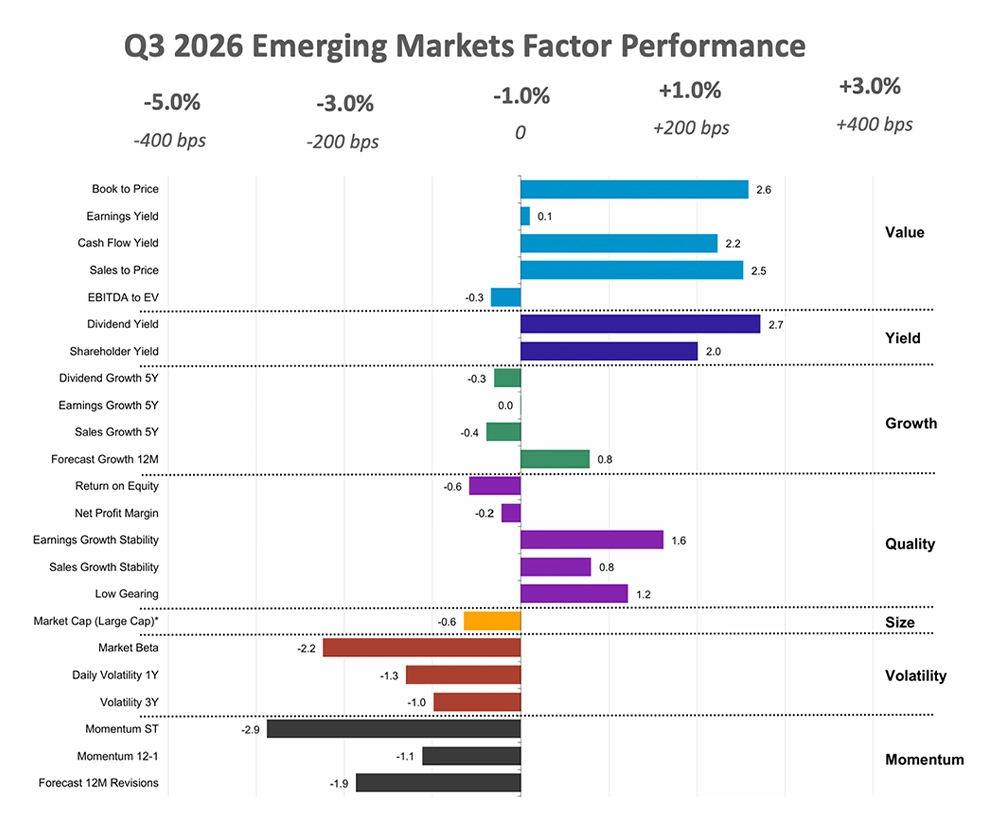
Across Q3, Emerging Market equities returned −1.0%, compared with +24.7% in Q2, with leadership shifting toward Value, Yield and selected Quality characteristics. Higher book-to-price, sales and cash flow yields outperformed, while Dividend Yield and Shareholder Yield reversed their Q2 underperformance. Earnings and Sales Growth Stability also recovered, although profitability measures continued to lag. This contrasted with Q2’s strong performance from higher-volatility and momentum exposures, all of which underperformed in Q3. Overall, the quarter favored valuation, income and greater fundamental stability, despite the relative strength of Momentum and Volatility in August and September.
Across key Emerging Market economies, inflation trends were mixed during the period. In India, the annual inflation rate rose to 4.82% in August 2026, while the unemployment rate edged down to 5.0% from 5.1% in July. However, industrial production contracted by 1.8% in August, signaling continued weakness in manufacturing activity. In Taiwan, annual inflation accelerated to 2.7% in September, up from 2.05% in August, while the seasonally adjusted unemployment rate eased slightly to 3.32% in August. Meanwhile, South Korea’s annual inflation moderated to 2.9% in September from 3.1% in August, accompanied by an improvement in labor market conditions as the unemployment rate declined to 2.7% in August from 2.8% in the previous month.
Emerging Markets equities that outperformed in September, captured by the momentum 12-1 factor include info tech company Mediatek Incorp (24% in Sept); and China Construction Bank Corp (3.3% in Sept). Companies with progressing dividend yield include comm services company China Mobile Limited (+16.9% in Q3) and consumer staples company Kweichow Moutai Co ltd (7.4% in Q3).
Source: Confluence® Style Analytics®
Source: Confluence® Style Analytics®
Canadian equities
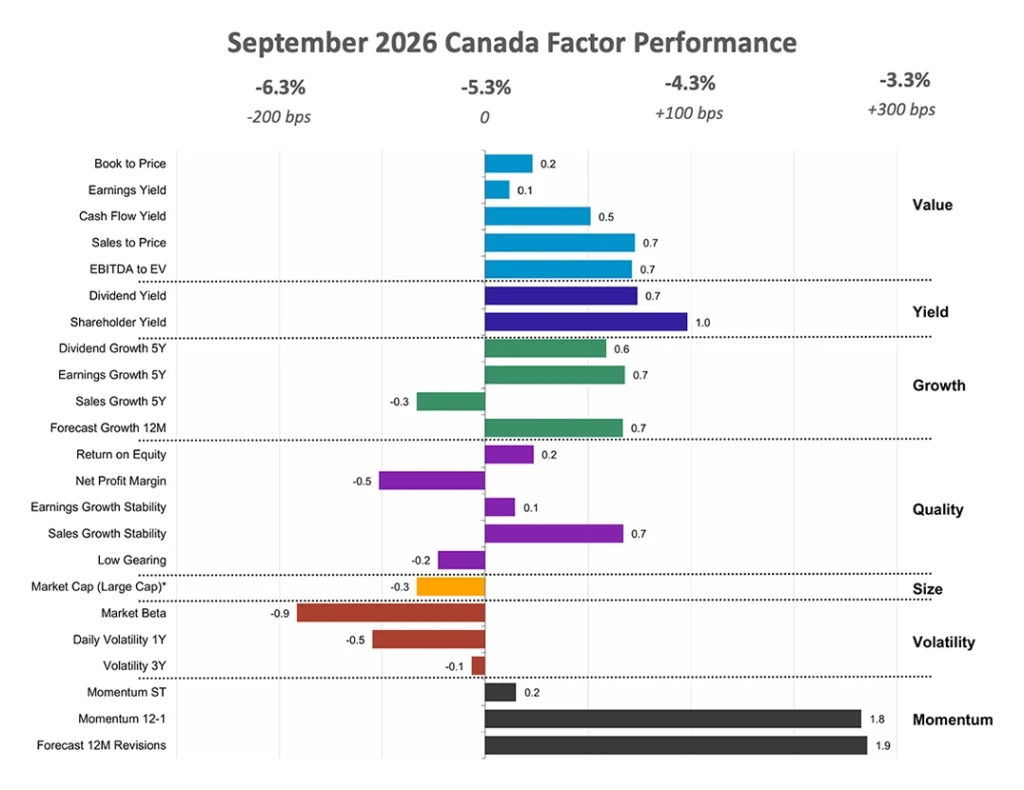
Canadian equities declined 5.3% in September, reversing August’s 4.8% gain, while factor leadership shifted toward Momentum, Value and Yield. Stocks with improving earnings forecasts and stronger twelve-month momentum were the leading outperformers, reversing August’s weakness. All Value measures generated positive excess returns, while Dividend Yield recovered and Shareholder Yield strengthened. Growth remained mixed: earnings and dividend growth outperformed, but Sales Growth reversed its August strength. Quality was also uneven, with Sales Growth Stability positive but Low Gearing and Net Profit Margin lagging. Higher-beta and higher-volatility stocks underperformed, marking a clear reversal from August.
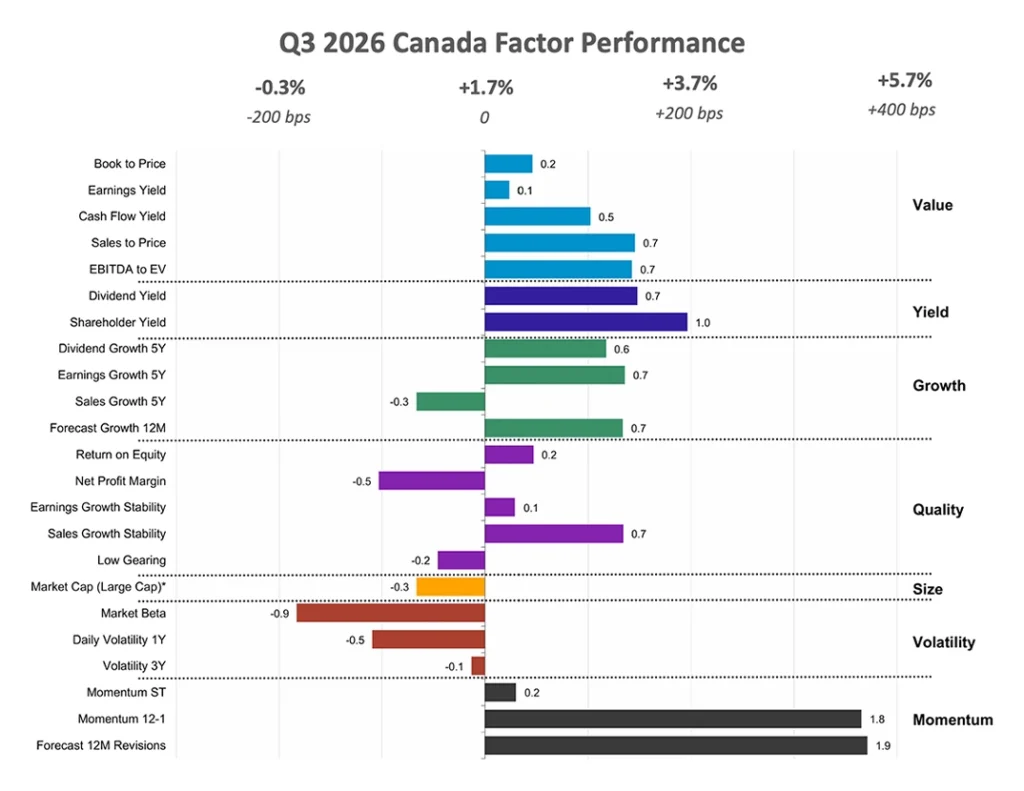
Across Q3, Canadian equities gained 1.7%, compared with 4.7% in Q2, with Momentum remaining positive and outperformance broadening across Value and selected Growth and Quality characteristics. Earnings revisions strengthened, while momentum 12-1 continued to outperform, although less strongly than in Q2. Yield remained positive but its advantage narrowed, while cash flow yield and earnings yield recovered from Q2 weakness. Historical Earnings Growth and Forecast Growth also turned positive, alongside Return on Equity and earnings and sales growth stability.
Canada’s annual inflation rate remained steady at 3.0% in August 2026, unchanged from the previous month. Meanwhile, labor market conditions softened slightly, with the unemployment rate edging up to 6.5% in September. Manufacturing activity remained subdued, as production declined by 0.1% year on year in July 2026.
Stocks with strong momentum 12-1 in the region include energy companies Canadian Natural Resources Ltd (+20 % in Q3) and Suncor Energy Inc (+27% in Q3). High shareholder yield that contributed to the region’s performance include consumer staples companies George Weston Ltd (2% in September) and Loblaw Companies Ltd (0.4% in September).
Source: Confluence® Style Analytics®
Source: Confluence® Style Analytics®
Appendix: How to read the charts
Each factor’s performance is based on the relative performance of its top 50% of stocks by market cap, compared to the overall market. The Size factor uses the top 70% of stocks, as the only exception.
For example, for the book-to-price factor, we determine the period’s performance of the basket of stocks with the highest book-to-price values, relative to the total market. Each factor is analyzed independently, market and fundamental data are adjusted to enable sector-average (within each country) relative data to be used, and the performance measurement isolates the factor’s contribution to return.
Disclaimer
The content provided by Confluence Technologies, Inc. is for general informational purposes only and does not constitute legal, regulatory, financial, investment, or other professional advice. It should not be relied upon as a substitute for specific advice tailored to particular circumstances. Recipients should seek guidance from appropriately qualified professionals before making any decisions based on this content.
Unless otherwise stated, Confluence Technologies, Inc. (or the relevant group entity) owns the copyright and all related intellectual property rights in this material, including but not limited to database rights, trademarks, registered trademarks, service marks, and logos.
No part of this content may be adapted, modified, reproduced, republished, uploaded, posted, broadcast, or transmitted to third parties for commercial purposes without prior written consent.
Author

About Confluence® Technologies
Confluence is a leading provider of specialist regulatory, analytics, and investor communication solutions for asset managers, asset servicers, investment consultants, and asset owners. Across performance, risk and peer analytics, regulatory filings and compliance monitoring, and shareholder reporting and document production, firms depend on Confluence for output they trust. We deliver this through deep domain expertise and purpose-built products developed over decades of research and engineering.
Confluence solutions are powered by Confluence POINT, AI-enabled automation that runs within and alongside Confluence’s trusted solutions. POINT optimizes inefficient workflows, delivering a meaningful impact on outcomes without requiring significant operational change.
Headquartered in Pittsburgh, PA, with 750+ employees in 15 offices across the United Kingdom, Europe, North America, South Africa, and Australia, Confluence services over 1,000 clients in more than 40 countries. For more information, visit www.confluence.com.
Confluence Media Contact:
Jon Schubin
Cognito