

July 2026 Factor Performance Analysis
Market background
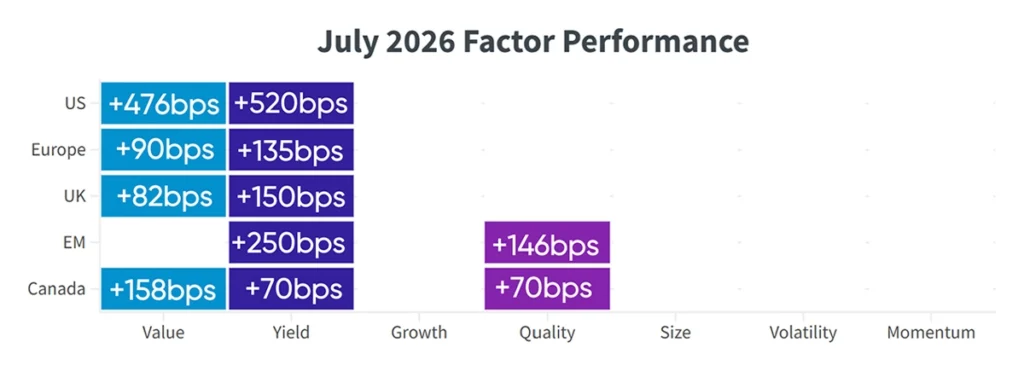
Global equity markets shifted toward a more risk-off factor environment in July, reversing the risk-on leadership seen in the previous month. While Momentum and Volatility had led previously, Value and Yield emerged as the stronger-performing factors this month. The shift occurred amid heightened macroeconomic and geopolitical uncertainty, including ongoing Middle East tensions, trade and tariff uncertainty, and evolving expectations for global interest rates. Regional performance also diverged, with UK delivering the strongest performance, followed by Canada, while the US and Emerging Markets saw a more notable decline in performance. The following sections examine how these factor trends played out across each region.
Crude oil prices increased during July, rising from approximately $70 per barrel at the end of June to $85 per barrel by month-end. Prices climbed to approximately $91 per barrel mid-month before moderating toward the end of July.
Bitcoin posted a positive return in July, gaining approximately 9% over the month after ending June near $60,000. The recovery was supported by improving risk sentiment and expectations around monetary policy, although Bitcoin remained volatile and pulled back toward month-end.
Factor summary
- US equities: Value and Yield outperformed.
- European equities: Value and Yield outperformed.
- UK equities: Value and Yield outperformed.
- Emerging markets equities: Yield and Quality outperformed.
- Canadian equities: Value, Yield and Quality outperformed.
US equities
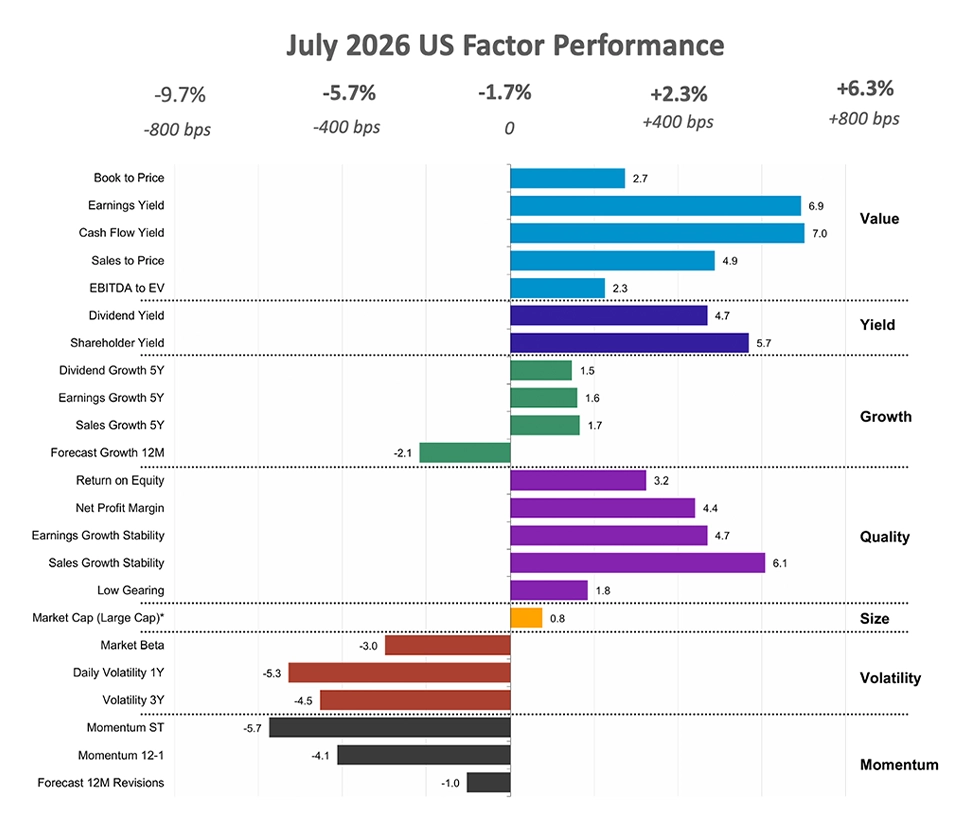
The US region’s performance declined to -1.7% in July, further weakening from -0.2% in the previous month. This marked a notable shift from the last month’s risk-on environment, with performance during the month being largely driven by more defensive, risk-off factors, particularly Value and Yield, closely followed by Quality. In contrast, Momentum and Volatility, which were among the strongest contributors in the previous month, became the largest detractors and weighed materially on overall regional performance.
The reversal in factor leadership may reflect a change in investor sentiment and market positioning, as investors became more cautious and placed greater emphasis on valuation, income, and earnings stability. At the same time, the reversal in Momentum and Volatility suggests that stocks and themes that had previously benefited from strong price trends and higher-risk positioning experienced a pullback as market conditions became less supportive of risk-taking. Overall, the shift in factor performance points to a transition from a momentum-driven, risk-seeking environment toward a more selective and defensive market backdrop.
US annual inflation declined to 3.5% in June 2026, marking its first decrease in five months and easing from 4.2% in May. The unemployment rate also edged lower to 4.1% in July, from 4.2% in June, coming in below market expectations. Meanwhile, US manufacturing output was unchanged in June, following a 0.1% increase in the previous month.
Stocks with high shareholder yield in the region that drove the region’s performance this month include info tech company Microsoft Corp (25% in July), energy company ExxonMobil Holdings Corp (13.7% in July) and financials company Mastercard Inc (11.8% in July).
Source: Investment Metrics, a Confluence company.
European equities
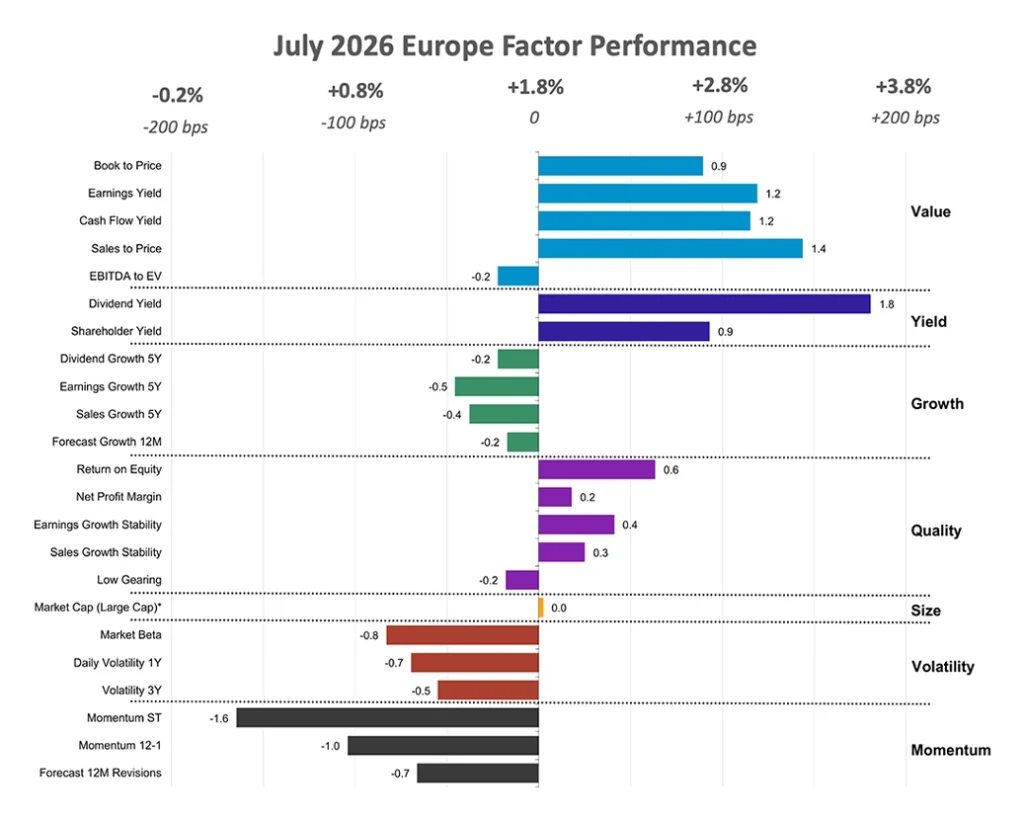
Similar to the US, the Eurozone market was largely driven by risk-off factors, with Value and Yield outperforming, while Momentum and Volatility were the key laggards. However, unlike the US, the Eurozone delivered positive returns this month.
The Value bias that emerged in the previous month became more pronounced, with Value and Yield outperforming by approximately 90bps and 135bps, respectively. Meanwhile, the previous month’s large-cap outperformance faded, with the Size factor moving from +80bps to neutral. The continued strength in Value and Yield suggests a sustained investor preference for more attractively valued and income-generating stocks amid a cautious market environment, while the fading Size premium indicates less concentration in larger-cap stocks.
Eurozone annual inflation edged up to 2.9% in July 2026, in line with market expectations, from 2.8% in June. The seasonally adjusted unemployment rate remained unchanged at 6.3% for the fourth consecutive month in June. Meanwhile, industrial production declined 0.2% month-over-month in May, ending a three-month period of growth and falling short of market expectations for a 0.2% increase.
The stocks contributing to the Eurozone region’s risk-off performance this month include securities with high Shareholder Yield like Spanish financials company Banco Santander SA (2.6% in July), German financials company Allianz SE (5% in July) and French industrials company Airbus SE (4.7% in July).
Source: Investment Metrics, a Confluence company.
UK equities
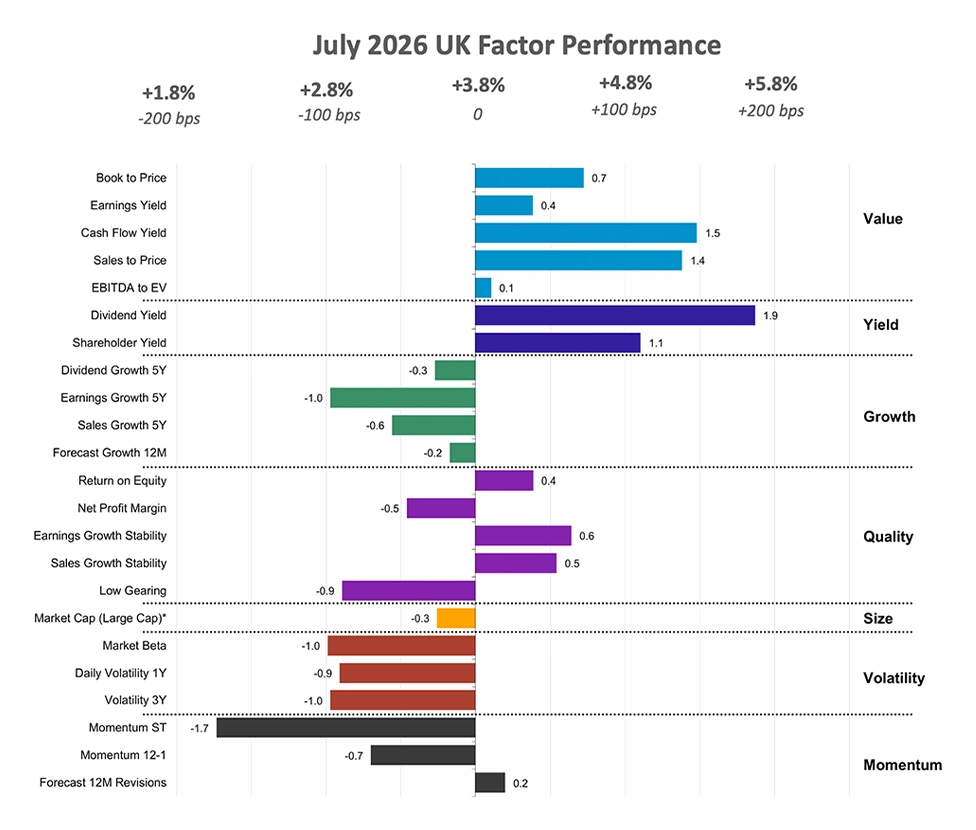
The UK region outperformed its Developed Market counterparts, posting a strong positive return of 3.8% in July, up from 0.7% in the previous month.
The region’s performance was primarily driven by Value and Yield, highlighting a continued preference for more attractively valued and income-generating stocks. This factor leadership is consistent with the broader market backdrop, where geopolitical uncertainty, elevated energy prices and higher interest-rate expectations supported a more cautious, risk-off positioning. The UK market’s relatively strong performance also reflects the supportive environment for value-oriented sectors, which have a meaningful presence in the UK equity market.
UK annual inflation eased to 2.6% in June 2026, down from 2.8% in May. The unemployment rate remained unchanged at 4.9% in the three months to May 2026, while manufacturing production edged up 0.1% month-over-month in May.
British stocks with strong dividend yield that outperformed this month include industrials company BAE Systems Plc (+15% in July); energy company BP Plc (+20% in July) and financials company HSBC Holdings Plc (11.7% in July).
Source: Investment Metrics, a Confluence company.
Emerging markets equities
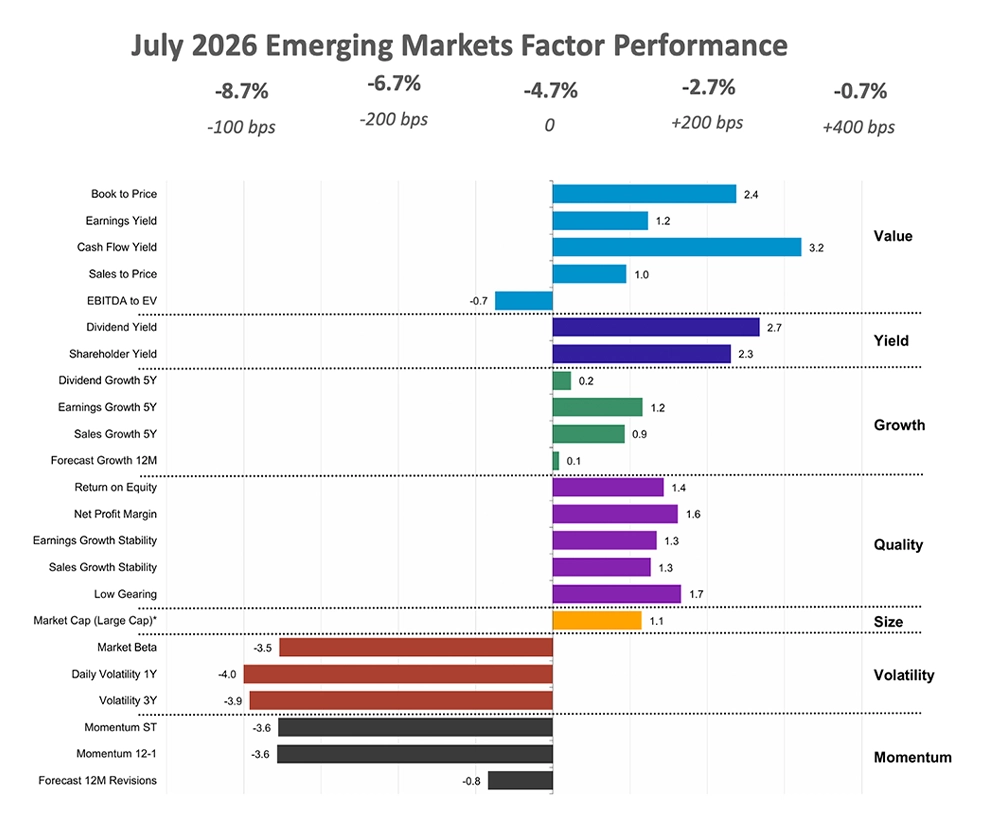
The Emerging Market region’s performance weakened significantly this month, declining to -4.7% from -0.8% in the previous month. The reversal marks a notable slowdown in the region’s strong outperformance seen earlier in the year, with EM performance coming under pressure amid a more cautious global market environment and weaker investor risk appetite.
Similar to Developed Markets, the region was largely driven by risk-off factors, with Yield and Quality emerging as the strongest contributors. The preference for these factors suggests a shift toward companies offering stronger income characteristics and more resilient fundamentals as investors became more selective. The combination of weaker risk sentiment and this defensive factor rotation contributed to the region’s negative performance and reduced the momentum behind its earlier outperformance.
Taiwan’s annual inflation eased to 2.54% in July 2026 from 2.6% in June, marking its first slowdown in five months, while the seasonally adjusted unemployment rate edged up to 3.33% in June. In China, annual inflation moderated to 0.5% in July from 1.0% in the previous month, while the surveyed urban unemployment rate edged down to 5.0% in June. South Korea’s annual inflation rate slowed to 2.8% in July from 3.2% in June, marking its softest increase since April, while the seasonally adjusted unemployment rate declined to 2.7% in June from 2.8% in the previous month.
Emerging Markets equities that outperformed in the month of July, captured by dividend yield, include Chinese financials company China Construction Bank Corp (18% in July), consumer staples company Kweichow Moutai Co Ltd (15% in July) and comm services company China Mobile Ltd (10.5% in July).
Source: Investment Metrics, a Confluence company.
Canadian equities
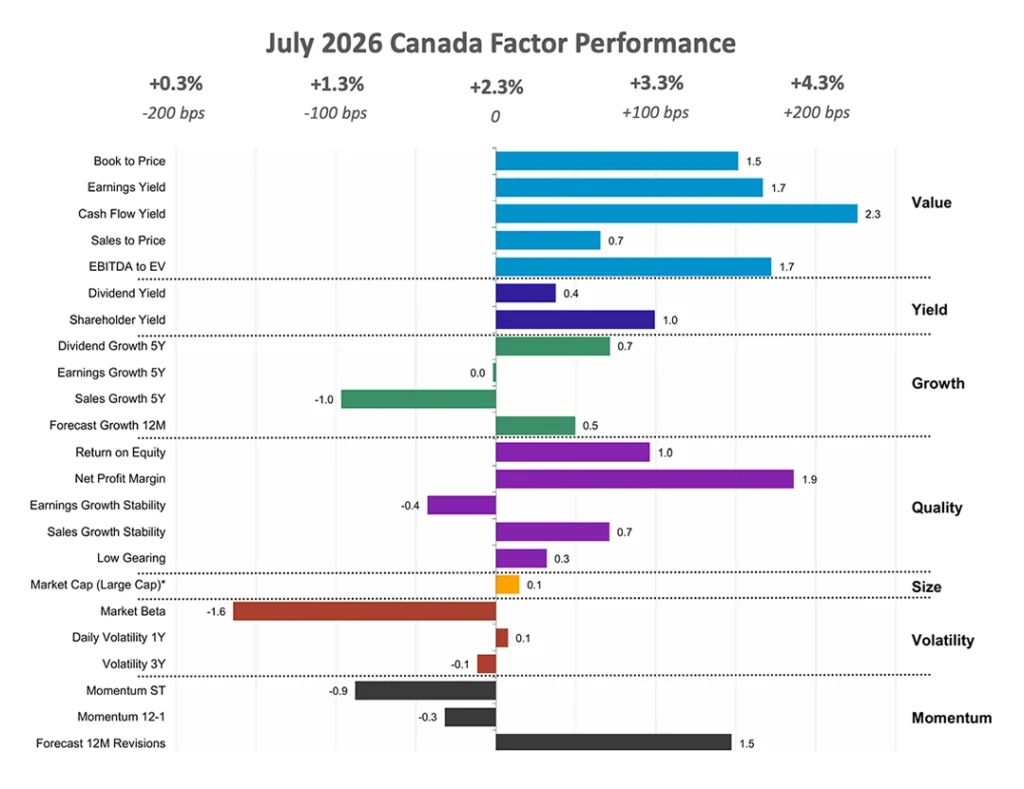
The Canadian region outperformed both the US and Eurozone markets in July, posting a strong positive return of 2.3% following a -3.1% decline in the previous month. The outperformance was supported by the region’s relatively high exposure to value-oriented sectors, particularly Energy, Materials and Financials, which benefited from the continued preference for Value and Yield factors.
The factor composition, combined with the stronger performance of commodity-related sectors, helped Canada outperform its Developed Market counterparts during the month. The continued strength of Yield, alongside a reversal in Quality from a laggard in June to a positive contributor in July, further supported the region’s performance.
Canada’s headline inflation rate eased to 2.8% in June 2026, down from a more than two-year high of 3.2% in the previous month. The unemployment rate also declined to 6.4% in July, from 6.5% in June. Meanwhile, industrial production increased 0.9% month-over-month in May 2026.
Stocks with strong net profit margin in the region include energy company Canadian Natural Resources (+20% in July), and financials company Brookfield Asset Management (+9% in July).
Source: Investment Metrics, a Confluence company.
Appendix: How to read the charts
Each factor’s performance is based on the relative performance of its top 50% of stocks by market cap, compared to the overall market. The Size factor uses the top 70% of stocks, as the only exception.
For example, for the book-to-price factor, we determine the period’s performance of the basket of stocks with the highest book-to-price values, relative to the total market. Each factor is analyzed independently, market and fundamental data are adjusted to enable sector-average (within each country) relative data to be used, and the performance measurement isolates the factor’s contribution to return.
Disclaimer
The content provided by Confluence Technologies, Inc. is for general informational purposes only and does not constitute legal, regulatory, financial, investment, or other professional advice. It should not be relied upon as a substitute for specific advice tailored to particular circumstances. Recipients should seek guidance from appropriately qualified professionals before making any decisions based on this content.
Unless otherwise stated, Confluence Technologies, Inc. (or the relevant group entity) owns the copyright and all related intellectual property rights in this material, including but not limited to database rights, trademarks, registered trademarks, service marks, and logos.
No part of this content may be adapted, modified, reproduced, republished, uploaded, posted, broadcast, or transmitted to third parties for commercial purposes without prior written consent.
Author

About Confluence® Technologies
Confluence is a global leader in enterprise data and software solutions for regulatory, analytics, and investor communications. Our best-of-breed solutions make it easy and fast to create, share, and operationalize mission-critical reporting and actionable insights essential to the investment management industry. Trusted for over 30 years by the largest asset service providers, asset managers, asset owners, and investment consultants worldwide, our global team of regulatory and analytics experts delivers forward-looking innovations and market-leading solutions, adding efficiency, speed, and accuracy to everything we do. Headquartered in Pittsburgh, PA, with 700+ employees across North America, the United Kingdom, Europe, South Africa, and Australia, Confluence services over 1,000 clients in more than 40 countries. For more information, visit www.confluence.com.