

April 2026 Factor Performance Analysis
Market background
Global equity markets rebounded strongly in April 2026 after the broad risk-off selloff in March, with all major regions posting sharp improvements in performance. The recovery was driven by easing inflation and growth concerns, stabilizing energy prices and stronger corporate earnings, markets led the rebound. Across all regions, investor sentiment shifted away from defensive Value, Yield, and Quality factors toward more risk-seeking exposures, with Volatility, Momentum, and Growth factors outperforming as confidence in the global economic outlook improved.
Crude oil prices remained volatile throughout April 2026, initially declining to around $83 per barrel during the final week of the month before rebounding sharply to approximately $107 per barrel by month-end. The recovery in prices was driven by renewed geopolitical tensions, concerns around global energy supply disruptions, and expectations of resilient global demand, all of which contributed to upward pressure on energy markets.
Gold prices declined toward the end of April 2026, falling to approximately $4,628 per ounce from $4,770 at the end of the previous month. The decline reflected improving investor risk appetite and reduced demand for safe-haven assets as global equity markets recovered.
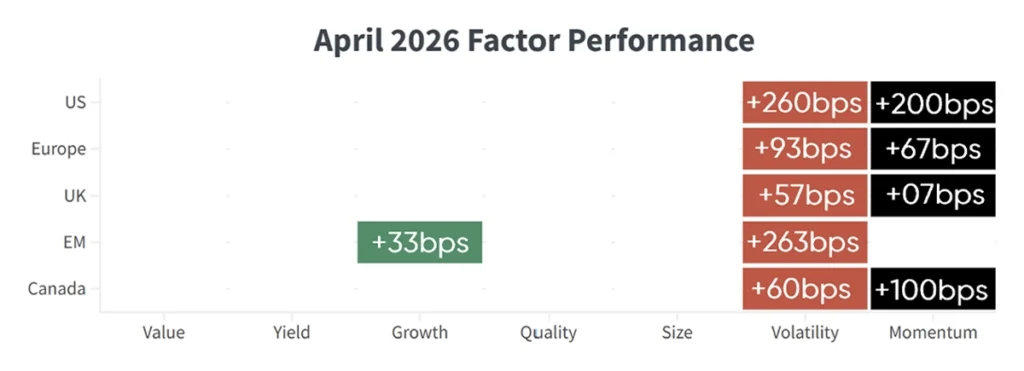
Factor summary
- US Equities: Volatility and Momentum outperformed.
- European Equities: Volatility and Momentum outperformed.
- UK Equities: Volatility and Momentum outperformed.
- Emerging Markets Equities: Growth and Volatility outperformed.
- Canadian Equities: Volatility and Momentum outperformed.
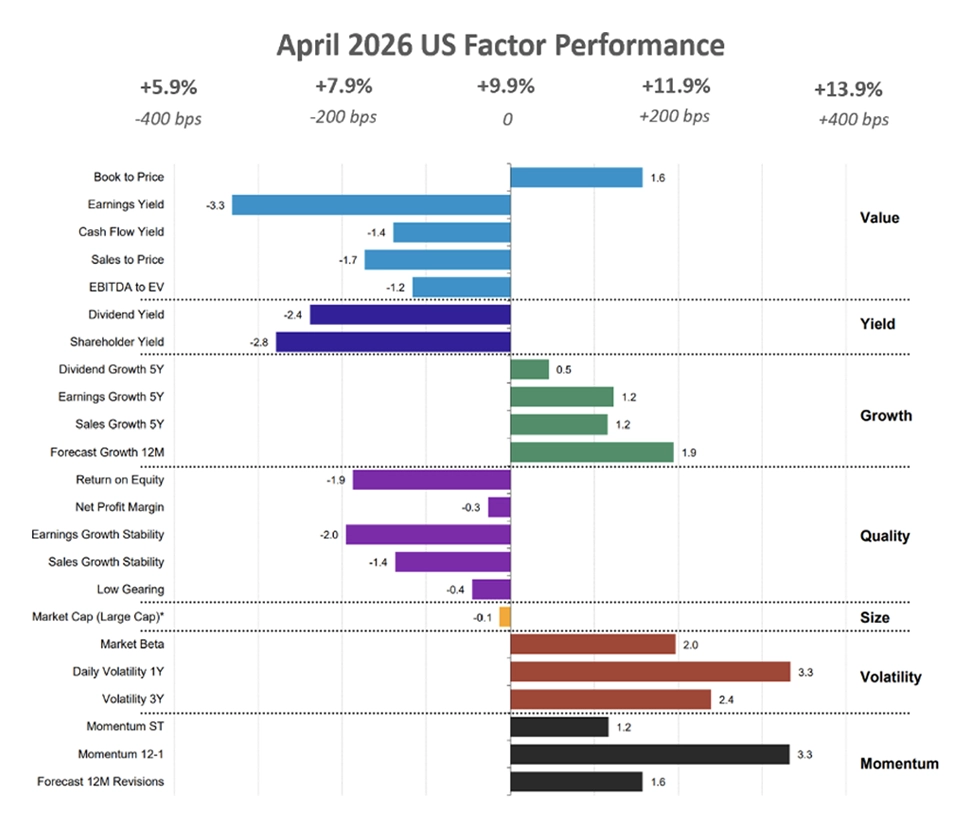
US equities
U.S. equities rebounded sharply in April 2026 after the risk-off environment that dominated March. The recovery was driven by a combination of resilient economic data, and renewed enthusiasm for artificial intelligence related growth securities, leading to a +10% return in April.
In March, markets had been pressured by concerns around sticky inflation, rising oil prices, geopolitical tensions in the Middle East, which led investors to favor defensive factor exposures such as Value and Quality. By April, however, several of these concerns moderated. Corporate earnings, particularly from large-cap technology and semiconductor companies came in stronger than expected, economic indicators pointed to continued growth without significant overheating.
As risk appetite returned, investor positioning shifted decisively toward higher volatile areas of the market. Momentum and Volatility factors outperformed as investors rotated back into fast-growing technology and AI-linked names, while defensive Value and Quality exposures lagged after outperforming during the prior month’s selloff. The sharp recovery in growth equities, especially within mega-cap technology, reflected a broader transition in sentiment from capital preservation toward risk-seeking behavior and performance chasing.
U.S. annual inflation accelerated to 3.3% in March 2026, its highest reading since May 2024 and a notable increase from 2.4% previously, raising concerns around persistent price pressures. At the same time, the unemployment rate remained steady at 4.3% in April 2026, broadly in line with expectations, while continued payroll growth and stable labor market conditions reinforced confidence that the U.S. economy remained resilient and was not showing signs of slipping into recession.
Stocks with high volatility 1Y which contributed to the performance of U.S. equities in April include info tech company Broadcom Inc (35% in April), and comm services company Alphabet Inc (34% in April). Additionally, companies with high momentum 12-1 include info tech companies Micron Technology Inc (+53% in April) and NVIDIA Corp (14% in April).
Source: Confluence Style Analytics
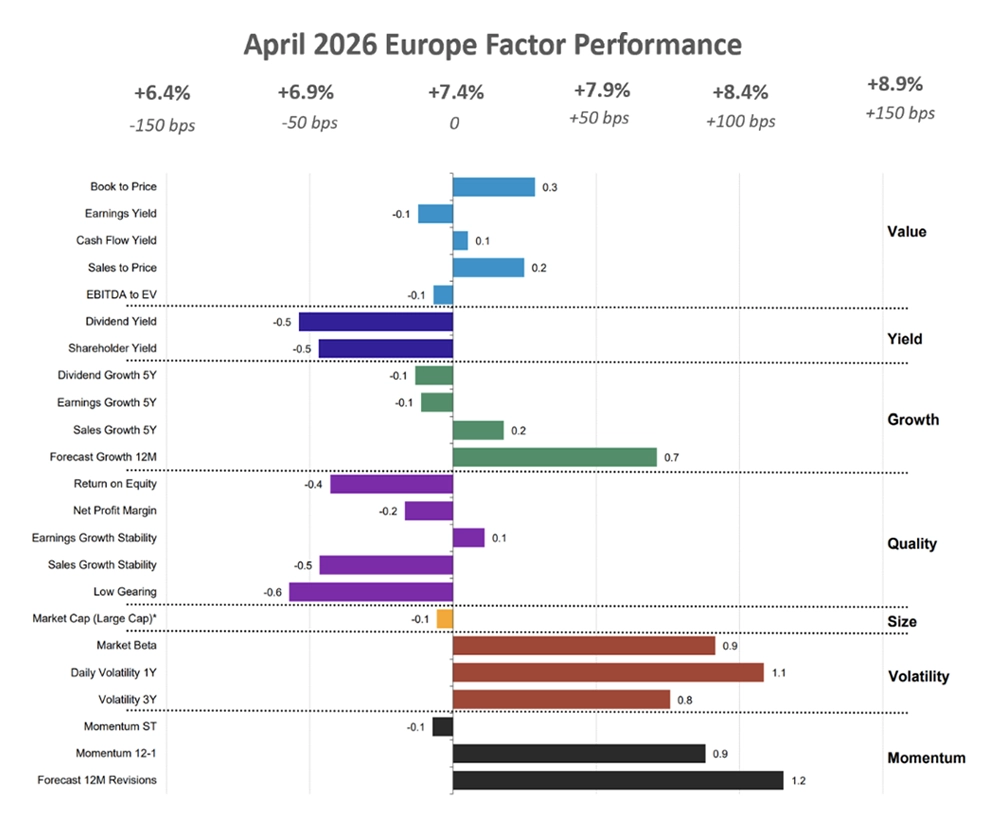
European equities
European equities rebounded strongly in April 2026, returning +7.4% after the sharp decline in March, when markets were pressured by concerns over slowing global growth, trade tensions, elevated energy prices, and persistent inflation.
Euro Zone’s greater exposure to external trade and cyclical industries intensified the previous month’s selloff, leading investors to favor defensive Value and Yield oriented securities. In April, sentiment improved as energy prices stabilized, recession fears eased, and corporate earnings, particularly in technology, and luxury sectors came in stronger than expected.
The recovery was accompanied by a shift in factor leadership similar to the U.S. market. Investors rotated away from defensive Value and Yield exposures and back into higher-beta, growth-sensitive areas of the market. As risk sentiment improved, Momentum and Volatility factors outperformed, reflecting renewed confidence in earnings growth, stabilizing macro conditions, and stronger appetite for cyclical and technology related stocks.
Annual inflation in the Euro Area rose to 3.0% in April 2026, marking its highest level since September 2023. Meanwhile, the seasonally adjusted unemployment rate edged down to 6.2% in March 2026 from a revised 6.3% in February, indicating continued labor market stability. However, manufacturing production in the region declined by 0.8% year-over-year in February 2026, highlighting ongoing weakness in industrial activity.
Key European stocks with strong forecast 12M revisions that outperformed in the month of April include German industrials company Siemens Energy (+29% in April) and French Industrials company Schneider Electric SE (20% in April). Leading the market through a daily volatility 1Y performance in the region include Spanish financials company Banco Santander SA (12% in April) and Italian financials company UniCredit SPA (13% in April).
Source: Confluence Style Analytics
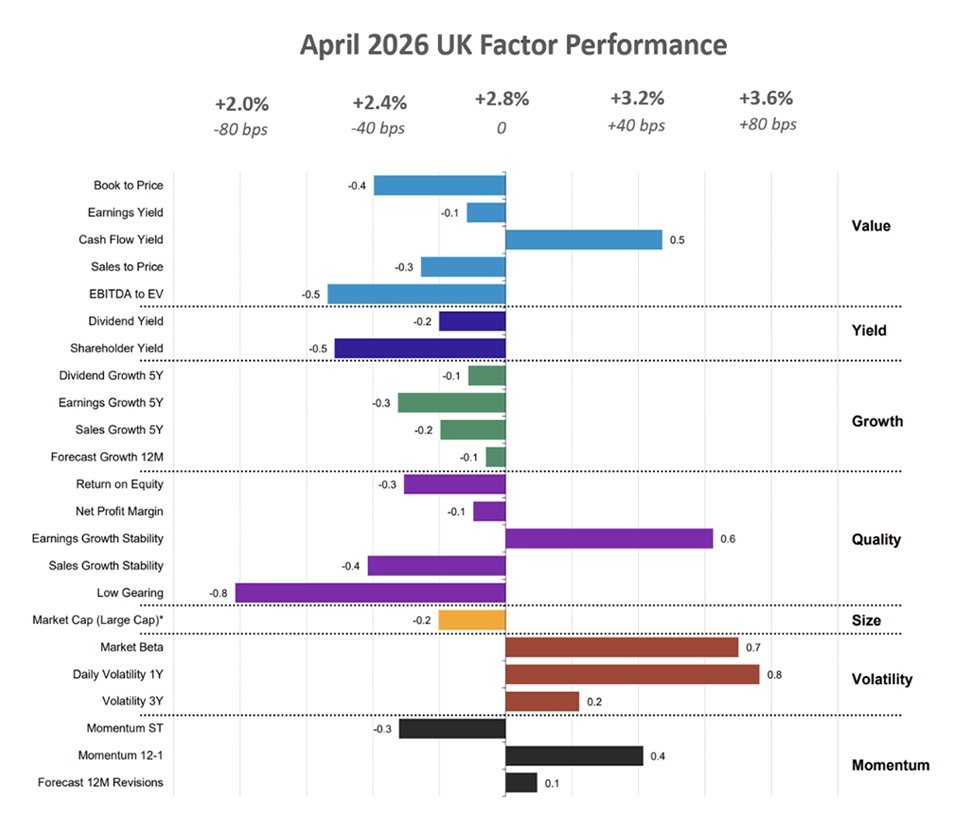
UK equities
UK equities recovered in April 2026, with market performance improving from -6.6% in the previous month to a positive 2.8%, supported by the broader recovery in global risk sentiment and easing concerns around inflation and growth. The rebound was driven by improving investor confidence following stronger global corporate earnings and stabilizing energy prices.
However, the UK market underperformed relative to the U.S. and Eurozone, largely due to its heavier sector exposure to defensive industries such as energy, financials, and consumer staples, and its comparatively lower weighting in high-growth technology stocks that led the global equity rally.
In addition, persistent weakness in domestic economic activity and slower earnings momentum limited the scale of the recovery compared to other developed markets.
From a factor perspective, investor sentiment in the UK shifted similarly to other developed regions during April. Following March’s risk-off environment, where investors favored defensive Value and Yield exposures for stability and income generation, improving market sentiment in April encouraged a rotation back toward higher-beta and growth-oriented segments of the market. As recession fears moderated and risk appetite improved, Momentum and Volatility factors outperformed, reflecting renewed investor interest in cyclical sectors and stocks with stronger earnings potential. Nevertheless, the UK’s more defensive market composition meant that this rotation was less pronounced than in the U.S. and Eurozone, contributing to the region’s relatively more modest overall performance.
UK annual inflation increased to 3.3% in March 2026 from 3.0% in each of the previous two months, in line with market expectations. Meanwhile, the unemployment rate declined to 4.9% in the three months to February 2026, indicating continued labor market resilience. However, manufacturing production contracted by 0.5% year-over-year in February 2026, reflecting ongoing weakness in the industrial sector.
British stocks with strong daily volatility 1Y that outperformed this month include industrials company Rolls Royce Holdings Plc (+8% in April); financials company Barclays Plc (+14% in April). Stocks that led the region’s Market Beta factor’s outperformance include – consumer staples company like Unilever PLC (6% in April) and utilities company National Grid PLC (7% in April).
Source: Confluence Style Analytics
Emerging markets equities
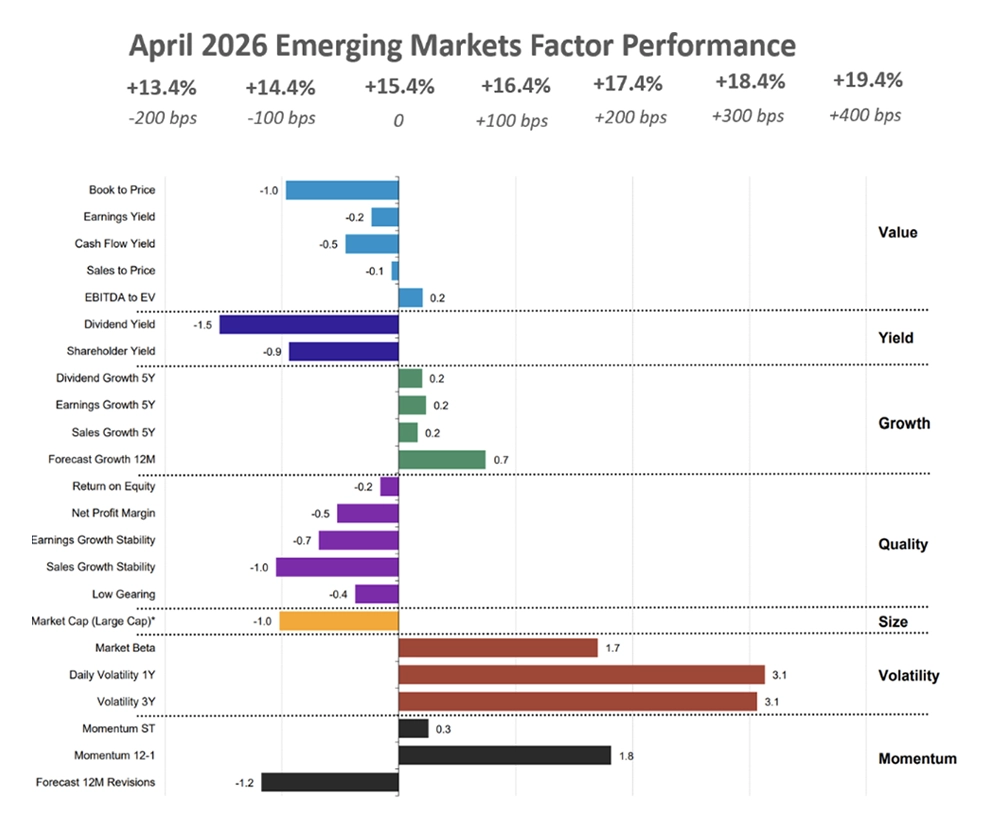
Emerging market equities rebounded sharply in April 2026, rising from -13.0% in the previous month to +15.4%, outperforming all developed regions.
The recovery was driven by a broad improvement in global risk sentiment, easing trade and growth concerns, stabilizing U.S. yields, and a softer dollar, which together supported capital flows back into higher-risk assets. Stronger commodity prices and renewed optimism around global growth and AI-linked supply chains further boosted sentiment, while the deep March selloff also created scope for a strong rebound as positioning normalized.
From a factor lens, sentiment shifted decisively away from defensive Value and Yield exposures toward higher-beta styles. Investors rotated into Volatility, Growth, and Momentum factors, favoring stocks with stronger earnings sensitivity and greater leverage to improving global conditions. This reflected a clear move from capital preservation in March to a more risk-seeking stance in April, with emerging markets benefiting most from the return of growth-oriented and momentum driven flows.
China’s annual inflation rose to 1.2% in April 2026, up from 1.0% in the previous month, while the surveyed urban unemployment rate edged higher to 5.4% in March from 5.3%. In India, inflation increased to 3.4% in March 2026 compared to 3.21% in the prior month, alongside a rise in the unemployment rate to 5.1% from 4.9%. Taiwan also saw inflation pick up, accelerating to 1.74% in April 2026 from 1.20% in March, while the seasonally adjusted unemployment rate ticked up slightly to 3.35% in March from 3.33% in February.
Emerging markets equities that outperformed in the month of April, captured by the forecast growth 12M, include Chinese info tech company Foxconn Industrial Internet Co ltd (26% in April); and Taiwanese info tech company Delta Electronics (58% in April). Companies with progressing volatility 1Y in this month include Chinese consumer discretionary company Alibaba Group Holdings Ltd (+7% in April) and Chinese info tech company Zhongji Innolight Co Ltd (52% in April).
Source: Confluence Style Analytics
Canadian equities
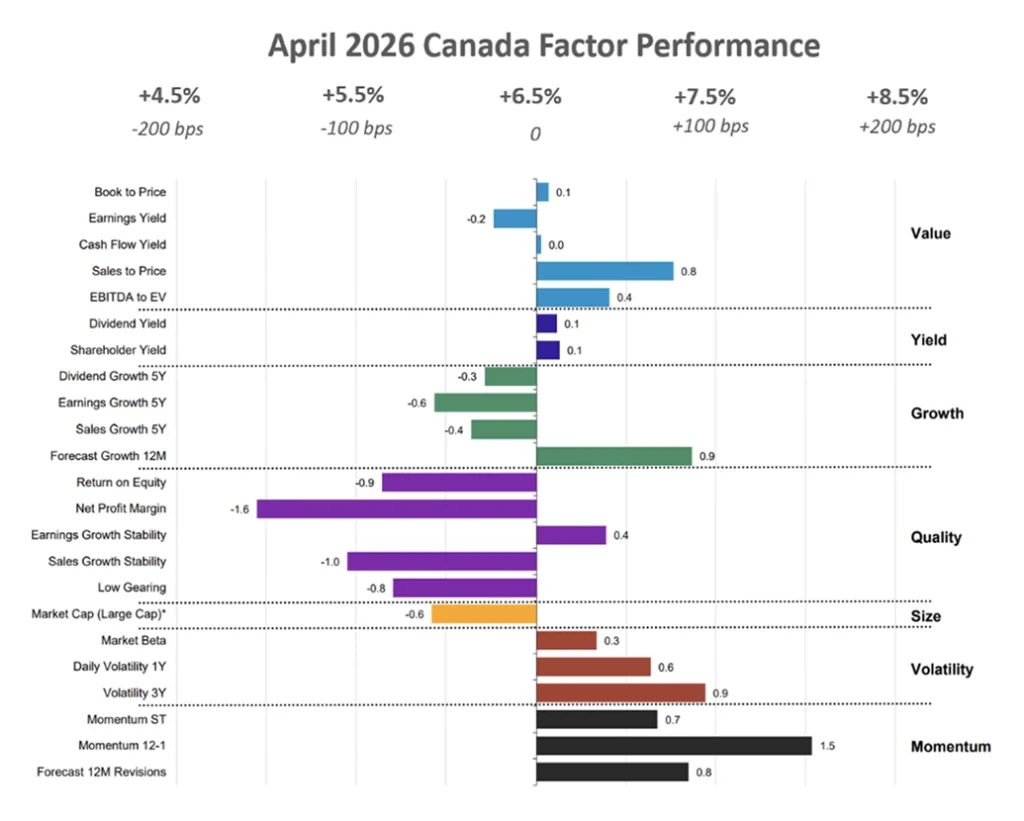
Canadian equities rebounded strongly in April 2026, recovering from -6.9% in the previous month to +6.5%, same as the other region’s seen previously – supported by improving global risk sentiment, stabilizing commodity and energy prices, and renewed confidence in economic resilience and AI-driven growth trends. Expectations for less restrictive central bank policy later in the year also supported investor sentiment, while cyclical sectors such as materials and financials recovered following March’s sharp selloff.
From a factor perspective, investor sentiment shifted away from the defensive Value and Quality factors that outperformed in March and toward higher-beta exposures in April. Volatility and Momentum factors led performance as investors rotated back into cyclical and growth-sensitive areas of the market, reflecting a broader move from risk aversion toward more risk-seeking behavior.
Canada’s headline inflation rate increased sharply to 2.4% in March 2026 from 1.8% in the previous month. Meanwhile, the unemployment rate rose to 6.9% in April 2026 from 6.7% previously, indicating some softening in labor market conditions. At the same time, manufacturing production declined by 3.1% year-over-year in February 2026, reflecting continued weakness in industrial activity.
Stocks with strong volatility 3Y in the region include financials companies Canadian Imperial Bank of Commerce (+18 % in April), and Bank of Nova Scotia (+14% in April). High momentum 12-1 stocks that contributed to the region’s performance include financials company Bank of Montreal (14% in April) and financials company Toronto-Dominion Bank (16% in April).
Source: Confluence Style Analytics
Appendix: How to read the charts
Each factor’s performance is based on the relative performance of its top 50% of stocks by market cap, compared to the overall market. The Size factor uses the top 70% of stocks, as the only exception.
For example, for the book-to-price factor, we determine the period’s performance of the basket of stocks with the highest book-to-price values, relative to the total market. Each factor is analyzed independently, market and fundamental data are adjusted to enable sector-average (within each country) relative data to be used, and the performance measurement isolates the factor’s contribution to return.
Disclaimer
Author

About Confluence® Technologies
Confluence is a global leader in enterprise data and software solutions for regulatory, analytics, and investor communications. Our best-of-breed solutions make it easy and fast to create, share, and operationalize mission-critical reporting and actionable insights essential to the investment management industry. Trusted for over 30 years by the largest asset service providers, asset managers, asset owners, and investment consultants worldwide, our global team of regulatory and analytics experts delivers forward-looking innovations and market-leading solutions, adding efficiency, speed, and accuracy to everything we do. Headquartered in Pittsburgh, PA, with 700+ employees across North America, the United Kingdom, Europe, South Africa, and Australia, Confluence services over 1,000 clients in more than 40 countries. For more information, visit www.confluence.com.