
May 2024 Factor Performance Analysis
Market background
After experiencing a decline in April, equity markets saw a rise in May, with US and European markets outpacing other regions. Big tech stocks once again delivered strong performances, accounting for over half of the S&P 500’s gain in May. The US Dollar Index declined in May, for the first time in 2024, with the dollar weakening against most major currencies.
Inflation in the eurozone is relatively low at 2.4% year-on-year compared to the United States. European economies seem to be rebounding after a prolonged period of stagnation and now demonstrate surprising strength.
Crude oil peaked at $79/barrel in May before easing to month-end prices at $76/barrel. In the first week of June, the price eased to a low of $73/barrel.
Gold prices continued to surge in May, peaking at $2,426/ troy ounce before stabilizing at $2,343 by the end of the month. Bitcoin made its all-time high in May, with mining capacity increasing by 5.0 EH/s. The dollar declined 1.5% in May after advancing for four consecutive months.
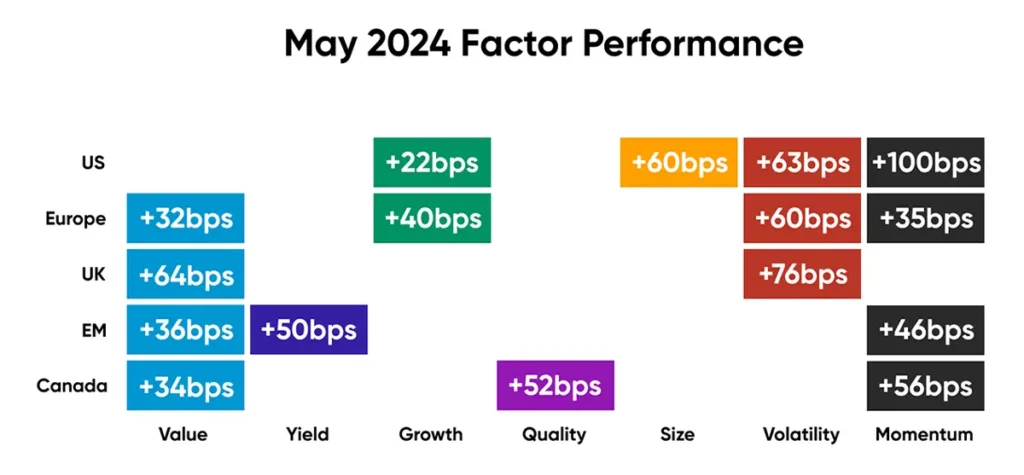
Factor summary
- US Equities: Growth, Size, Volatility, and Momentum outperformed
- Europe: Value, Growth, Volatility, and Momentum outperformed
- UK: Value and Volatility outperformed
- Emerging Markets: Value, Yield, and Momentum outperformed
- Canada: Value, Quality, and Momentum outperformed
Source: Confluence
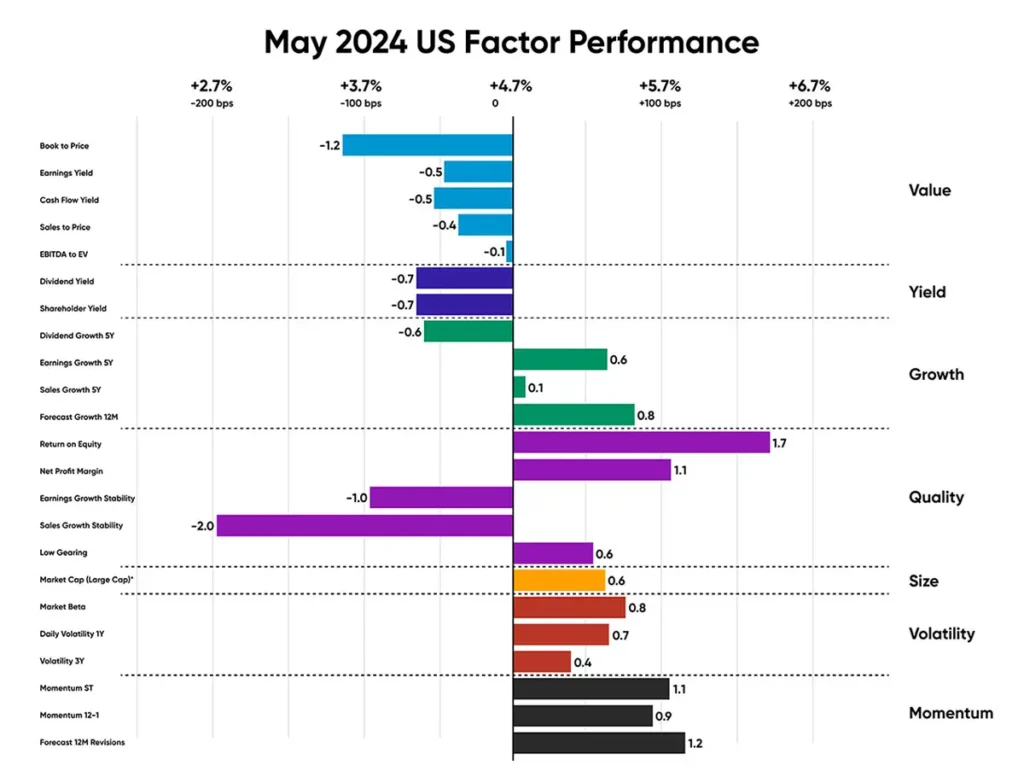
US equities
The US market, in May, recouped its previous month’s decline, reaching a record high performance. Momentum subfactors outperformed again this month by approximately 100 bps, while Volatility subfactors closely followed, outperforming the market by 60 bps. The driving force behind the surge can be attributed to the concentration of large tech stocks, which constitute substantial portions of indices. Quality subfactors, particularly return on equity and net profits margin, outpaced the market by an average of 140 bps.
US economic growth, as measured by Gross Domestic Product, has slowed while inflation has risen. The growth was primarily driven by real wage increases and a reduction in household savings, whereas inflation was fueled by robust services consumption.
Stocks with resilient return on equity that contributed to the performance of the US market in May include the tech giants NVIDIA (27% in May), Apple (13% in May), Meta Platforms (9% in May) and Alphabet (6% in May). Additionally, companies with high forecasted earnings, including healthcare company Eli Lilly (+5% in May), industrials company General Electric (+2% in May), and utilities company Nextera Energy (+19% in May), also contributed to the outperformance.
Source: Confluence
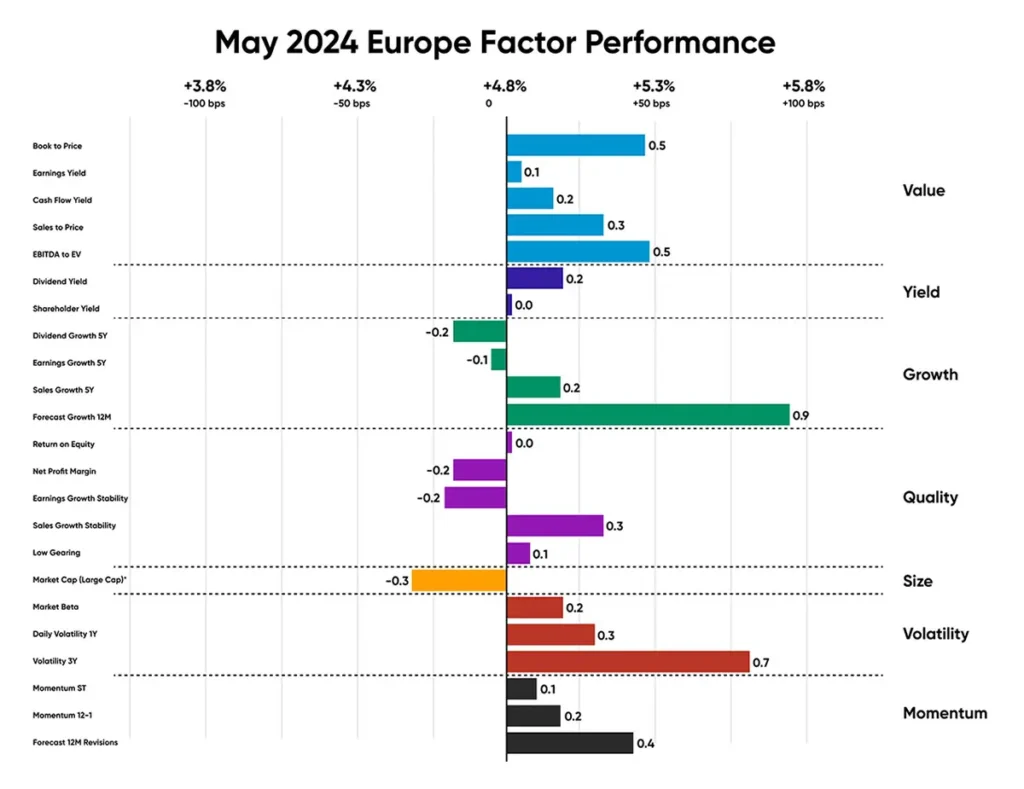
European equities
In Europe, value stocks continued to outperform, extending the previous month’s trend. In addition to value, the Yield, Volatility, and Momentum subfactors also demonstrated resilience throughout May.
A positive trend was noted in Growth subfactors, particularly in sales growth over 5 Years and forecast growth for 12 Months, with the latter outperforming by 90 bps.
Eurozone inflation increased to 2.6% in May from 2.4% in April, and services inflation, a key metric for the ECB, rose to 4.1% from 3.7%. The Eurozone unemployment report shows that it hit a new record low of 6.4%. The number of unemployed people decreased by 100,000 from the previous month.
Key drivers of high-Value European stocks with stable book-to-price in the month of May include info tech company ASML Holdings (+6% in May), healthcare company Merck (+14% in May), and financials company BNP Paribas (+9% in May).
Companies with high forecasted earnings, including German financials company Muenchener Rueckversicher (+21% in May), French industrials company Safran (+8% in May), and French consumer staples company L’oreal (+5% in May), also contributed to the Eurozone’s outperformance.
Source: Confluence
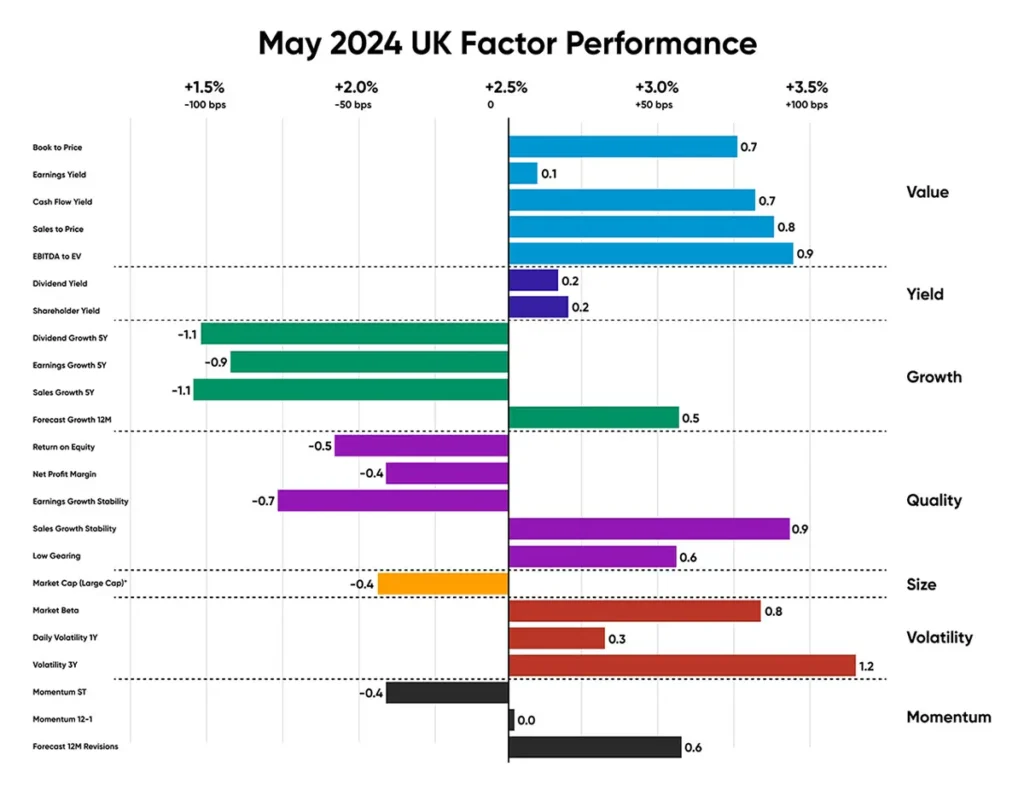
UK equities
Similar to its American and European counterparts, the United Kingdom observed Value stocks outperforming in May, outperforming the market by approximately 64 bps. Volatility also outperformed by a notable margin, about 76 bps. Sales growth stability outperformed among Quality stocks, achieving an outperformance of 90 bps.
British inflation dropped sharply to 2.3% from the previous month’s 3.2%, yet it remains above the Bank of England’s 2% target. Core inflation, which excludes food and energy prices, remained persistent at 3.9%, while services inflation slightly eased to 5.9% YoY.
British stocks with a strong EBITDA to EV that outperformed this month include consumer staples company Unilever (+6% in May, +12% in the last three months) and BT Group (+29% in May, +26% in the last three months). Key drivers of high 3-year volatility companies that contributed to the outperformance include healthcare company GSK PLC (+8% in May, +8% in the last three months), industrials companies Rolls Royce Holdings Plc (+12% in May, +24% in the last three months), and Experian Plc (+13% in May, +7% in the last three months).
Source: Confluence
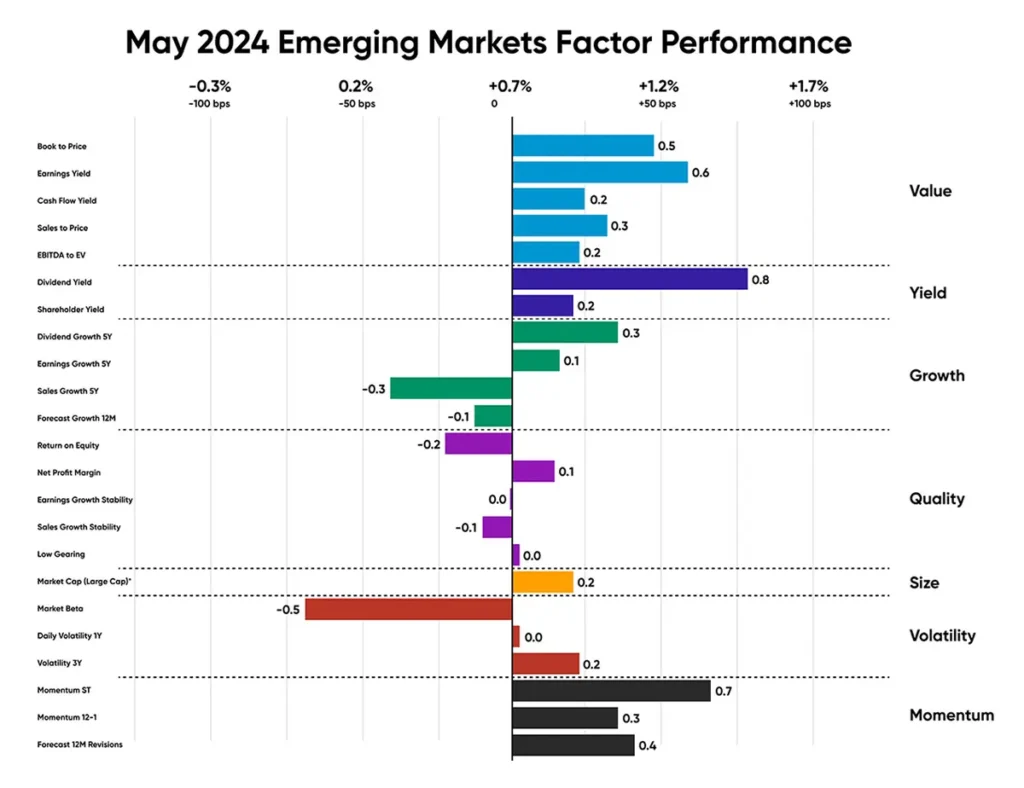
Emerging market equities
The factor trend in Emerging Markets remained consistent with those observed in other regions, with Value stocks generating active returns against the market, outperforming approximately 36bps. We observed a conservative trend in May, favoring stocks with strong dividend yield and dividend growth over five years. These trends were captured in the momentum short-term subfactor, largely driven by strong equity returns in specific Indian sectors this month.
Emerging Markets equities that outperformed in the month of May, captured by the Momentum short-term subfactor, include tech company Taiwan Semiconductor (+5% in May, +17% in the last three months); Chinese communication services company Tencent Holdings Ltd (+4.5% in May, +25% in the last three months) and Indian materials company Hindustan Zinc Ltd (+64% in May, +126% in the last three months). Stocks with a steady dividend yield in the region that outperformed include Chinese companies from the communication services sector, China Mobile Ltd (+7% in May, +13% in the last three months), and from the financial sector, China Construction Bank (+9% in May, +14% in the last three months).
Source: Confluence
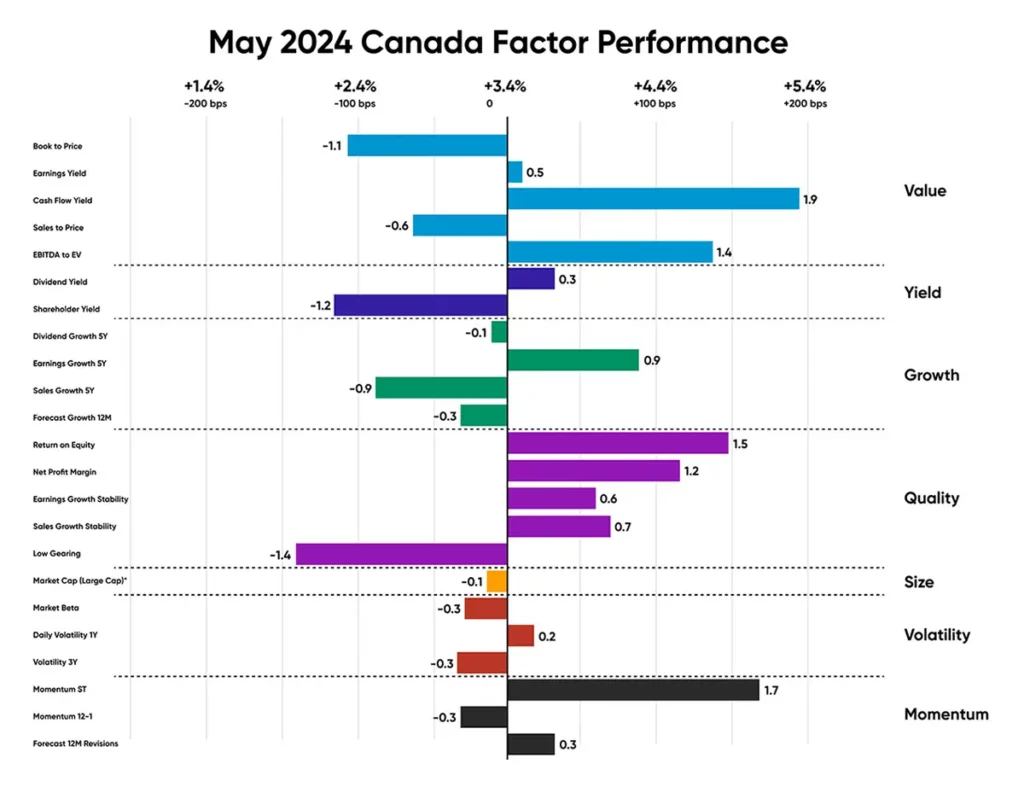
Canadian equities
The factor performance trend was more mixed in Canada, with neither value nor growth delivering significant premiums. In Value, stocks with a high cash flow yield outperformed, but stocks with strong Book-to-price ratios drowned out that active return. Likewise, within Growth, although companies with good earnings growth 5Y delivered a 90bps premium, stocks with strong sales growth and forecast growth of 12M underperformed overall.
A notable trend in Canada was observed in Quality sub-factors, with an outperformance of 52 bps, with return on equity and net profit margin leading the trend. However, the underperformance in companies with low gearing hindered the performance.
Stocks with a steady cash flow yield in the region that have outperformed include energy companies Suncor Energy Inc. (+7% in May, +20% in the last three months), Canadian Natural Resources (+2% in May, +11% in the last three months), and materials company Agnico Eagle Mines (+8% in May, +42% in the last three months).
Key companies driving the momentum short-term performance in May were financials companies Royal Bank of Canada (+13% in May, +14% in the last three months), Manulife Financials (+12% in May, +11% in the last three months), and information and services company Thompson Reuters (+15% in May, +9% in the last three months).
Source: Confluence
Disclaimer
The content provided by Confluence Technologies, Inc. is for general informational purposes only and does not constitute legal, regulatory, financial, investment, or other professional advice. It should not be relied upon as a substitute for specific advice tailored to particular circumstances. Recipients should seek guidance from appropriately qualified professionals before making any decisions based on this content.
Unless otherwise stated, Confluence Technologies, Inc. (or the relevant group entity) owns the copyright and all related intellectual property rights in this material, including but not limited to database rights, trademarks, registered trademarks, service marks, and logos.
No part of this content may be adapted, modified, reproduced, republished, uploaded, posted, broadcast, or transmitted to third parties for commercial purposes without prior written consent.
Author

About Confluence® Technologies
Confluence is a global leader in enterprise data and software solutions for regulatory, analytics, and investor communications. Our best-of-breed solutions make it easy and fast to create, share, and operationalize mission-critical reporting and actionable insights essential to the investment management industry. Trusted for over 30 years by the largest asset service providers, asset managers, asset owners, and investment consultants worldwide, our global team of regulatory and analytics experts delivers forward-looking innovations and market-leading solutions, adding efficiency, speed, and accuracy to everything we do. Headquartered in Pittsburgh, PA, with 700+ employees across North America, the United Kingdom, Europe, South Africa, and Australia, Confluence services over 1,000 clients in more than 40 countries. For more information, visit www.confluence.com.