
Value & yield factors drive active managers to outperform in emerging markets equity
Emerging markets equity performance
2023 marked the third consecutive year that developed markets equity has outperformed emerging markets. For the year, the MSCI World Index returned 24.42%, more than double the MSCI Emerging Markets Index return of 10.26%. Although their performance lagged in absolute terms, active managers of emerging markets equity outperformed their benchmarks. For the year, the median in the broad IM Emerging Markets Equity Peer Group beat the MSCI Emerging Markets Index by 260 basis points and the MSCI Emerging Markets IMI Index by 80bps. Comparatively, the median within developed markets large cap peer groups underperformed for the year.
Figure 1 below is a percentage breakdown by characteristics of the 99 products with above median performance for the year. From a style perspective, core and value dominated growth, accounting for 84% of these products. Within growth, products either excluded China completely or were well underweight. Also of note is that quantitative products made up 35%, while small cap products accounted for 23%.
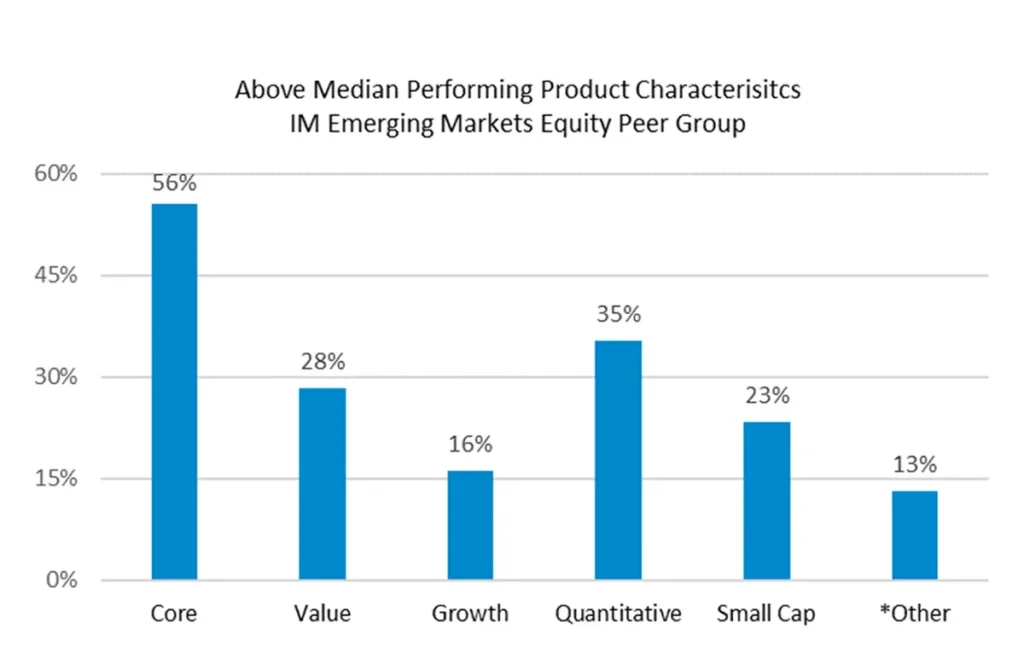
Source: Investment Metrics, a Confluence company
*Other: Ex China, Frontier & Low Volatility.
In Figure 2 below, we show the Style Analytics Master Skyline for the same above median-performing products from the IM Emerging Markets Peer Group. The leading factors driving active manager performance were Value, Yield, Quality, and Momentum, as my colleague Alex Lustig noted in the 2023 Factor Performance Analysis report. In Emerging Markets, the triumvirate of Value, Yield, and dividend growth, aka the “three musketeers”, continue to dominate throughout December, Q4, and 2023, mirroring patterns from past years.
Comparing the factors that drove the markets to the factors that drop active manager performance, Momentum stands out, especially within the quantitative and small cap focused products.Other: Ex China, Frontier & Low Volatility.
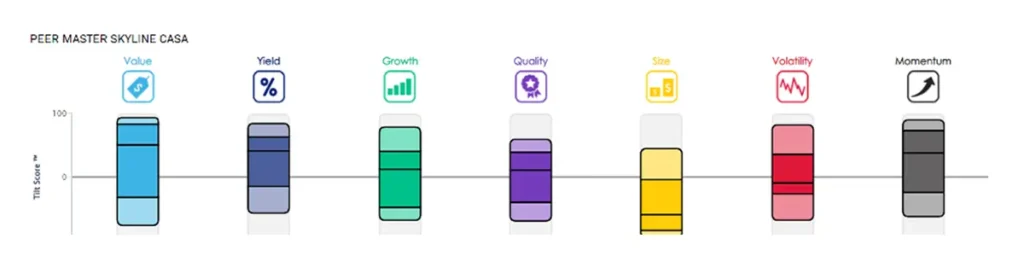
Source: Investment Metrics, a Confluence company
Disclaimer
The content provided by Confluence Technologies, Inc. is for general informational purposes only and does not constitute legal, regulatory, financial, investment, or other professional advice. It should not be relied upon as a substitute for specific advice tailored to particular circumstances. Recipients should seek guidance from appropriately qualified professionals before making any decisions based on this content.
Unless otherwise stated, Confluence Technologies, Inc. (or the relevant group entity) owns the copyright and all related intellectual property rights in this material, including but not limited to database rights, trademarks, registered trademarks, service marks, and logos.
No part of this content may be adapted, modified, reproduced, republished, uploaded, posted, broadcast, or transmitted to third parties for commercial purposes without prior written consent.
Author

About Confluence® Technologies
Confluence is a global leader in enterprise data and software solutions for regulatory, analytics, and investor communications. Our best-of-breed solutions make it easy and fast to create, share, and operationalize mission-critical reporting and actionable insights essential to the investment management industry. Trusted for over 30 years by the largest asset service providers, asset managers, asset owners, and investment consultants worldwide, our global team of regulatory and analytics experts delivers forward-looking innovations and market-leading solutions, adding efficiency, speed, and accuracy to everything we do. Headquartered in Pittsburgh, PA, with 700+ employees across North America, the United Kingdom, Europe, South Africa, and Australia, Confluence services over 1,000 clients in more than 40 countries. For more information, visit www.confluence.com.