
With the UK general election scheduled for July 4th 2024, we conducted a historical analysis of factor performance in the periods surrounding previous elections. In total, we analyzed six UK general election periods between 2001 and 2019, examining how factors performed in the six months leading up to and following the vote.
Key Findings
- Value stocks outperform the market in the period leading up to an election, while Momentum underperforms.
- Performance reverses post-election, with Value underperforming, and Momentum outperforming
- Large caps perform best in periods following an election, while Quality fares well throughout
- Uncertainty, and a declining equity risk premium surrounding elections is the likely driver behind these trends, supporting a shift from Value to Momentum as uncertainty dissipates.
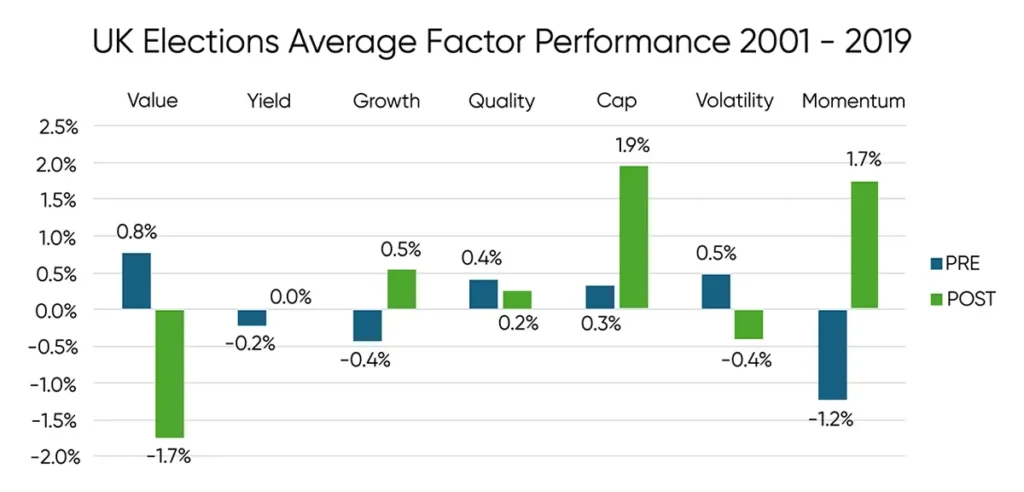
Source: Style Analytics Markets Analyzer
The chart above shows the average market relative performance of each factor category over the past six elections. Value stocks tend to outperform the market in the lead-up to an election and then subsequently underperform in the following period. Growth and Momentum demonstrate the inverse of that trend, underperforming in the lead-up to an election and outperforming in the following period, with Momentum demonstrating the strongest signal. Meanwhile, large caps tended to perform the best in post-election periods.
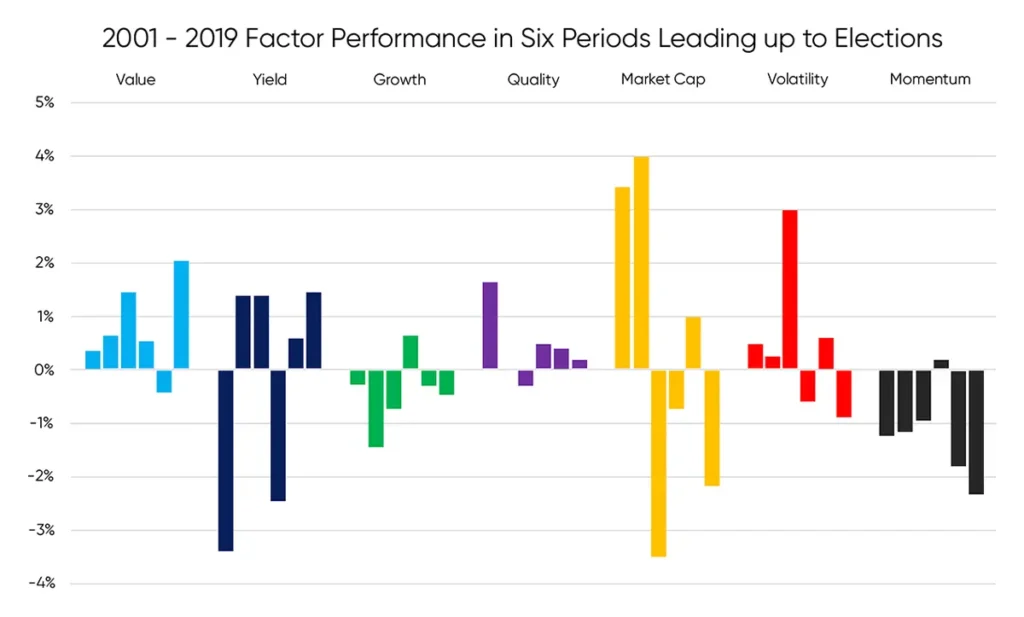
Source: Style Analytics Markets Analyzer
The chart above demonstrates how consistently factors performed by comparing their performance in the period leading up to each of the six elections in our analysis. Here, we can see that the strongest signals come from Value, outperforming in five of six periods, as well as Growth and Momentum, which underperformed in five of six periods.
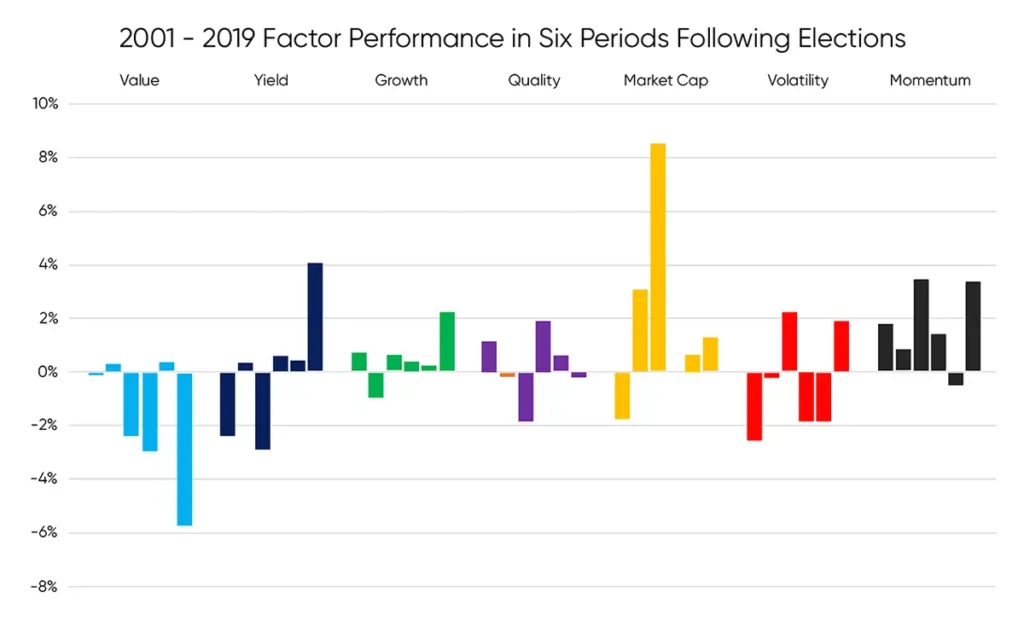
Source: Style Analytics Markets Analyzer
In the periods following elections, we see the key factor signals flip. In these periods, Value underperformed significantly in three periods, and was market neutral in the other three. Growth tended to outperform modestly, while Momentum was the best performer.
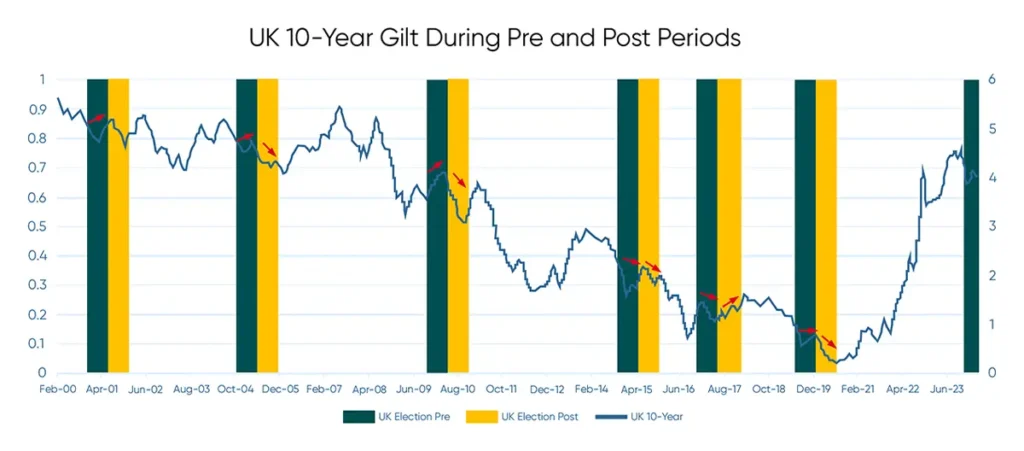
Federal Reserve Economic Data
To contextualize these trends, we looked at the UK 10-Year Gilt. The red arrows in the above chart show that rates rose in the periods leading up to the first three elections in our analysis, indicating strength for Value. Meanwhile, in the three more recent periods, rates tended to be flat, or slightly down. The more consistent trend was in the periods following elections, where rates reversed. In five of the six periods, we saw rates decline substantially, which indicates Value weakness, Growth strength, and an environment where Momentum gained.
One explanation for our findings is that periods leading up to elections are often marked by uncertainty. This causes rates to rise and the equity risk premium to decrease, tilting the scales for Value over Growth. Once the election results are confirmed, that uncertainty dissipates, and investors proceed to allocate capital. This leads to a momentum wave where popular trades do well in the medium term and interest rates decline as the equity risk premium increases. One key exception where rates didn’t fall post-election was in 2017, where the results led to yet more uncertainty and a lack of confidence as conservatives lost their majority.
Looking at history, it matters less which party comes out on top, but instead simply that the election results go from an unknown to a known. In short, if we see history repeat: wait and see, and the trend will be your friend.
Disclaimer
The content provided by Confluence Technologies, Inc. is for general informational purposes only and does not constitute legal, regulatory, financial, investment, or other professional advice. It should not be relied upon as a substitute for specific advice tailored to particular circumstances. Recipients should seek guidance from appropriately qualified professionals before making any decisions based on this content.
Unless otherwise stated, Confluence Technologies, Inc. (or the relevant group entity) owns the copyright and all related intellectual property rights in this material, including but not limited to database rights, trademarks, registered trademarks, service marks, and logos.
No part of this content may be adapted, modified, reproduced, republished, uploaded, posted, broadcast, or transmitted to third parties for commercial purposes without prior written consent.
Author

About Confluence® Technologies
Confluence is a global leader in enterprise data and software solutions for regulatory, analytics, and investor communications. Our best-of-breed solutions make it easy and fast to create, share, and operationalize mission-critical reporting and actionable insights essential to the investment management industry. Trusted for over 30 years by the largest asset service providers, asset managers, asset owners, and investment consultants worldwide, our global team of regulatory and analytics experts delivers forward-looking innovations and market-leading solutions, adding efficiency, speed, and accuracy to everything we do. Headquartered in Pittsburgh, PA, with 700+ employees across North America, the United Kingdom, Europe, South Africa, and Australia, Confluence services over 1,000 clients in more than 40 countries. For more information, visit www.confluence.com.