
As we navigate through 2024, uncertainties loom large on the horizon. High interest rates in major economies influence global economic dynamics, and geopolitical tensions cast shadows over the future. Investors find themselves grappling with the complexities of analyzing financial market trajectories amidst this backdrop of uncertainty.
Bonds
The anticipation of rate cuts by the FEDs has been met with skepticism this year, particularly in light of escalating inflationary pressures. Recent reports from the US Bureau of Labor Statistics indicate that the Consumer Price Index (CPI) comes in at 3.4% YoY, in line with expectations, while the unemployment rate hovers between 3.7% and 3.9%. These factors have contributed to a delay in expected rate cuts, with market confidence in bonds bolstering and yields rising in response.
After the last FED announcement, on March 20th, short-term bond yields fell slightly, but since then, the reference rates of the US Treasury Curve have been higher than the previous month.
Source: Confluence Internal Data Team.
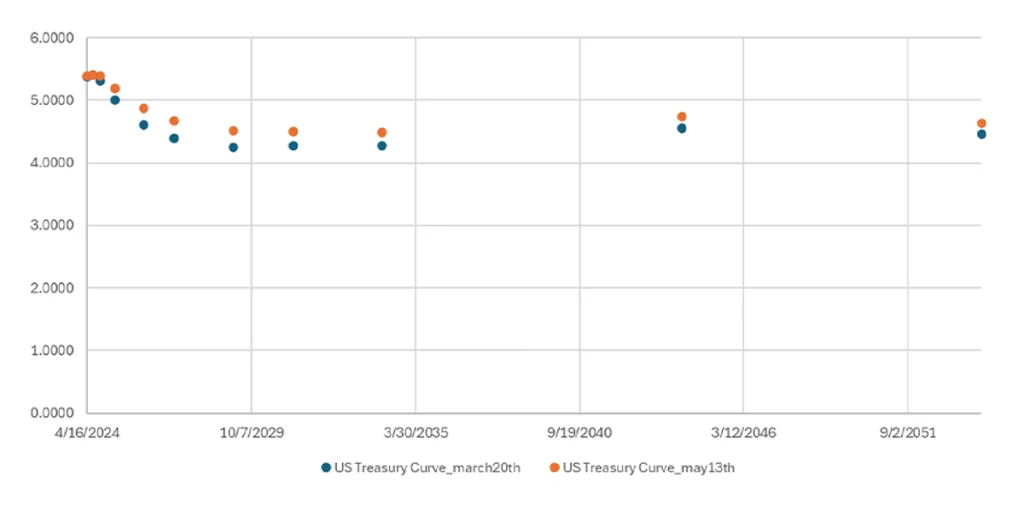
Source: Confluence Internal Data Team.
The benchmark 10-year US Treasury rate fell by one basis point, reaching 4.48% as of May 13th.
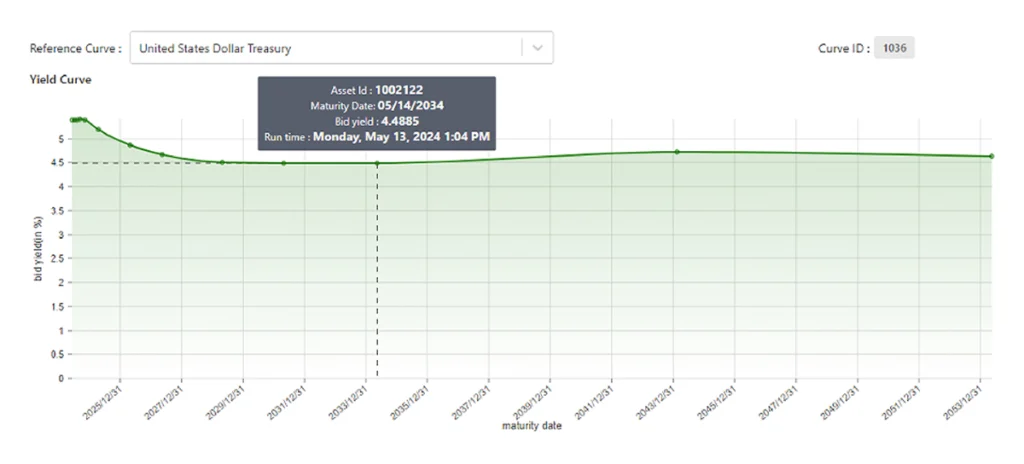
Source: Confluence Internal Data Team.
The likelihood of rate cuts in the US before September 2024 seems low. If this situation continues, there will be a gap of 14 months or longer between the last rate hike (July 2023) and the first rate cut. According to Bloomberg data, markets anticipate only two cut rates this year, each of Quarter-Point, based on recent growth and employment data.
| Date | Increase | Decrease | Level (%) |
|---|---|---|---|
| March 20, 2024 | 0 | 0 | 5.25 – 5.50 |
| January 31, 2024 | 0 | 0 | 5.25 – 5.50 |
| December 14, 2023 | 0 | 0 | 5.25 – 5.50 |
| July 27, 2023 | 25 | 0 | 5.25 – 5.50 |
| May 4, 2023 | 25 | 0 | 5.00 – 5.25 |
| March 23, 2023 | 25 | 0 | 4.75 – 5.00 |
| February 2, 2023 | 25 | 0 | 4.75 – 5.00 |
Outside the US, some Central Banks have begun to cut rates. The first two developed countries to cut rates were The Riskbank, Sweden’s central bank, and The Swiss National Bank, due to a continued economic weakness. The Bank of England is also expected to jump ahead of the FED and make a similar decision. Governor Andrew Bailey expressed confidence that inflation indicators showed signs of being under control and a rate cut could be expected before August.
This week, China is set to commence the sale of government bonds amounting to nearly 1 trillion yuan, as part of its efforts to bolster the economy. The initial offering will consist of 30-year bonds, and the announcement has been positively received by global financial markets.
Now timelines and final requirements have been confirmed, Confluence’s regulatory and technology experts are addressing these in detail to ensure full coverage and compliance from data vendors and risk models to meet the disclosure report formats. Further details of Confluence’s support for the final SDR requirements will be announced in the future.
Precious metals
In contrast to bonds, the prices of precious metals such as gold and silver have seen an upward trajectory. Market participants are increasingly turning to these safe-haven assets amidst the prevailing uncertainties. Analysts are closely studying the price dynamics between gold and silver, with some forecasting that silver’s performance may outshine gold. CNBC states that silver prices are more dependent on the economy because, along with jewelry, it is used in many industrial applications. Silver’s significant role in industrial applications, coupled with its positive correlation with gold, suggests a potential rise in silver prices following gold’s lead.
Cryptocurrency
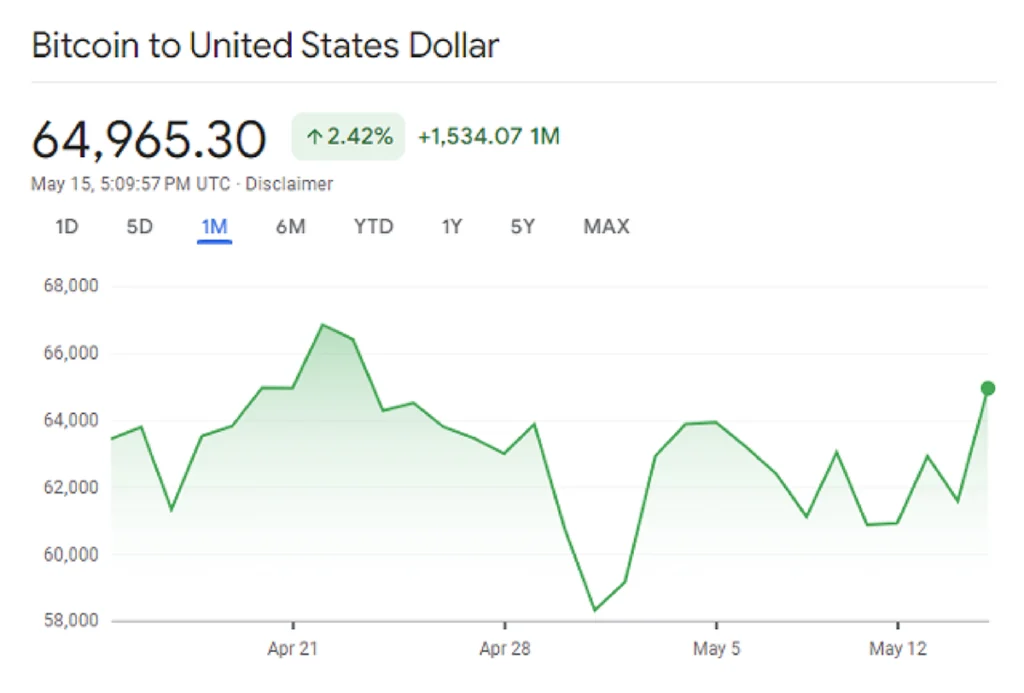
The highly anticipated Bitcoin halving event in April yielded only marginal price increases, dampening initial expectations. However, with diminishing prospects of rate cuts, investors may increasingly turn to cryptocurrencies as an alternative asset class in the future.
Stocks
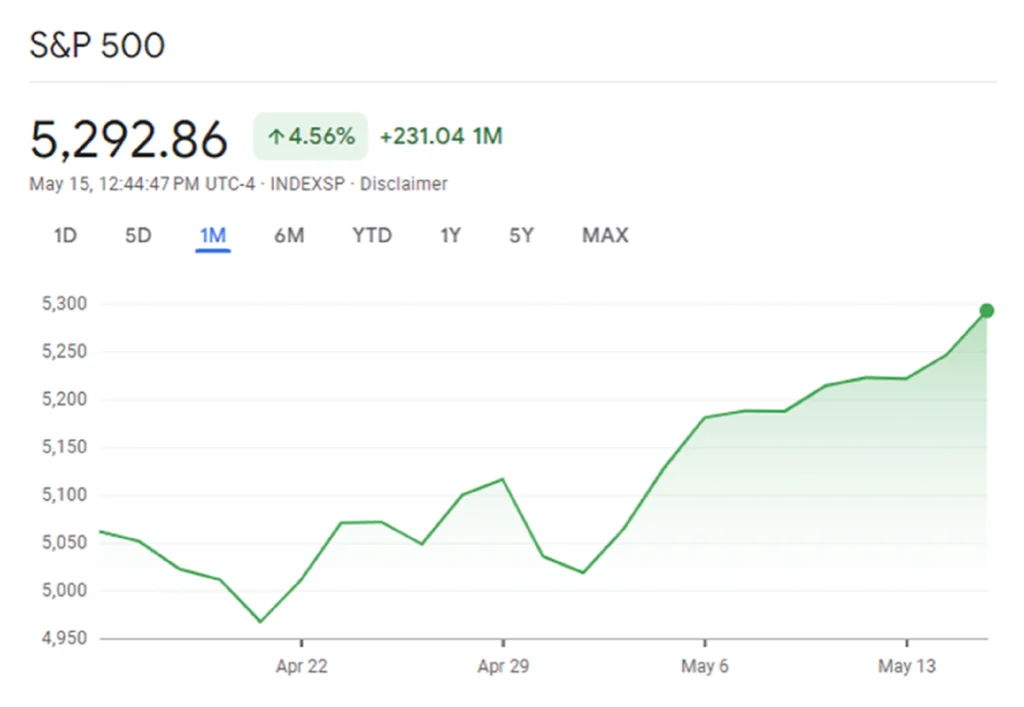
The major holdings in S&P are in the Information technology sector, with 29.7% weight in companies like Microsoft, Apple, Nvidia, Amazon, Meta, Alphabet, and others.
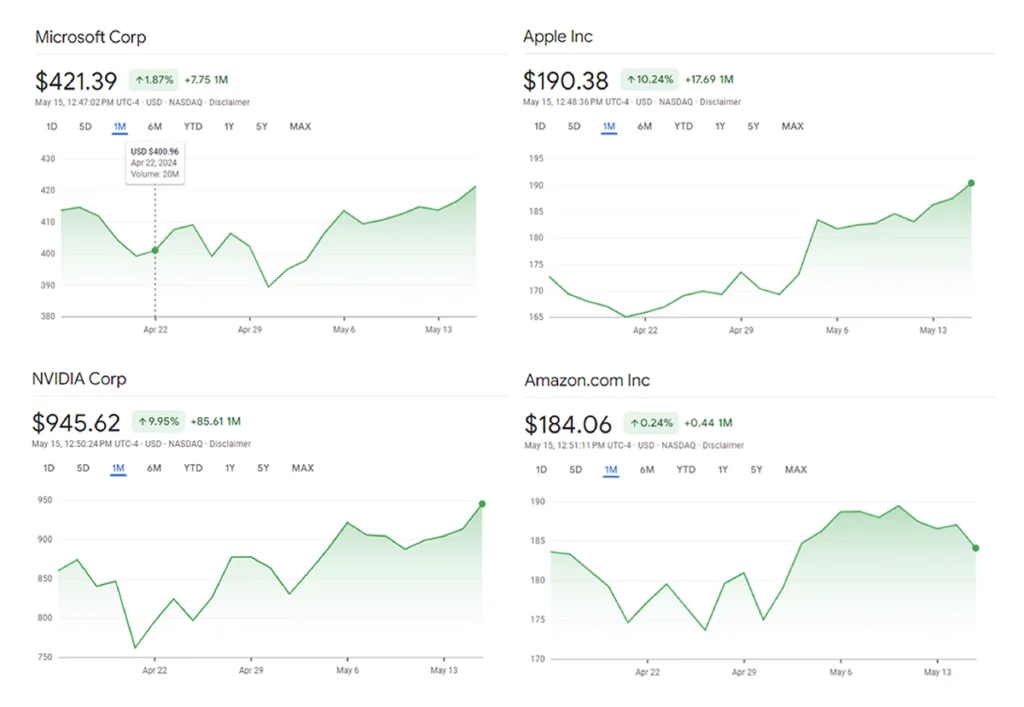
The Information Technology (IT) sector, comprising major holdings in the S&P 500, has witnessed a downturn in stock prices over the past month. While pinpointing the exact reasons for this decline is challenging, it is speculated that these stocks may have been overvalued during the pandemic, and corrections are still underway. Heavy investments in Artificial Intelligence (AI) by tech giants have heightened dependency on semiconductor supply chains, exacerbating challenges posed by supply chain disruptions, rising interest rates, and inflation, which have increased expenditures for these firms.
Tech sector bonds
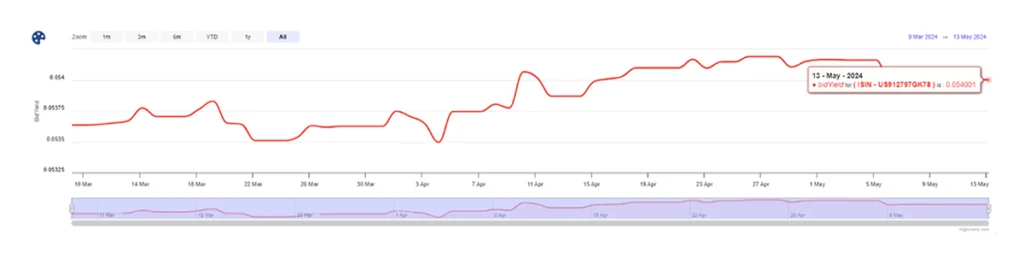
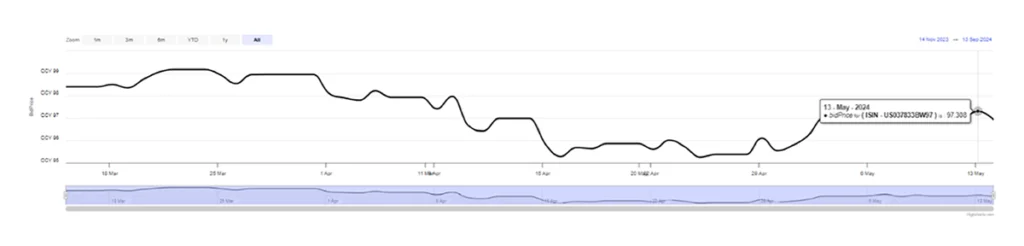
The tech sector’s bond prices have also been affected by rising yields, as seen in Apple’s bond yield increase below.
On Monday, May 2nd, after better-than-expected quarterly results, Apple’s bond yield decreased but is still at higher levels than at the beginning of last month. Apple also announced a $110 billion share buyback, and shares soared over 6% by Friday, May 10th. The company’s value reached 2.86 trillion dollars.
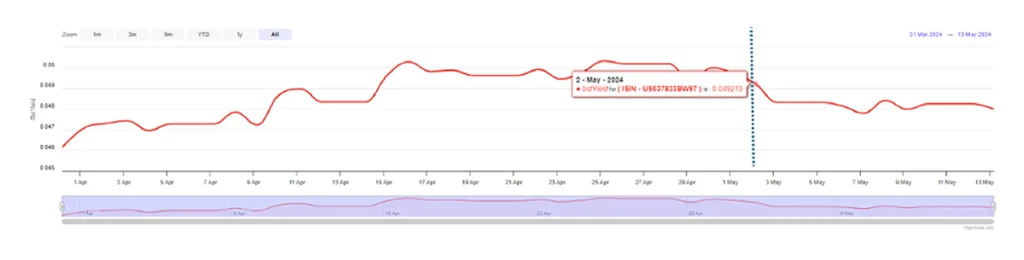
Source: Confluence Internal Data Team
Source: Confluence Internal Data Team
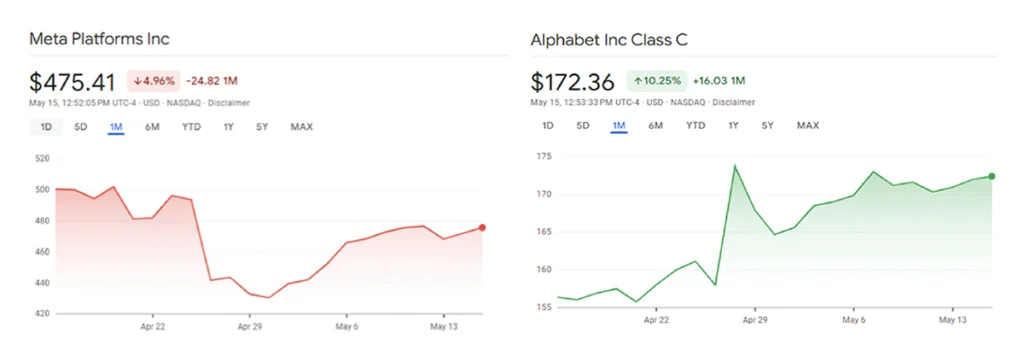
The upcoming quarterly financial reports from tech companies will provide clearer insights into the sector’s performance. Despite surpassing earnings estimates, Meta’s stock price fell by 17% following its financial results announcement on April 24.
The falling stock price could be attributed to weak revenue guidance. However, Mark Zuckerberg focused on increased infrastructure investments to support the Artificial Intelligence (AI) roadmap.
Elections around the world
With elections scheduled in approximately 64 countries, representing half of the world’s population, geopolitical landscapes are poised for transformation.
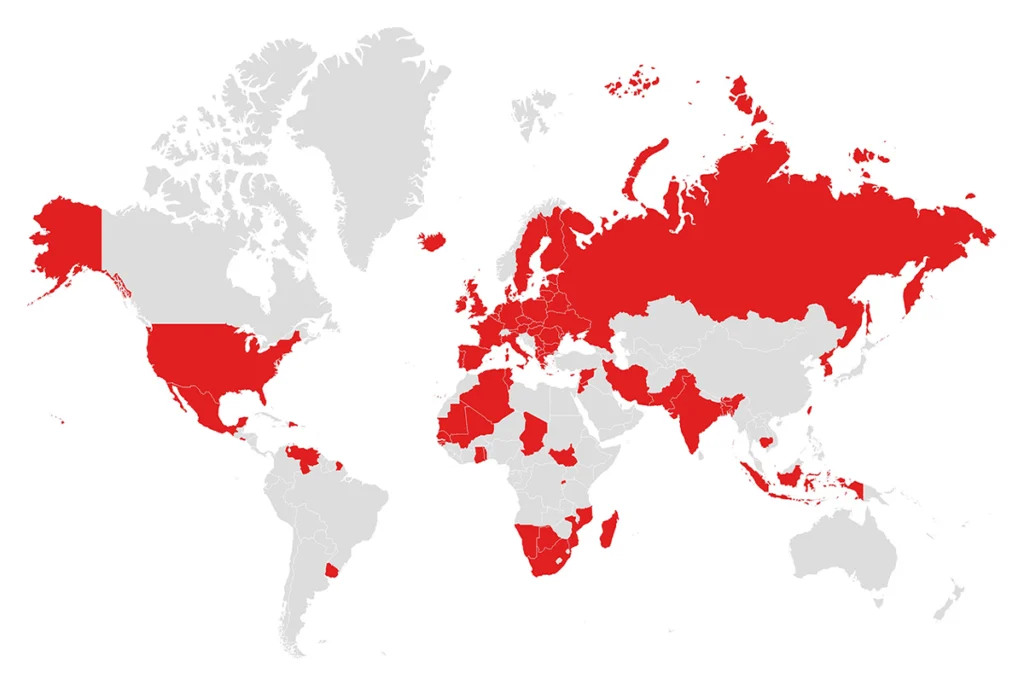
Key nations such as the USA, India, European Union members, Indonesia, Mexico, United Kingdom, and South Africa, among others, will be undergoing electoral processes, potentially reshaping the global economic landscape.
In navigating these political uncertainties, investors are increasingly exploring alternative assets such as commodities and digital assets. While traditional assets like stocks remain under scrutiny due to heightened volatility post-pandemic, bonds continue to serve as a resilient option amidst market fluctuations.
As we navigate the complexities of 2024, adaptability and strategic foresight will be paramount in navigating the ever-evolving financial terrain. Providing accurate valuations and pricing data will be paramount. You can rely on Confluence to provide you with independent valuation on your market data needs.
Appendix reference data
World Interest Rates Table
| Country | 10-year bid yield | Benchmark interest rate | Last change |
|---|---|---|---|
| Australia | 4.342% | 4.35% | November 6th, 2023 |
| Brazil | 11.76% | 10.50% | May 8th, 2024 |
| Canada | 3.695% | 5.00% | July 12th, 2024 |
| Switzerland | 0.7616% | 1.50% | March 21st, 2024 |
| China | 2.298% | 3.45% | August 22nd, 2023 |
| Germany | 2.507% | 4.50% | September 14th, 2023 |
| Japan | 0.942% | 0.10% | March 19th, 2024 |
| Mexico | 9.734% | 11.00% | March 21st, 2024 |
| New Zealand | 4.755% | 5.50% | May 24th, 2023 |
| Sweden | 2.332% | 3.75% | May 8th, 2024 |
| Türkiye | 25.8% | 50.00% | March 21st, 2024 |
| United Kingdom | 4.176% | 5.25% | Aug 3rd, 2023 |
| United States | 4.4885% | 5.50% | Jul 26th, 2023 |
| South Africa | 10.465% | 8.25% | May 25th, 2023 |
| Nigeria | 19.458% | 24.75% | March 25th, 2024 |
| Kenya | 17.24% | 13% | Feb 6th, 2024 |
Source: Refinitiv, Current Interest Rate, Source: Trading Economics
| Duration | Maturity date | US Treasury Curve: Mar 20th | US Treasury Curve: Mar 22nd | US Treasury Curve: Apr 23rd | US Treasury Curve: May 13th |
|---|---|---|---|---|---|
| 1M | 4/16/2024 | 5.3809 | 5.3858 | 5.3945 | 5.3901 |
| 3M | 6/20/2024 | 5.3962 | 5.3826 | 5.4153 | 5.3975 |
| 6M | 9/19/2024 | 5.3130 | 5.3019 | 5.3718 | 5.3839 |
| 1Y | 3/20/2025 | 4.9967 | 4.9783 | 5.1546 | 5.1848 |
| 2Y | 2/28/2026 | 4.6065 | 4.5934 | 4.9353 | 4.8676 |
| 3Y | 3/15/2027 | 4.3965 | 4.3543 | 4.7701 | 4.6692 |
| 5Y | 2/28/2029 | 4.2477 | 4.1857 | 4.6307 | 4.5075 |
| 7Y | 2/28/2031 | 4.2745 | 4.2024 | 4.6245 | 4.498 |
| 10Y | 2/15/2034 | 4.2767 | 4.1981 | 4.6025 | 4.4885 |
| 20Y | 2/15/2044 | 4.5490 | 4.4674 | 4.8468 | 4.7324 |
| 30Y | 2/15/2054 | 4.4571 | 4.3808 | 4.7293 | 4.6318 |
Disclaimer
The content provided by Confluence Technologies, Inc. is for general informational purposes only and does not constitute legal, regulatory, financial, investment, or other professional advice. It should not be relied upon as a substitute for specific advice tailored to particular circumstances. Recipients should seek guidance from appropriately qualified professionals before making any decisions based on this content.
Unless otherwise stated, Confluence Technologies, Inc. (or the relevant group entity) owns the copyright and all related intellectual property rights in this material, including but not limited to database rights, trademarks, registered trademarks, service marks, and logos.
No part of this content may be adapted, modified, reproduced, republished, uploaded, posted, broadcast, or transmitted to third parties for commercial purposes without prior written consent.
Authors
About Confluence® Technologies
Confluence is a global leader in enterprise data and software solutions for regulatory, analytics, and investor communications. Our best-of-breed solutions make it easy and fast to create, share, and operationalize mission-critical reporting and actionable insights essential to the investment management industry. Trusted for over 30 years by the largest asset service providers, asset managers, asset owners, and investment consultants worldwide, our global team of regulatory and analytics experts delivers forward-looking innovations and market-leading solutions, adding efficiency, speed, and accuracy to everything we do. Headquartered in Pittsburgh, PA, with 700+ employees across North America, the United Kingdom, Europe, South Africa, and Australia, Confluence services over 1,000 clients in more than 40 countries. For more information, visit www.confluence.com.