

In the first piece in this series, we looked at how a single stock temporarily overwhelmed an index until a reconstitution corrected it. Not every benchmark distortion works that way, and in this second article we look at a related but distinct problem for Large Blend and Large Growth: concentration that doesn’t depend on any one event, because it’s a standing feature of the index itself.
Russell Investments has noted that nearly 70% of the economic profit in the S&P 500 Index is now generated by its top ten companies, a level of concentration that can make an index a harder or easier comparison point depending on whether a manager holds those names at benchmark weight. [Russell Investments, “The Magnificent Seven: Market Concentrations And Complications,” October 2024]. The S&P 500 and Russell 1000 Growth have both become more concentrated in a small number of dominant names, and active performance versus either index moved accordingly through 2025. Peer group benchmarks, built from the positioning of managers facing the same constraints, held a steadier course.
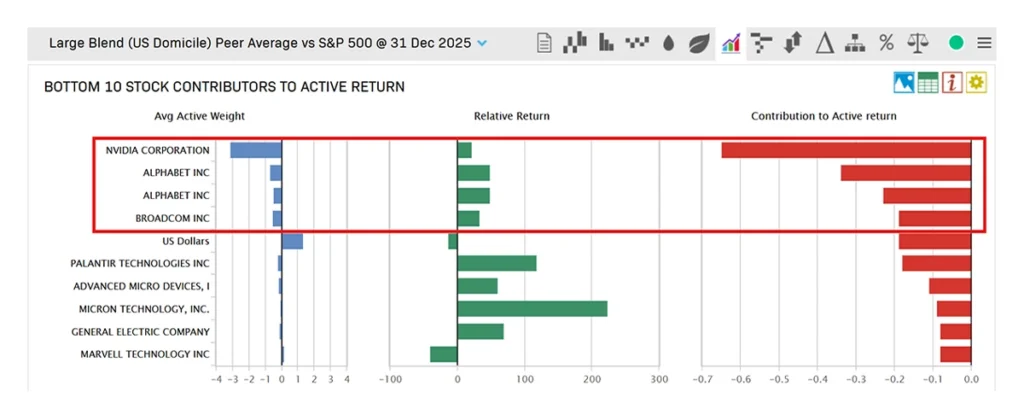
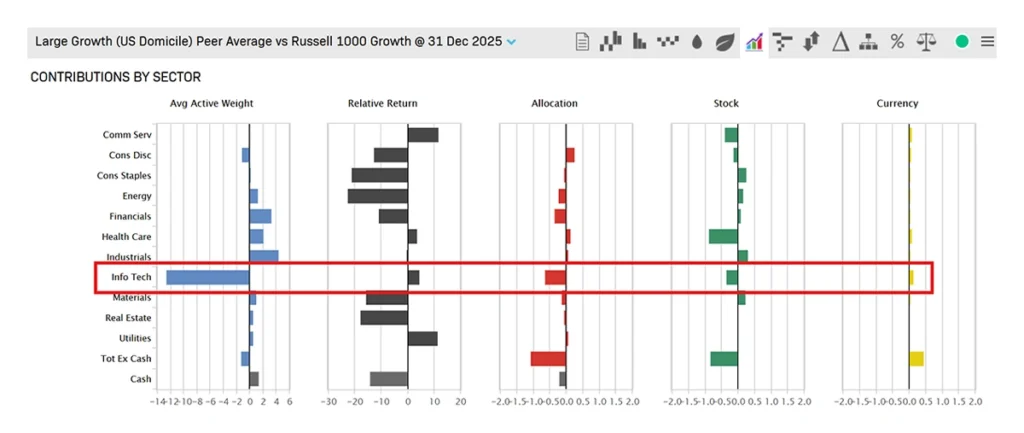
This kind of concentration isn’t fixed and can move in either direction within a single year. Large Growth’s experience in 2025 demonstrates this. In the first half of the year, the Russell 1000 Growth Index underperformed and was a relatively easy comparison point. Around mid-year, that reversed: the index strengthened and became materially harder to beat. A full-year active return number hides this shift. A period-by-period comparison against the peer group reveals it.
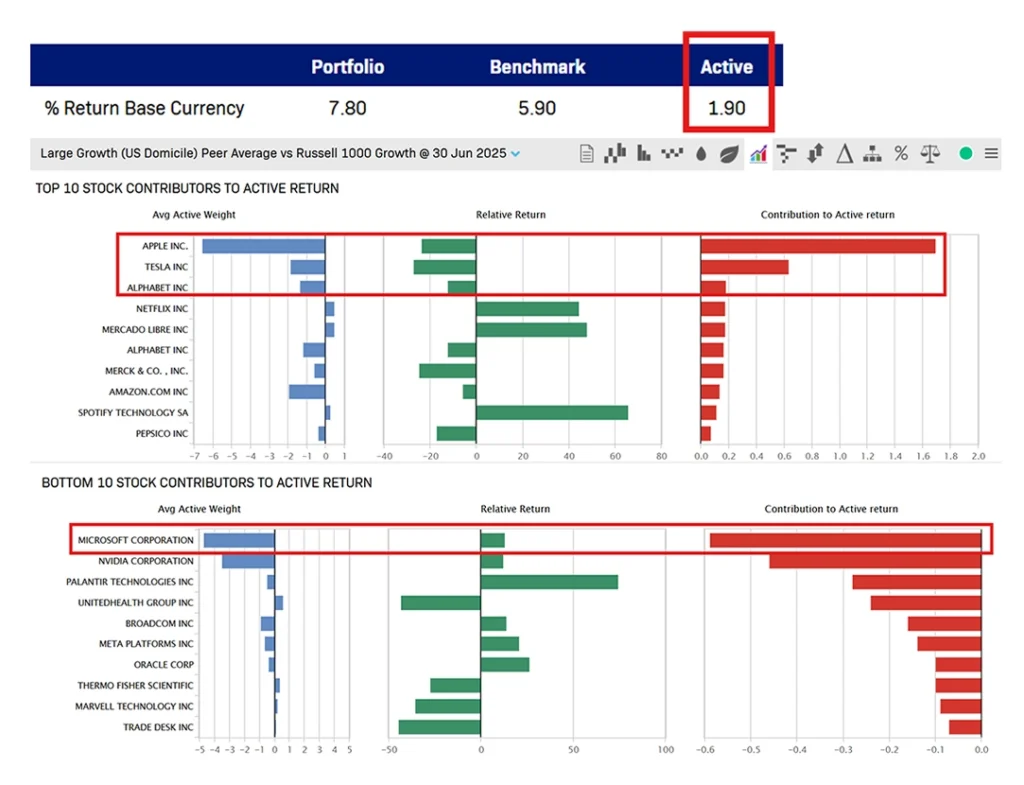
Splitting the year in half makes the mechanism clear. The peer group’s underweights in a handful of Magnificent Seven names, including Apple, Tesla, Alphabet, and Microsoft, illustrate how a small number of companies can drive active returns on their own. In the first half, the peer group benchmark outperformed the Russell 1000 Growth Index, meaning the index was the weaker comparison point and active managers had more room to outperform it.
In the second half, that relationship reversed as several of those same stocks experienced sharp changes in performance, creating a meaningful shift in benchmark returns and an outsized impact on active performance.
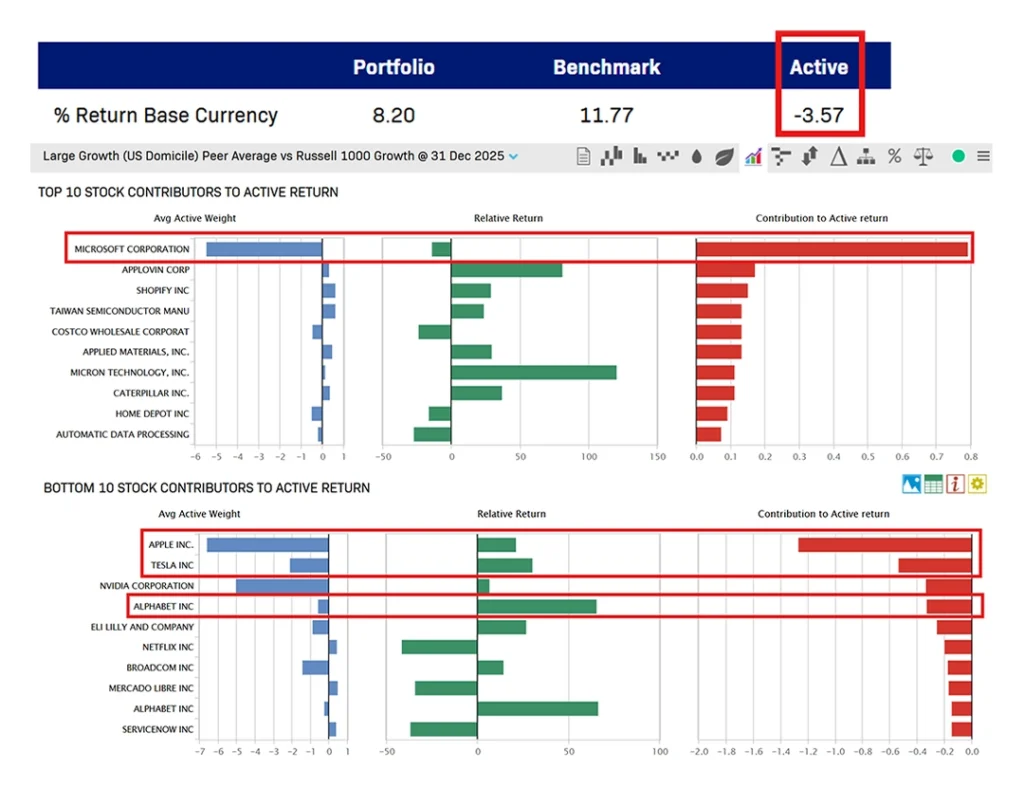
For a selector, the practical implication nature of this is clear. When performance is measured only against a market-cap-weighted index, a manager holding a defensible, style-consistent underweight to a handful of mega-cap names can look volatile or weak for reasons that have nothing to do with the quality of their decisions. The peer group comparison shows whether that underweight was shared across the category or unique to the manager in question, which is precisely the distinction a watchlist or review conversation needs.
What this means for manager selection
The value of a peer group benchmark to a selector is not that it replaces the standard index. It is that it changes the question asked when performance looks weak. Instead of “did this manager beat the benchmark?” the question becomes “did this manager underperform its peers, or did it underperform an index that was, for identifiable reasons, an unusually hard or easy comparison point this period?”
That distinction has practical value in three places.
- In manager review meetings, it gives selectors a concrete, holdings-based explanation for underperformance rather than a general one, which sharpens the conversation with the manager.
- In watchlist and retention decisions, it helps separate a manager-specific problem worth acting on from a category-wide headwind that affected every comparable fund.
- In reporting to an investment committee or client, it gives a selector a defensible, evidence-based answer to why a manager was kept, replaced, or put on watch, grounded in the same holdings data used elsewhere in the diligence process.
None of this argues for abandoning the standard index. It argues for using both lenses together, and for treating a divergence between them as a prompt to look more closely.
Conclusion: peer benchmarks are increasingly essential
For fund selectors and manager selection teams, the conclusion is not that benchmark-relative performance is unimportant. It is that benchmark-relative performance needs context before it can be trusted. The two examples we’ve laid out show why in different ways. Palantir’s rise and removal from the Russell Mid-Cap Growth Index shows how a single reconstitution event can distort a benchmark for months at a time. The standing concentration of mega-cap names in Large Blend and Large Growth presents a different version of the same problem that doesn’t depend on any one event and can reverse direction within a year.
Peer group average benchmarks help selectors ask sharper questions in both cases: whether a manager is alone in struggling, whether peers faced the same benchmark headwind, and whether a performance gap can be explained by stock, sector, or style positioning rather than by decision-making. That makes the due diligence conversation more precise, and easier to defend.
The strongest manager selection processes already combine performance, qualitative assessment, holdings analysis, risk review, and manager judgment. Peer group benchmarks strengthen one of the most heavily weighted of those inputs, performance, by giving it the context concentrated markets increasingly demand.
Data Differences
It is important to note that the data used in this analysis, sourced from the Style Analytics platform, may differ slightly from that of other providers for several reasons. These include:
- Different share classes: Morningstar category returns include all share class types while Style Peer Groups will only include one share class.
- Data lags: Funds can report holdings with a 60-day lag per regulation.
- Data frequency: Per regulation, funds are only required to report holdings quarterly, although some do so monthly.
- Different returns calculation methods: Morningstar is daily transaction based and Style is monthly holdings based.
- Fees: Morningstar will reflect performance net of fees while Style is gross of fees.
The tables below compare Morningstar category returns with Style Analytics peer average benchmark returns across all four major US equity peer groups. In most cases, the measures are within a reasonable range, supporting the use of the Style Analytics data for this analysis.
| 2022 | |||
| Peer Group | Category (MS) | Peer BM (SA) | Difference |
| Small Growth (US Domicile) | -27.77 | -27.64 | -0.13 |
| Mid-Cap Growth (US Domicile) | -27.79 | -25.97 | -1.82 |
| Large Blend (US Domicile) | -16.96 | -15.44 | -1.52 |
| Large Growth (US Domicile) | -29.91 | -27.01 | -2.9 |
| 2023 | |||
| Peer Group | Category (MS) | Peer BM (SA) | Difference |
| Small Growth (US Domicile) | 16.68 | 17.64 | -0.96 |
| Mid-Cap Growth (US Domicile) | 21.37 | 23.6 | -2.23 |
| Large Blend (US Domicile) | 22.32 | 21.66 | 0.66 |
| Large Growth (US Domicile) | 36.74 | 35.68 | 1.06 |
| 2024 | |||
| Peer Group | Category (MS) | Peer BM (SA) | Difference |
| Small Growth (US Domicile) | 14.98 | 14.53 | 0.45 |
| Mid-Cap Growth (US Domicile) | 16.47 | 16.63 | -0.16 |
| Large Blend (US Domicile) | 21.45 | 19.75 | 1.7 |
| Large Growth (US Domicile) | 28.96 | 26.62 | 2.34 |
| 2025 | |||
| Peer Group | Category (MS) | Peer BM (SA) | Difference |
| Small Growth (US Domicile) | 8.06 | 7.78 | 0.28 |
| Mid-Cap Growth (US Domicile) | 7.67 | 9.24 | -1.57 |
| Large Blend (US Domicile) | 15.54 | 16.06 | -0.52 |
| Large Growth (US Domicile) | 16.1 | 16.64 | -0.54 |
Each major peer group has a peer group average benchmark, calculated by Style Analytics, that requires no additional license and is available to all Peer Insights users with Morningstar. One challenge in constructing an average benchmark is that holdings data is not released as frequently or consistently as performance information. Some funds release holdings monthly, while others disclose holdings quarterly. This can create spikes in the number of funds represented in a peer group during certain months of the year.
Our approach uses the latest available holdings for each fund in the peer group from the prior six months. We then construct an equally weighted portfolio from each fund and adjust the holdings using the return of each security. This is intended to create a closer approximation of the portfolio at the required date while producing a more consistent peer group average and smoothing the number of funds used each month.
Disclaimer
The content provided by Confluence Technologies, Inc. is for general informational purposes only and does not constitute legal, regulatory, financial, investment, or other professional advice. It should not be relied upon as a substitute for specific advice tailored to particular circumstances. Recipients should seek guidance from appropriately qualified professionals before making any decisions based on this content.
Unless otherwise stated, Confluence Technologies, Inc. (or the relevant group entity) owns the copyright and all related intellectual property rights in this material, including but not limited to database rights, trademarks, registered trademarks, service marks, and logos.
No part of this content may be adapted, modified, reproduced, republished, uploaded, posted, broadcast, or transmitted to third parties for commercial purposes without prior written consent.
Author

About Confluence® Technologies
Confluence is a leading provider of specialist regulatory, analytics, and investor communication solutions for asset managers, asset servicers, investment consultants, and asset owners. Across performance, risk and peer analytics, regulatory filings and compliance monitoring, and shareholder reporting and document production, firms depend on Confluence for output they trust. We deliver this through deep domain expertise and purpose-built products developed over decades of research and engineering.
Confluence solutions are powered by Confluence POINT, AI-enabled automation that runs within and alongside Confluence’s trusted solutions. POINT optimizes inefficient workflows, delivering a meaningful impact on outcomes without requiring significant operational change.
Headquartered in Pittsburgh, PA, with 750+ employees in 15 offices across the United Kingdom, Europe, North America, South Africa, and Australia, Confluence services over 1,000 clients in more than 40 countries. For more information, visit www.confluence.com.
Confluence Media Contact:
Jon Schubin
Cognito