


Q2 2026 Plan Universe Allocation & Return Analysis
Executive summary
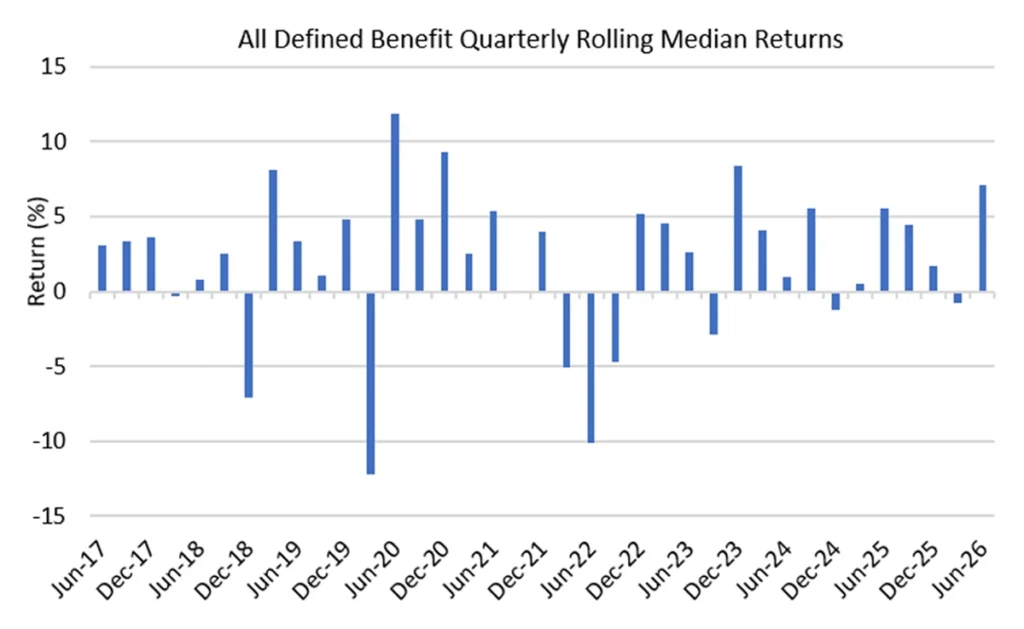
The Q2 2026 Confluence Plan Universe Report – the industry’s most granular analytics tool for plan sponsors with data sourced directly from over 4,000 institutions – reported its best quarter performance for defined benefit plans since Q4 2023. The median defined benefit plan returned 7.06% for the quarter and 6.17% year to date.
De-escalation in the Middle East, continued enthusiasm for AI and better-than-expected corporate earnings led to a broad-based recovery for global equity markets in the second quarter with the MSCI ACWI Index returning 15.14%. Within fixed income, the Bloomberg U.S. Aggregate Index returned 0.67% for the quarter, while the Bloomberg U.S. Long Treasury Index returned 0.85%.
Highlights
- All defined benefit plans posted a median return of 6.17% year-to-date period ending June, underperforming a traditional 60/40 benchmark return of 7.21%. (60% MSCI ACWI Index/40% Bloomberg Barclays U.S. Aggregate Index).
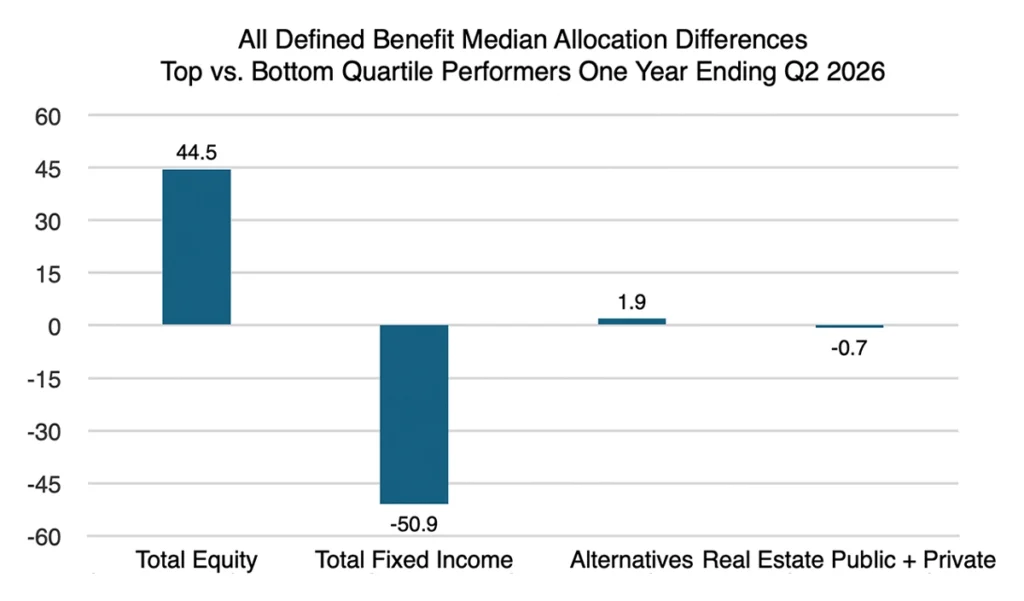
- For the year to date, the median allocation to equity for top quartile performing plans was 61.3%, compared to 16.9% for the bottom quartile performers.
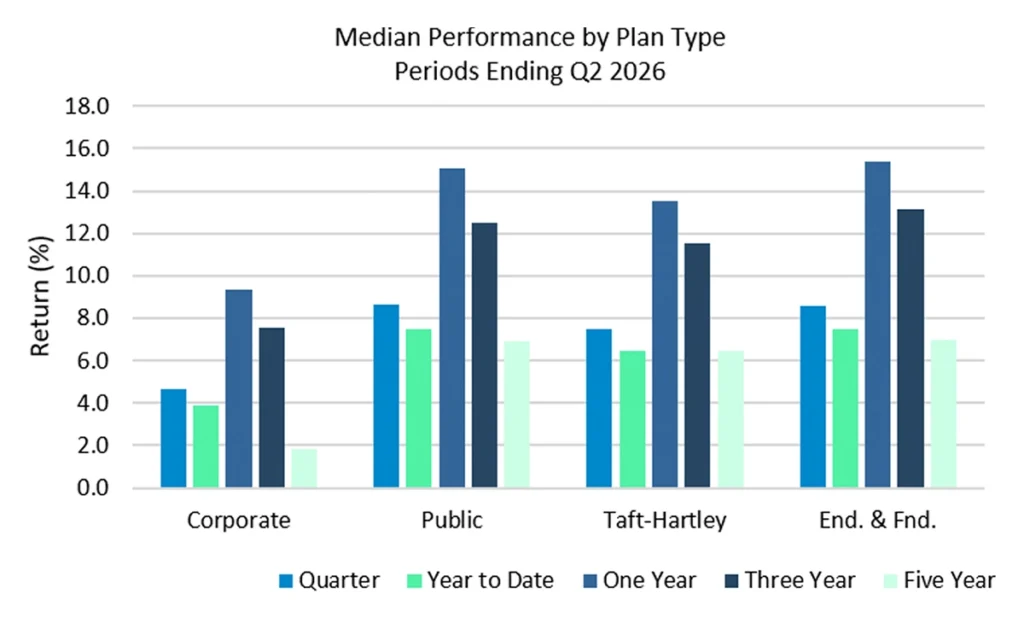
- Public plans delivered the strongest performance for the quarter and year to date, while Endowments & Foundations delivered the strongest performance over the one-, three-& five-year periods driven by their higher allocations to equity and alternative markets.
- Corporate plans, driven by their comparatively high fixed income allocations, delivered the weakest performance by plan type for the quarter, year to date, one-, three-, and five-year periods.
Plan performance over time
For the quarter, the Confluence All Defined Benefit Plan Sponsor Universe posted a median return of 7.06%. For the year to date ending June, DB plans posted a median return of 6.17%, underperforming a traditional 60/40 benchmark return of 7.21%. (60% MSCI ACWI Index/40% Bloomberg Barclays U.S. Aggregate Index).
Source: Confluence
For the year to date, plans with a return greater than 7.67% were top quartile performers while plans returning less than 3.64% fell in the bottom quartile. The median allocation to equity for top quartile performing plans was 61.3%, compared to 16.9% for the bottom quartile. Conversely, the bottom quartile performing plans had a median allocation of 77.6% to fixed income, 50.9% higher than the top quartile allocation of 26.7%.
Source: Confluence
Historical plan comparison
Public plans delivered the strongest performance for the quarter and year to date ending June, with median returns of 8.67% and 7.5%, respectively. Corporate plans, which have significantly higher exposures to fixed income compared to other plan types, delivered the weakest performance for all time periods displayed.
Source: Confluence
Plan allocation analysis
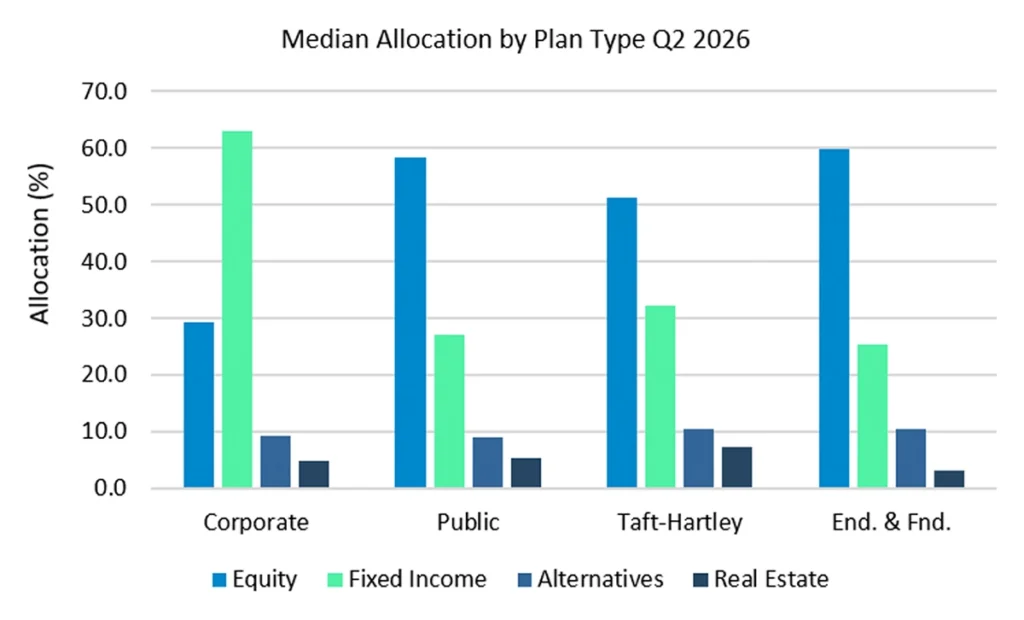
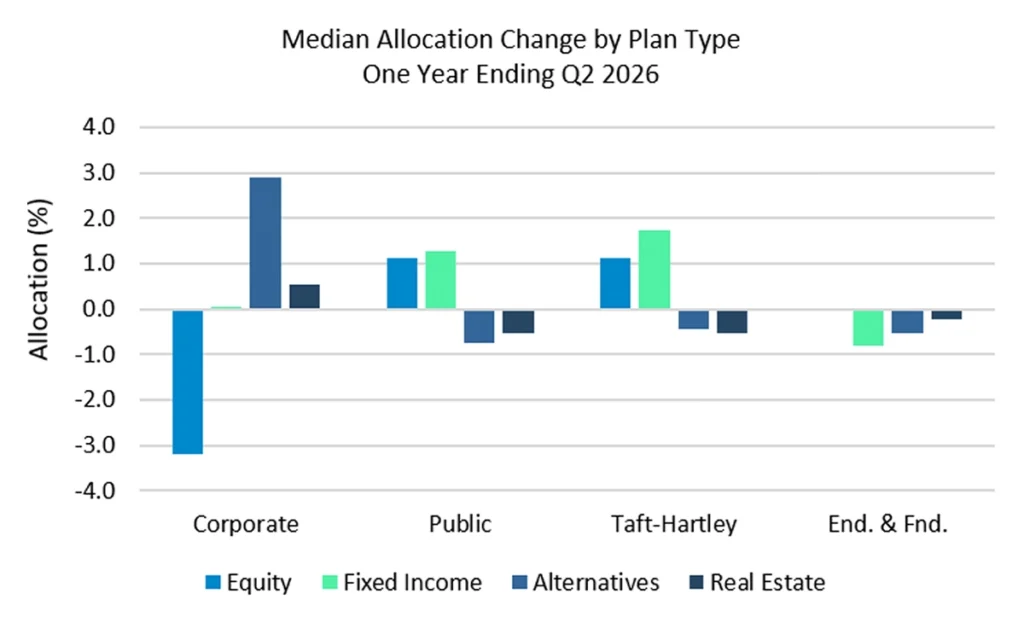
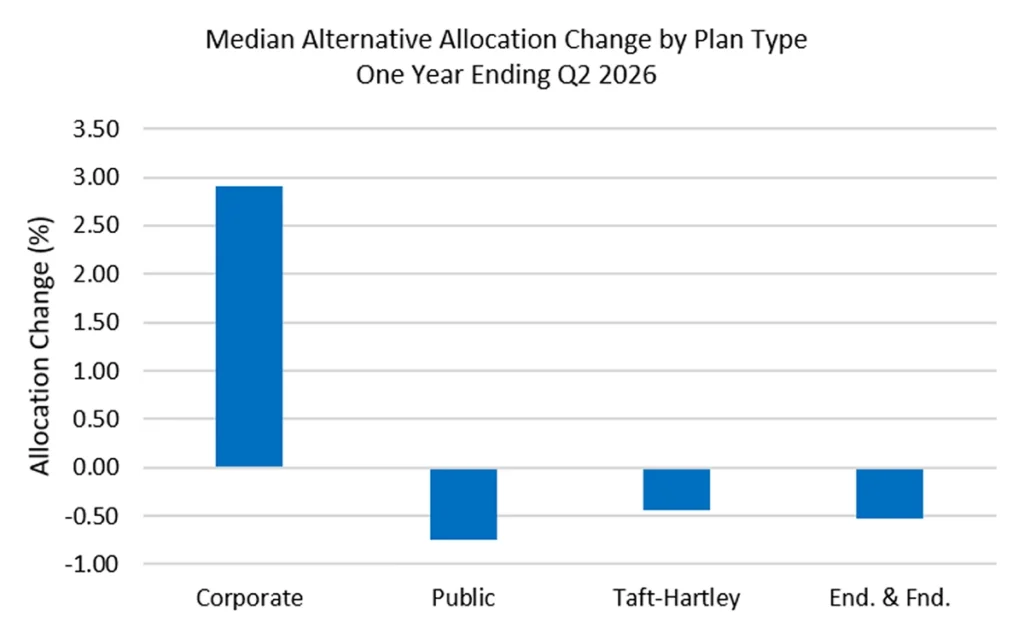
Despite some shifts in allocations, corporate plans maintain the largest allocation to fixed income at 62.9%. All plan types other than endowments & foundations fixed income allocations increased over the last year. The median allocations to equity, the best-performing asset class, increased by 1% for Public and Taft Hartley plans, while corporate plans pulled back 3%. Allocations to alternatives and real estate were down for all plan types other than corporates.
Source: Confluence
Source: Confluence
U.S. equity performance
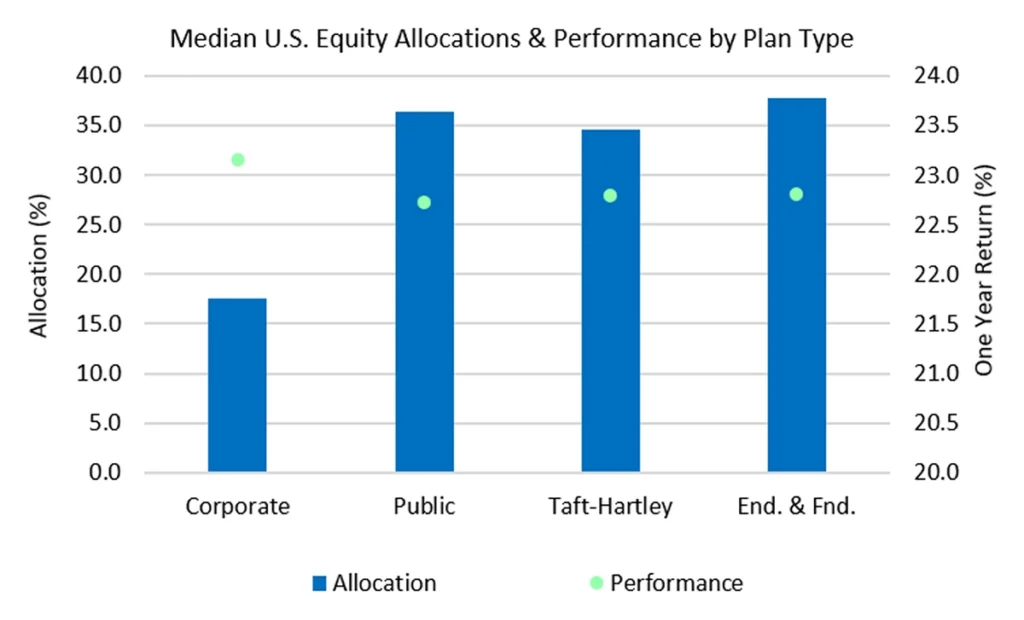
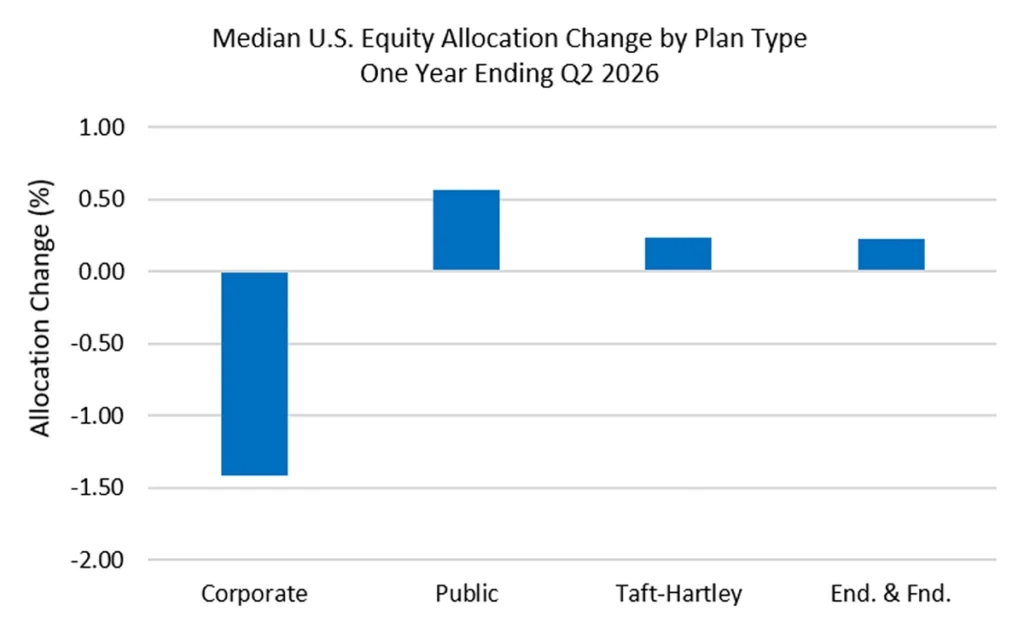
Although U.S. public equity markets sold off during the first quarter, markets rebounded with the Russell 1000 Index returning 15% in the second quarter, the best quarterly performance since Q2 2020. For the year ending June, the Russell 1000 returned 22.01%. Comparatively, the median U.S. equity return for all defined benefit plans was 22.81%. Corporate plans, the only plan type to see a decrease in exposure to U.S. equity, continue to be underweight with a median allocation of 17.6%, nearly half of the allocation compared to other plan types.
Source: Confluence
Source: Confluence
U.S. fixed income performance
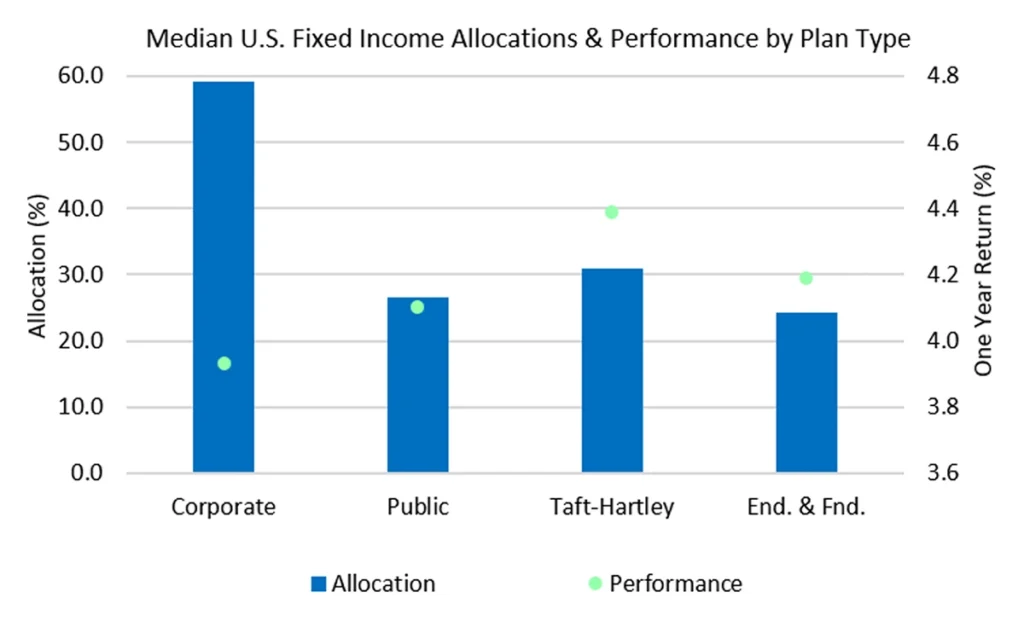
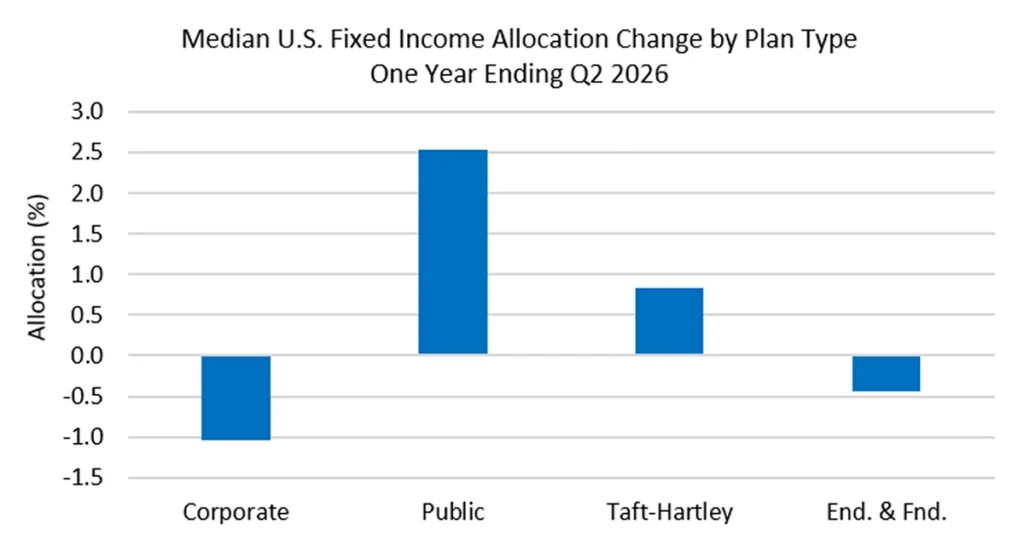
The median return for U.S. Fixed Income across all DB plans was 4.18% for the year ending June, compared to 3.79% for the Bloomberg Barclays U.S. Aggregate Index. Despite a decrease of 1% over the last year, corporate plans maintain the highest allocation to U.S. Fixed Income at 59.2%.
Source: Confluence
Source: Confluence
Alternatives performance
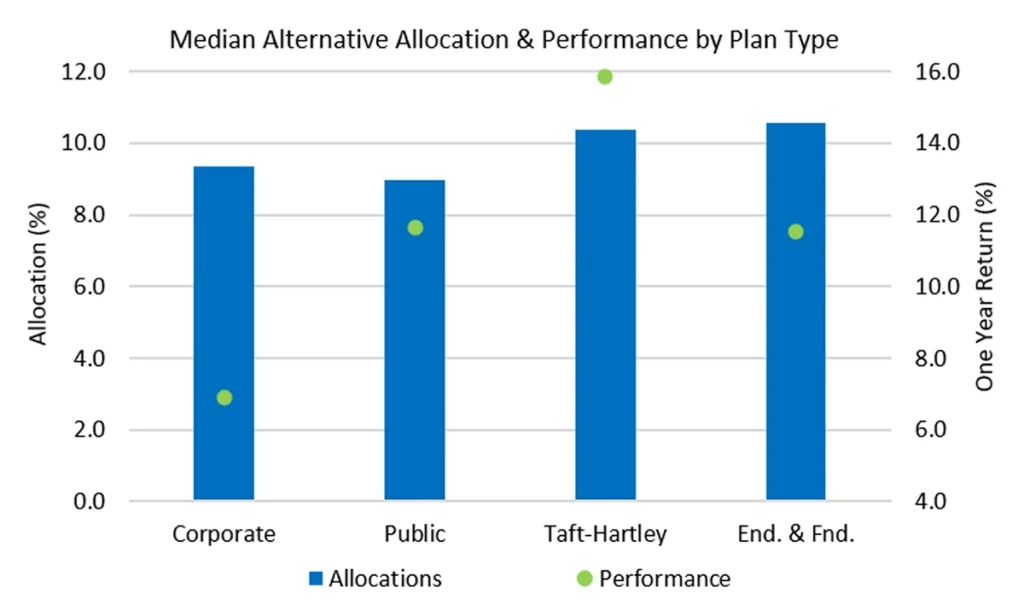
Corporate plans median allocation to alternatives increased by 2.9% in the last year, bringing their 9.37% allocation closer to the median for all DB plans of 9.74%. Endowments & Foundations continue to have the highest median allocation to alternatives at 10.6%.
Source: Confluence
Source: Confluence
Confluence Plan Universe
Confluence Plan Universe is the industry’s most granular analytics tool for plan sponsors, including standard and custom peer group comparisons of performance, risk, and asset allocations by plan type and size. The data is sourced directly from over 4,000 institutions using our reporting and analytics solutions, including investment consultants, advisors, and asset owners. Plan Universe is updated quarterly and typically available on or near the following schedule: preliminary data available on the 14th business day after quarter end, a second cut on the 21st business day, and final cut on the 29th business day. The data includes 20+ years’ history on:
- Trust Funds, Corporates, Public Plans, Taft-Hartley, Endowments & Foundations, High Net Worth, Health & Welfare, and custom groups.
- Asset Allocations broken into equity (US, global, global ex-US), fixed income (US, global, and global ex-US), alternatives, real estate (public and private), multi-asset, and cash. Emerging Markets allocations are available for equities and debt securities.
- Net and gross performance displayed by quartile with full percentiles via download.
- All information is aggregated by Plan Size.
Disclaimer
The content provided by Confluence Technologies, Inc. is for general informational purposes only and does not constitute legal, regulatory, financial, investment, or other professional advice. It should not be relied upon as a substitute for specific advice tailored to particular circumstances. Recipients should seek guidance from appropriately qualified professionals before making any decisions based on this content.
Unless otherwise stated, Confluence Technologies, Inc. (or the relevant group entity) owns the copyright and all related intellectual property rights in this material, including but not limited to database rights, trademarks, registered trademarks, service marks, and logos.
No part of this content may be adapted, modified, reproduced, republished, uploaded, posted, broadcast, or transmitted to third parties for commercial purposes without prior written consent.
Author

About Confluence® Technologies
Confluence is a global leader in enterprise data and software solutions for regulatory, analytics, and investor communications. Our best-of-breed solutions make it easy and fast to create, share, and operationalize mission-critical reporting and actionable insights essential to the investment management industry. Trusted for over 30 years by the largest asset service providers, asset managers, asset owners, and investment consultants worldwide, our global team of regulatory and analytics experts delivers forward-looking innovations and market-leading solutions, adding efficiency, speed, and accuracy to everything we do. Headquartered in Pittsburgh, PA, with 700+ employees across North America, the United Kingdom, Europe, South Africa, and Australia, Confluence services over 1,000 clients in more than 40 countries. For more information, visit www.confluence.com.