
Growth equity performance
On December 15th, the Federal Reserve delivered a significant announcement, suggesting possible federal funds rate cuts in 2024. This revelation triggered a ripple effect across global equities, leading to an “everything” rally near the end of the year as markets priced in anticipated rate reductions as early as Q1 2024. While the Federal Reserve has not yet confirmed the timing and magnitude of the rate cuts, the question looms:
“To what extent will Growth equity outperform Value equity in the US when interest rates fall?” and- “What other factors outperform in this market environment?”
We examined historical stock returns in the US spanning from 1982 to 2023, evaluating the impact of sudden interest rate cuts on equity performance. Our findings reveal:
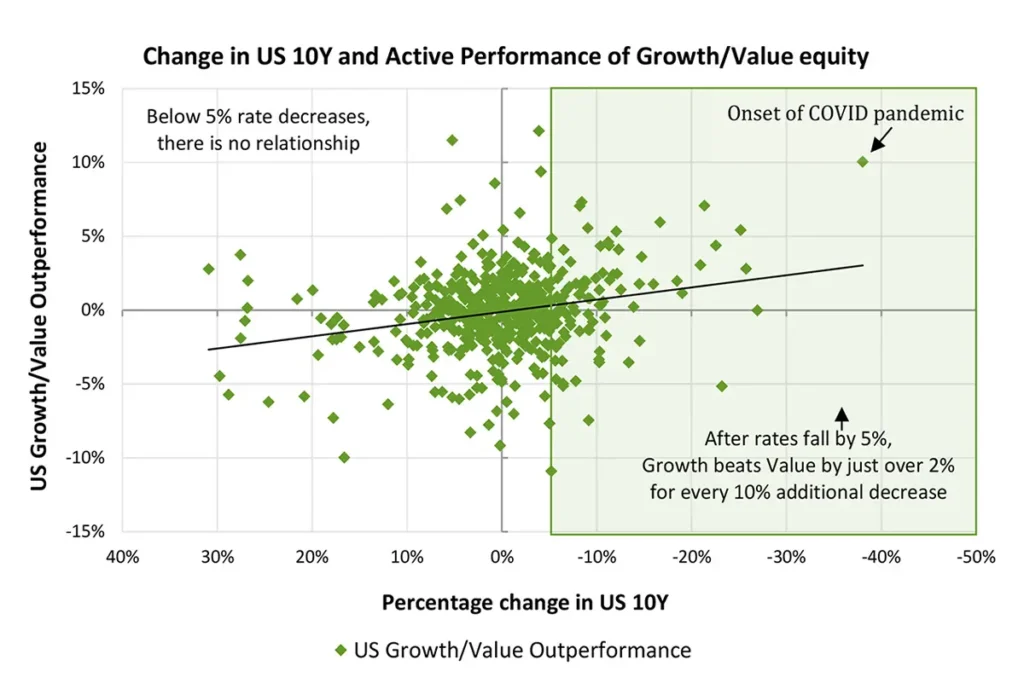
- Growth equity outperforms Value equity, but this is contingent on rapidity of the interest rate decline. A reduction beyond 5% is necessary to influence Growth stocks in the US market.
- In the US, for every 10% decrease in rates after 5%, Growth equity outperforms Value equity by 226 basis points.
- If the 10-year rate decreases by 15%, Growth equity outperforms Value equity by approximately 2.2%.
For instance, a one-month decline from 1% to 0.85% could reasonably result in Growth equity outperforming Value equity in the US by over 200bps, as illustrated in Figure 1. This aligns with our findings in the “Exploring interest Rates to Value vs. Growth Investment Strategies” report, emphasizing the pivotal role of the rate change magnitude.
Source: Federal Reserve Economic Data (FRED) and Style Analytics Markets Analyzer (2024)
Source: Federal Reserve Economic Data (FRED) and Style Analytics Markets Analyzer (2024)
Broader market trends
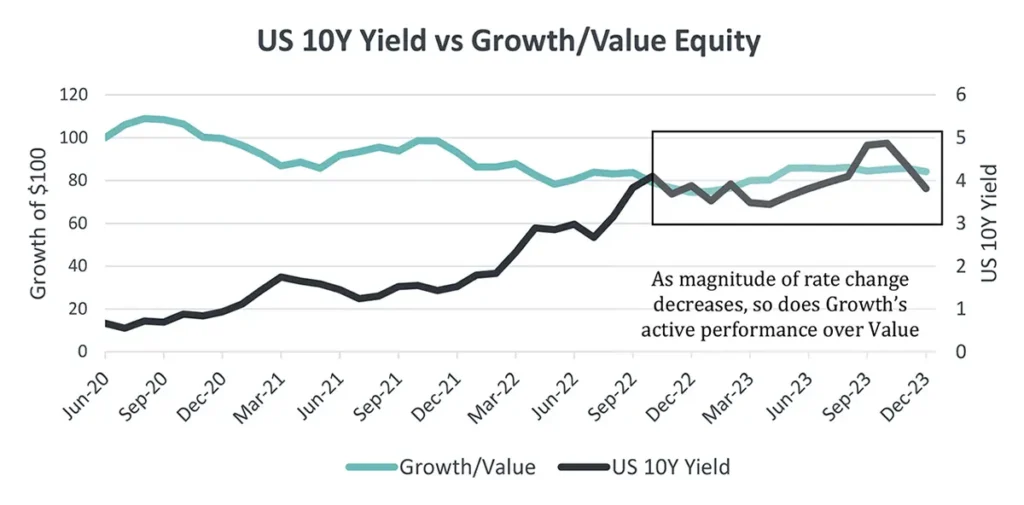
While Growth may slightly outperform Value during rate decreases, it is crucial to explore broader market trends beyond Growth vs. Value.
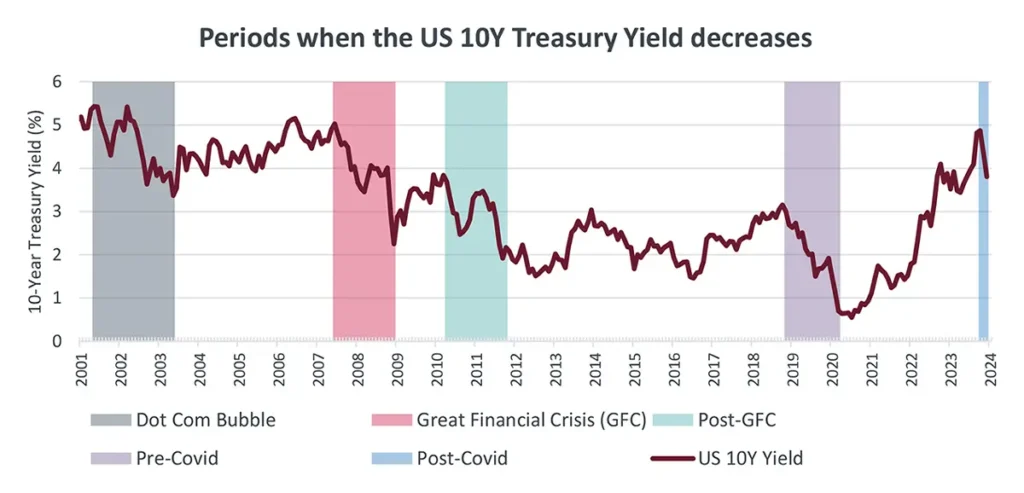
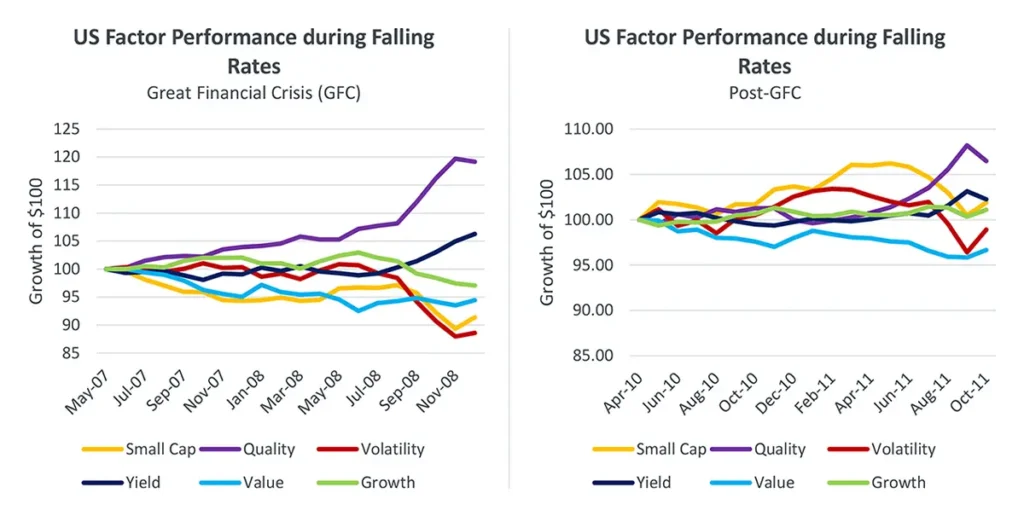
To gain insights on the factor trend during these times, we identified four significant rate-decreasing periods in addition to the post-Covid period today:
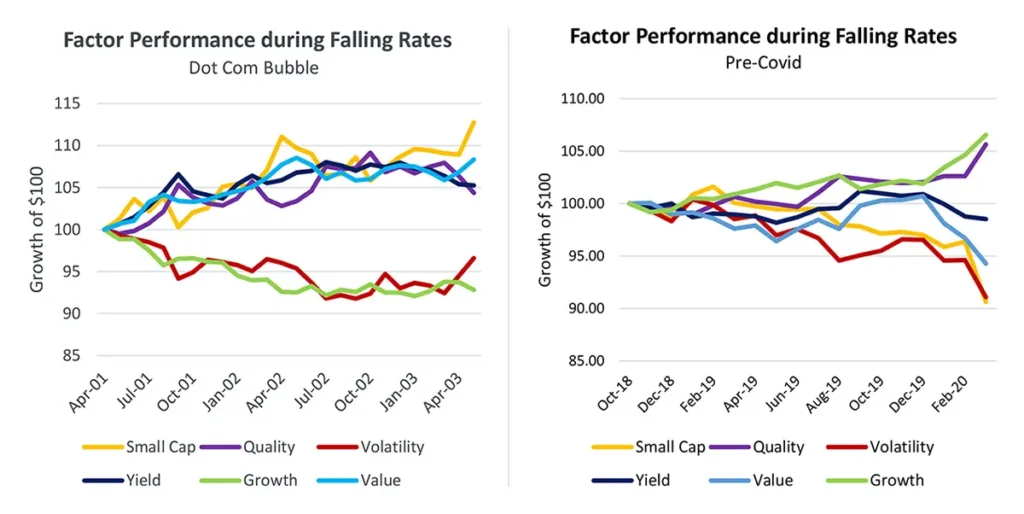
- Dot Com Bubble (April 2001 – May 2003)
- Great Financial Crisis (GFC) (May 2007 – December 2008)
- Post-GFC (April 2010 – October 2011)
- Pre-Covid (October 2018 – March 2020)
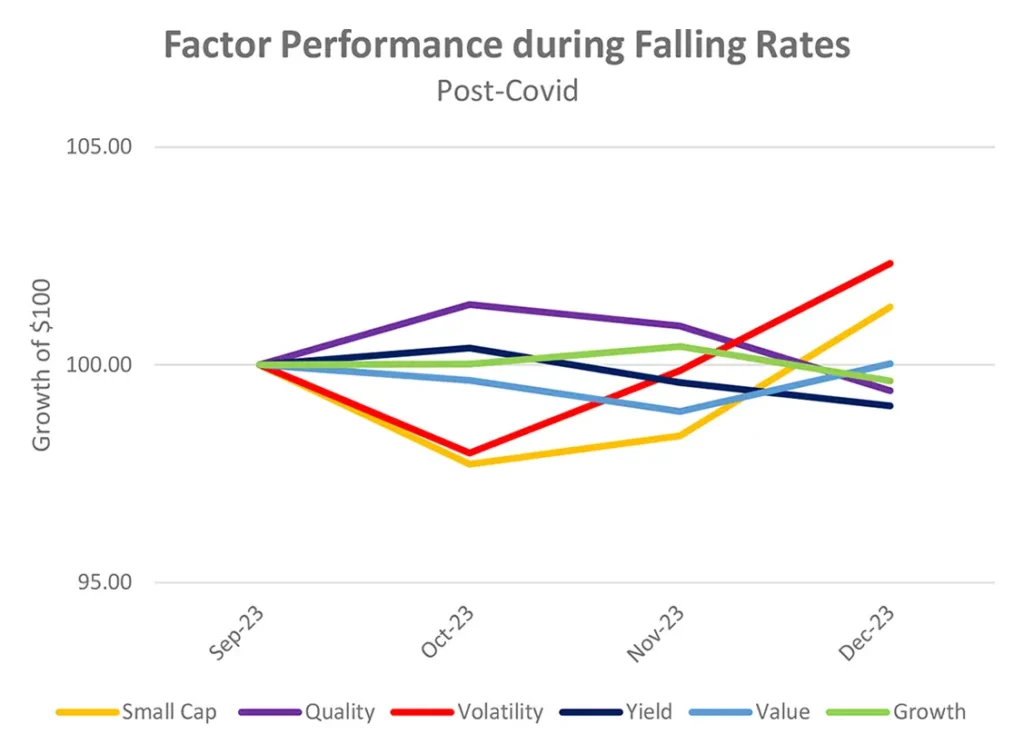
- Post-Covid (September 2023 – December 2023)
Source: Federal Reserve Economic Data (FRED) (2024)
Utilizing Style Analytics’ Markets Analyzer, we constructed factor portfolios based on the top half of stocks in the market sorted by subfactors such as book-to-price, free cash flow yield, and sales-to-price metrics for Value, and earnings growth, sales growth, and forecasted earnings growth for Growth, etc. Monthly relative returns to the US market were averaged to determine the factor portfolio’s monthly relative returns. The geometric average growth rate of these returns for each period, combined with a weighted average return considering the duration of each period, enabled us to analyze the relative performance of each factor across all periods.
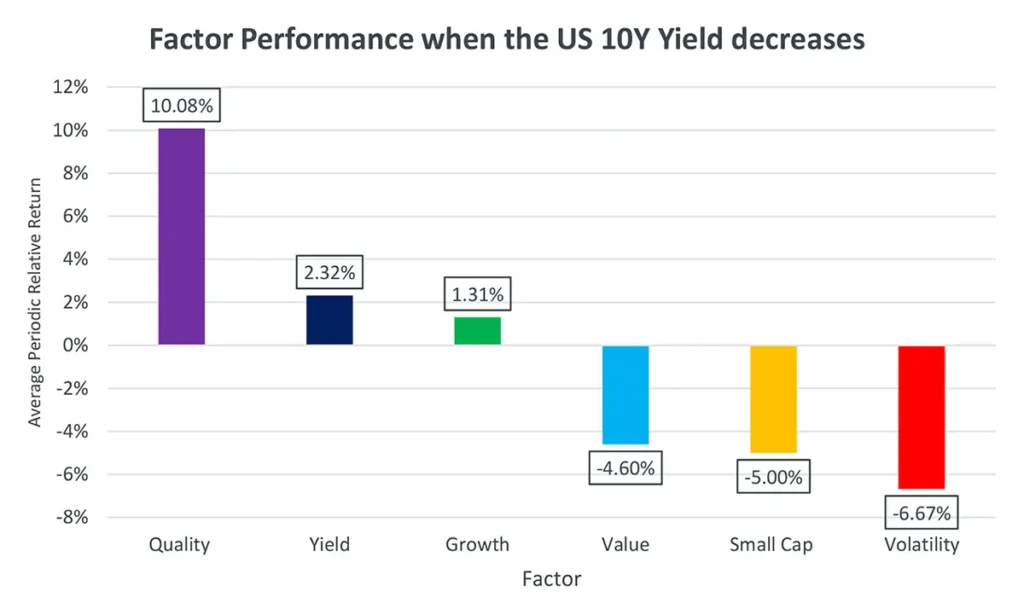
During the Dot Com Bubble burst, Value equity exhibited unparalleled dominance, outperforming the market by nearly 13% despite underperforming in other periods. Excluding this outlier period yields the results depicted in Figure 4 below:
Source: Style Analytics Markets Analyzer (2024)
Despite a clear preference for Quality and Yield stocks, each period performs differently. The Dot Com Bubble strongly favored Value equity, the Great Financial Crisis boosted Quality and Yield stocks, the leadup to the COVID pandemic kicked off the Growth boom in 2020, and the recent Q4 2023 “Post-Covid” period is witnessing Volatility outperform for the first time.
Source: Style Analytics Markets Analyzer (2024)
Source: Style Analytics Markets Analyzer (2024)
Summary
In summary, periods of decreasing 10-year rates often coincide with economic downturns, as the Federal Reserve adopts dovish monetary policy. While Growth may outperform Value in these scenarios, the flight to Quality and Yield is much more pronounced. The recent rate decrease in Q4 2023 differs from the past, as Volatility has unexpectedly outperformed, suggesting a potential shift in the flight to Quality. Historically, Volatility has underperformed so this period of outperformance suggests that we may be ahead of the flight to safer stocks this time around.
Source: Style Analytics Markets Analyzer (2024)
In fact, the current factor trend, preferring Volatility and Small Cap, resembles that of the post-Great Financial Crisis era in 2010-2011, where the Federal Reserve transitioned out of the aftermath of the 2008 recession. In late 2010 we observed Small Cap and Volatility equities outperforming before giving way back to Quality and Yield in the late summer of 2011, when the Federal Reserve began its controversial “Twist” maturity extension program to extend maturities of its Treasury securities to further reduce interest rates.
We seem to be gradually returning to “normalcy” from the post-Covid era, with inflation stabilizing around 3%. Although the federal funds rate is at 5%, the recent Volatility outperformance resembles a slow shift towards normalcy rather than the risk of further recession, contrasting with the scenarios during the Dot Com Bubble burst and the Great Financial Crisis.
Disclaimer
The content provided by Confluence Technologies, Inc. is for general informational purposes only and does not constitute legal, regulatory, financial, investment, or other professional advice. It should not be relied upon as a substitute for specific advice tailored to particular circumstances. Recipients should seek guidance from appropriately qualified professionals before making any decisions based on this content.
Unless otherwise stated, Confluence Technologies, Inc. (or the relevant group entity) owns the copyright and all related intellectual property rights in this material, including but not limited to database rights, trademarks, registered trademarks, service marks, and logos.
No part of this content may be adapted, modified, reproduced, republished, uploaded, posted, broadcast, or transmitted to third parties for commercial purposes without prior written consent.
About Confluence® Technologies
Confluence is a global leader in enterprise data and software solutions for regulatory, analytics, and investor communications. Our best-of-breed solutions make it easy and fast to create, share, and operationalize mission-critical reporting and actionable insights essential to the investment management industry. Trusted for over 30 years by the largest asset service providers, asset managers, asset owners, and investment consultants worldwide, our global team of regulatory and analytics experts delivers forward-looking innovations and market-leading solutions, adding efficiency, speed, and accuracy to everything we do. Headquartered in Pittsburgh, PA, with 700+ employees across North America, the United Kingdom, Europe, South Africa, and Australia, Confluence services over 1,000 clients in more than 40 countries. For more information, visit www.confluence.com.