
Exploring the relationship of interest rates to value vs growth investment strategies
After the economic turmoil caused by the COVID-19 pandemic, developed economies faced inflation rates reminiscent of the early 1980s. With the United States and the United Kingdom embarking on an unprecedented cycle of interest rate hikes to counter inflation, investors were left wondering about the potential impact on equity markets. Specifically, the question was whether this rapid rise in interest rates would favor either Value or Growth equities and to what extent. In July 2021, we analyzed historical stock returns from the 1980s to 2021 in both regions to understand how equity performance was affected when interest rates surged aggressively. Here are the key findings:
- If interest rates increased rapidly, Value stocks tended to outperform Growth stocks.
- In the US, Value stocks would outperform if long-term rates climbed by 5% in a given month, and in the UK, this threshold was over 20%.
- However, when rates didn’t reach these thresholds, no clear winner emerged.
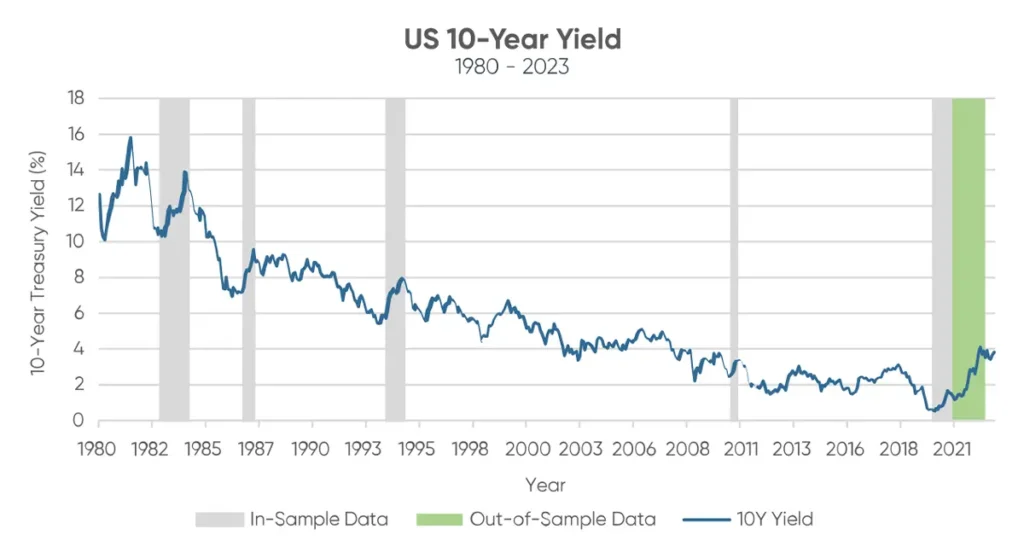
Source: Federal Reserve Economic Data (FRED) (https://fred.stlouisfed.org/series/DGS10)
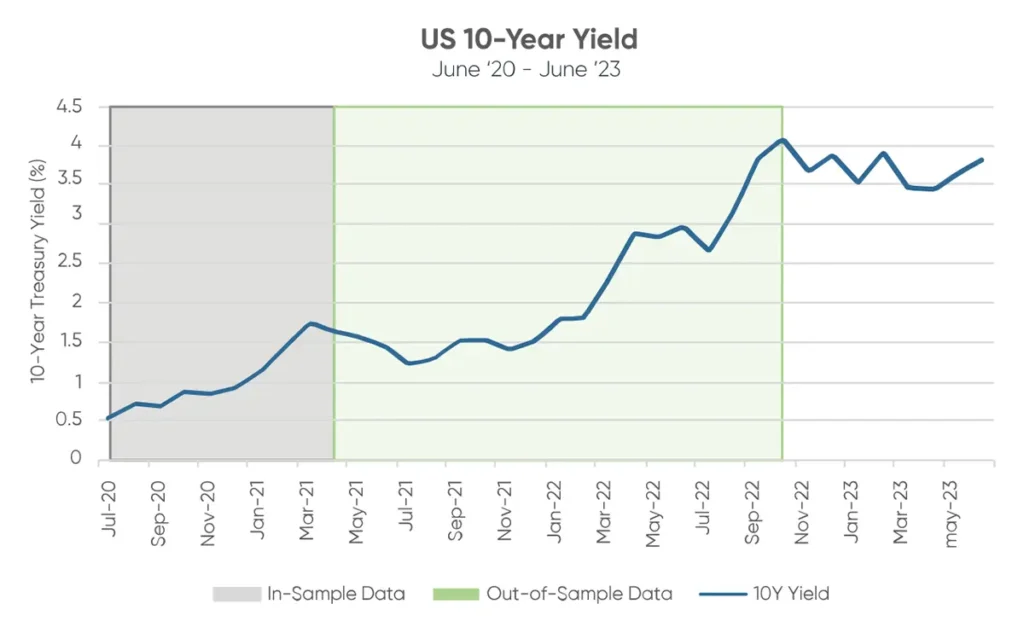
Source: Federal Reserve Economic Data (FRED) (https://fred.stlouisfed.org/series/DGS10)
In the United States, whenever the 10-year treasury rate increased by 10% (e.g., from 1.00% to 1.10%), we could anticipate Value stocks outperforming Growth stocks by approximately 100 basis points (bps). In the UK, a 100bps Value outperformance over Growth could only be expected if rates increased by at least 20% on a monthly basis.
Since our initial analysis, the 10-year treasury yield has continued its historic ascent. The question now is whether this relationship with long-term rates remained consistent during the Federal Reserve’s aggressive rate hike cycle in 2022.
Between the trough and peak of the 10-year yield, spanning from June 2020 to October 2022, Value significantly outperformed Growth. However, this analysis only included data up to April 2021. To understand the situation in 2023, we divided the rate-rise period into in-sample (from June ’21 to April ’21), out-of-sample (April ’21-October ’22), and post-peak (October ’22 to June ’23) periods.
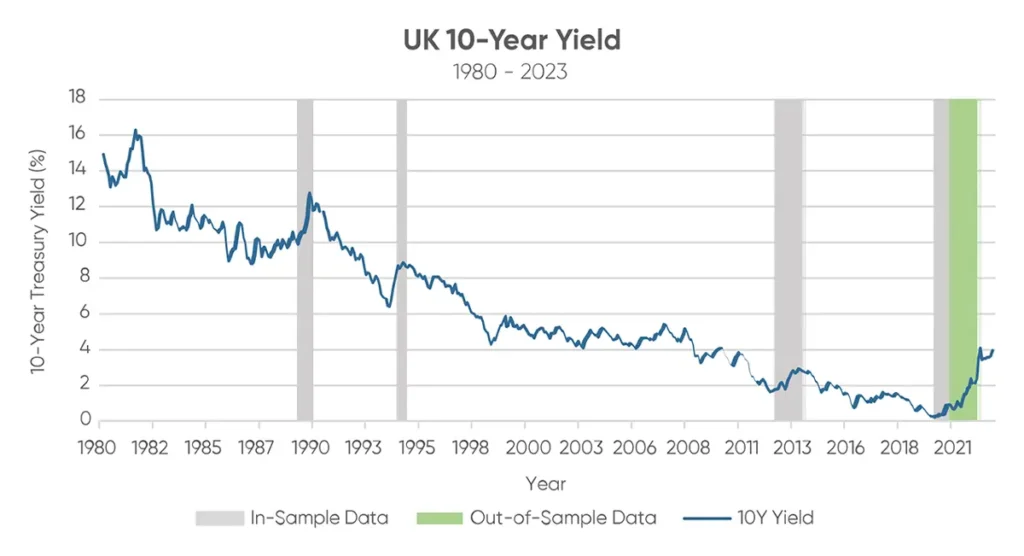
Source: Federal Reserve Economic Data (FRED) (https://fred.stlouisfed.org/series/IRLTLT01GBM156N)
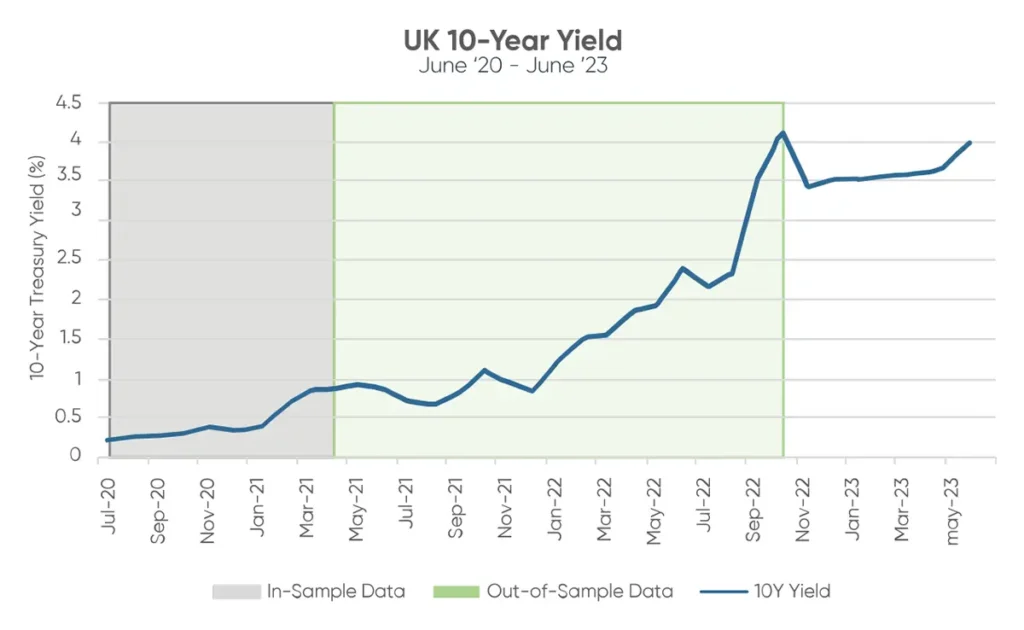
Source: Federal Reserve Economic Data (FRED) (https://fred.stlouisfed.org/series/IRLTLT01GBM156N)
Throughout the entire duration of the recent rate hike cycle, spanning from March ’22 to October ’22, the established relationship held firm: Value stocks continued to outperform growth as the 10-year treasury yield ascended to nearly 4%. Importantly, this relationship in the US exhibited roughly twice the sensitivity observed in the UK.
Specifically, our findings indicate that:
- In the US, Value stocks outperform Growth stocks by 113bps if the monthly rate increase exceeded 10%.
- In the UK, Value stocks outperform Growth stocks by 134bps if the monthly rate increase exceeded 20%.
Interestingly, in the UK, Value outperformed to a greater extent than initially anticipated. We expected a 100bps outperformance for every 20% increase, but the actual outcome was 34bps higher than in our initial analysis.”
To assess whether the slope of this relationship remained consistent in the out-of-sample period, (excluding rate hikes prior to October ’22), we conducted a separate regression analysis. The results closely resembled those observed in the total period analysis, with minor deviations due to the smaller sample size of 18 observations. A larger data set is expected to align more closely with our total period findings.
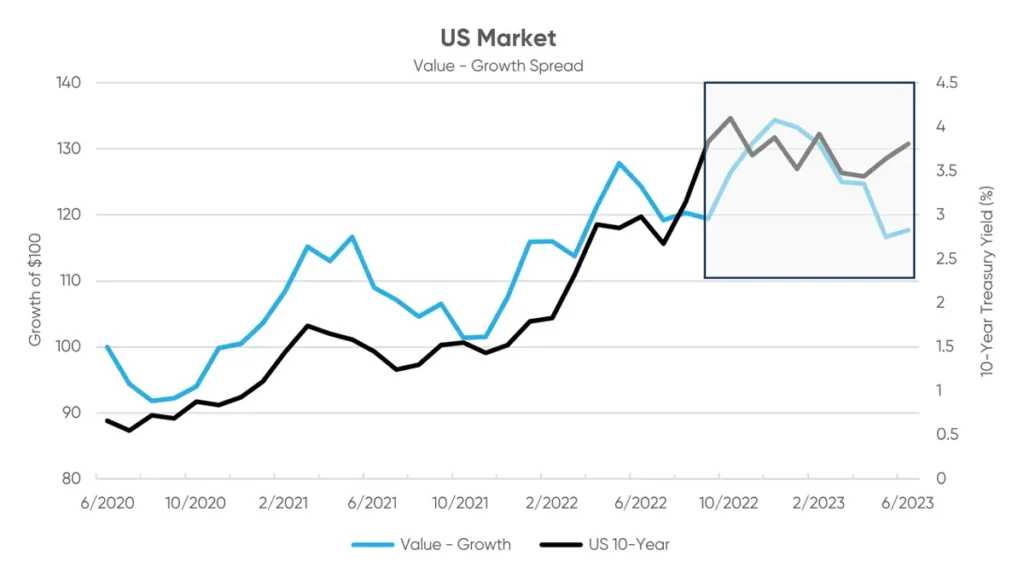
The trend is illustrated in the “US Market” chart below, where the Value-Growth spread consistently favored Value stocks throughout the total period but showed signs of weakening as the US 10-year yield fluctuated between 3.5% and 4% as of October 2022. In 2023, the decrease in the Value-Growth spread highlighted Growth stock outperformance in the US as several major technology companies recaptured valuations lost in 2022.
Source: Federal Reserve Economic Data (FRED) (https://fred.stlouisfed.org/series/IRLTLT01GBM156N) and Style Analytics Markets Analyzer
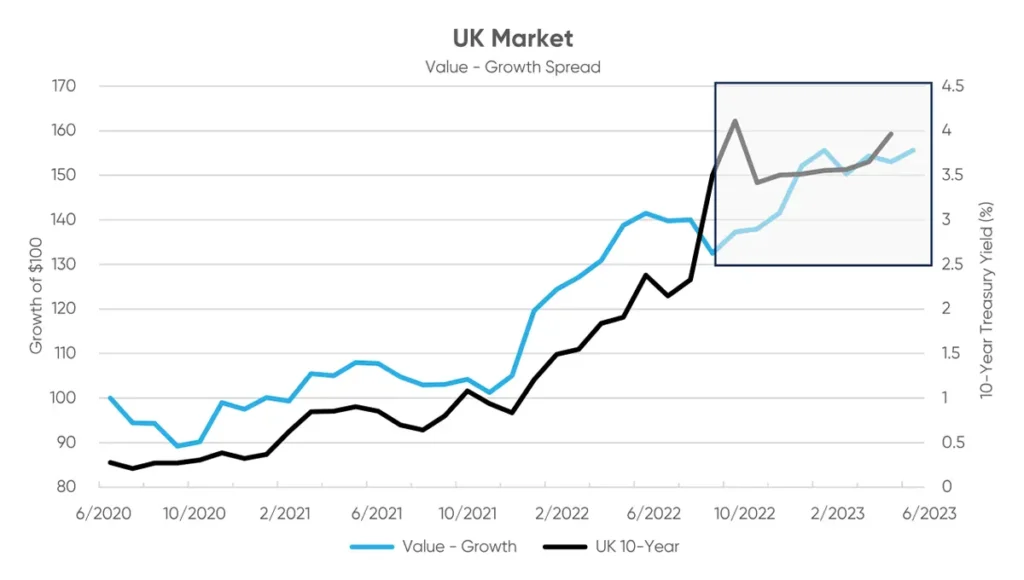
A similar pattern emerged in the UK market, where rates initially decreased in September 2022, only to rise to 4% by June 2023. The Value-Growth spread continued to favor Value stocks as rates climbed, though to a lesser extent as the rate increases moderated.
Source: Federal Reserve Economic Data (FRED) (https://fred.stlouisfed.org/series/IRLTLT01GBM156N) and Style Analytics Markets Analyzer
As of September 2023, the US 10-year yield surpassed 4.3%, while the UK Gilt increased to 4.2%. Consequently, if the ongoing upward trajectory of the US and UK’s 10-year yields remains consistent, we can reasonably expect Value stocks to maintain their outperformance over Growth stocks in both countries. However, it’s crucial to note that once yields peak and fail to increase by at least 10% each month, the model’s predictive power diminishes, and the expectation of Value stocks outperforming Growth stocks no longer holds.
The Confluence Style Analytics solution provides powerful analytics on your portfolio’s factor exposures, performance attribution and risk. Its intuitive visualizations bring your factor analysis to life through our industry-leading Style Skyline™. Additional modules unpack the “how” and “why” of exposure shifts and simulate rebalancing choices. Uncover your differentiating factor profiles for effective investor communications.
Request a demo by clicking here.
Disclaimer
The content provided by Confluence Technologies, Inc. is for general informational purposes only and does not constitute legal, regulatory, financial, investment, or other professional advice. It should not be relied upon as a substitute for specific advice tailored to particular circumstances. Recipients should seek guidance from appropriately qualified professionals before making any decisions based on this content.
Unless otherwise stated, Confluence Technologies, Inc. (or the relevant group entity) owns the copyright and all related intellectual property rights in this material, including but not limited to database rights, trademarks, registered trademarks, service marks, and logos.
No part of this content may be adapted, modified, reproduced, republished, uploaded, posted, broadcast, or transmitted to third parties for commercial purposes without prior written consent.
Author

About Confluence® Technologies
Confluence is a global leader in enterprise data and software solutions for regulatory, analytics, and investor communications. Our best-of-breed solutions make it easy and fast to create, share, and operationalize mission-critical reporting and actionable insights essential to the investment management industry. Trusted for over 30 years by the largest asset service providers, asset managers, asset owners, and investment consultants worldwide, our global team of regulatory and analytics experts delivers forward-looking innovations and market-leading solutions, adding efficiency, speed, and accuracy to everything we do. Headquartered in Pittsburgh, PA, with 700+ employees across North America, the United Kingdom, Europe, South Africa, and Australia, Confluence services over 1,000 clients in more than 40 countries. For more information, visit www.confluence.com.