
Executive summary
In the following report we review separate accounts and commingled funds post negotiated fees using Confluence’s Prism Analytics. Utilizing data from Confluence’s PARis platform, Prism Analytics aggregates insights from 80% of the top 20 consultants as ranked by P&I on institutional assets, including over 15K institutional plans, 400K portfolios, and $8T Assets Under Analysis. All data is provided by investment consultants with a fiduciary responsibility to get the numbers right. The information contained in this report is aggregated and anonymized.
Data & methodology
The report is based on actual post-negotiated fees, not listed fees, for separate accounts and commingled funds. We examined fees as of Q4 2023 by capitalization and style across U.S., International, and Global equity mandates. All accounts were actively managed.
Highlights
- Across developed market equities, a premium is paid for active small-cap averaging greater than 20 basis points.
- There is no premium paid within U.S. large-cap equity by style. However, there is for International value and Global growth.
- There is a premium paid for all cap value in International & Global equity compared to U.S. equity, where the all-cap premium favors growth.
- Developed markets median fees have come down an average of 3.3% over the last three years.
- Global large-cap value has seen the greatest fee compression (10%) since 2020.
US equities
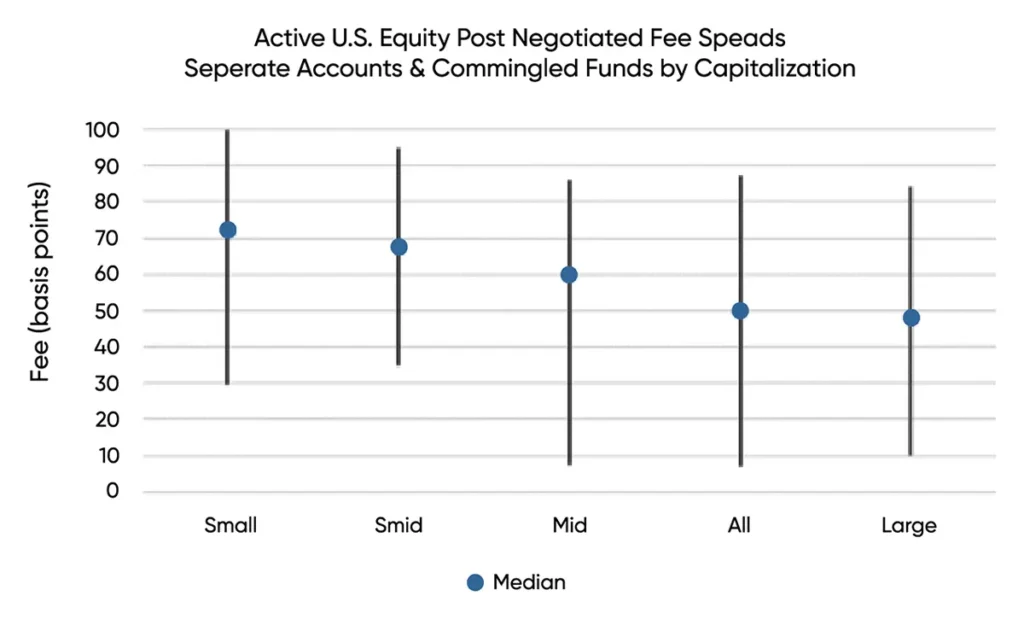
The chart below shows the high to low and median post-negotiated fee spreads for active U.S. Equity by capitalization. As expected, we observed a premium paid, at a median level, down the capitalization spectrum. The highest median fee paid was for active U.S Small Cap at 72 basis points and lowest fee paid to active U.S. Large Cap was at 47 basis points. Mandate size also had a significant impact on fees. This analysis was done for all mandate sizes, but if we examine fees for mandates over $100m we see median fees decrease dramatically, especially within large cap when their median fee comes down 25%.
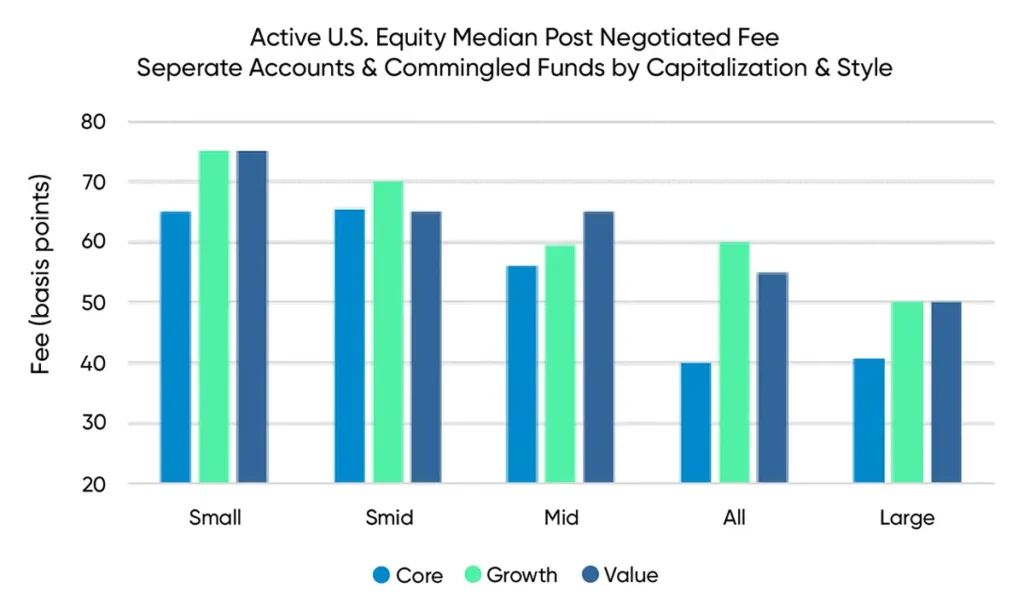
After examining the median fees by style and capitalization for active U.S. Equity, we observed an average 10-basis point premium for styles (value or growth) compared to core. While there was no difference comparing growth to value within large and small cap mandates, there is a premium paid for growth of 5 basis points within All and SMID cap. Interestingly, in the mid-cap space, we saw the opposite, as the median value fee was 5.5 basis points more than growth.
International & global equity fees
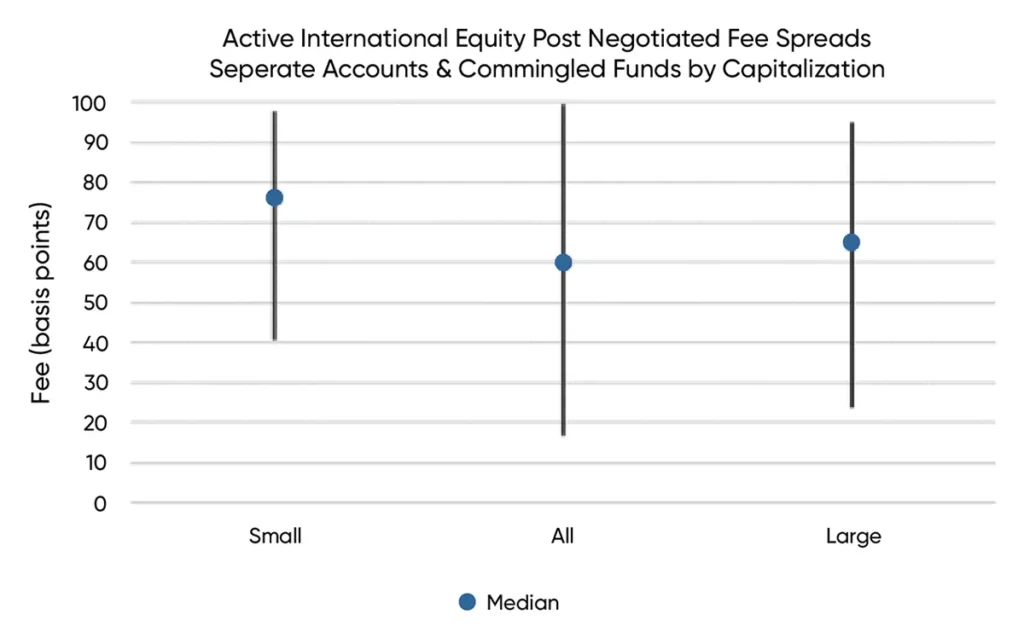
Examining active international equity fees, again, we saw a premium for small-cap compared to large, but to a lesser degree. In U.S. equity the small cap premium was 25 basis points, in international equity it is 11 basis points. Also of note, International all-cap strategies had the greatest spreads and a median fee of 5-basis points less than large cap.
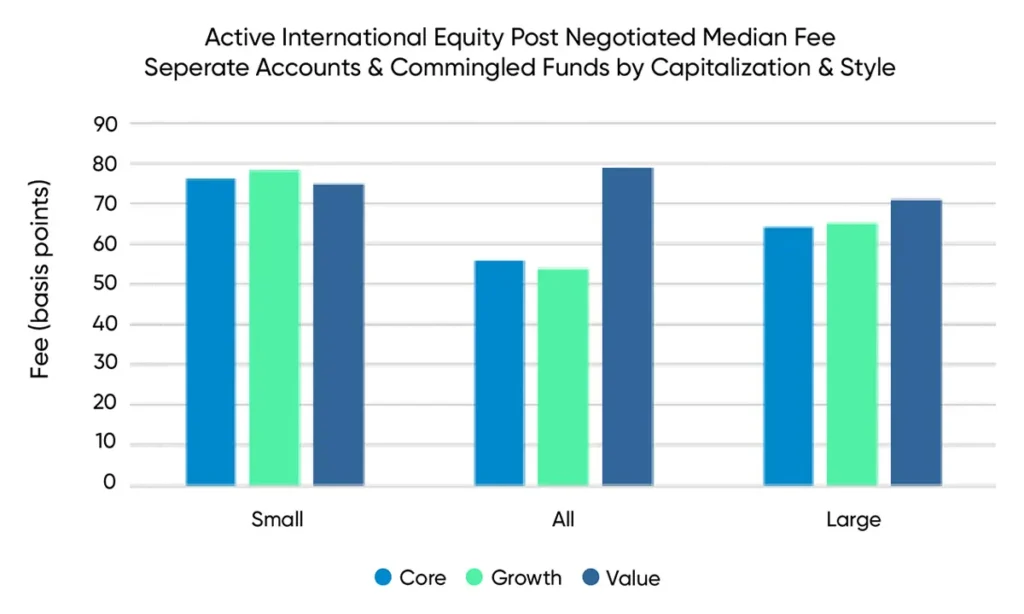
Within the small cap space, there were minimal differences by styles at the median level, with a slight premium for growth. Up the cap spectrum however, we observed a clear bias toward value in all and large caps.
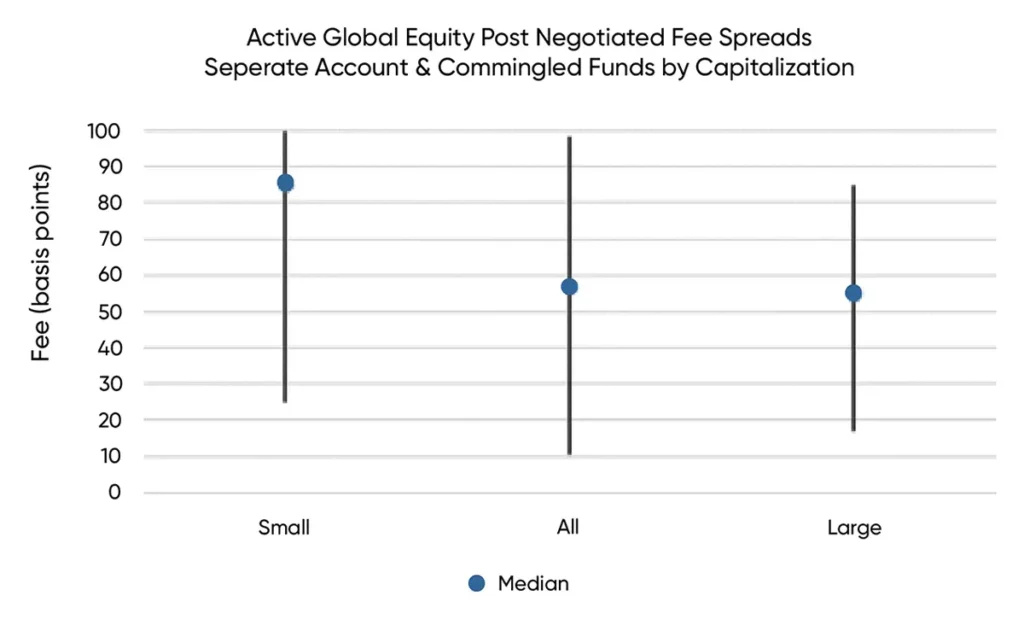
Global equity large cap fees fell out as expected between U.S. and International, with a median fee at 55 basis points. Similar to International, the greatest spread of fees was found in the all-cap space. However, the median global fee was a few basis points higher than the large cap.
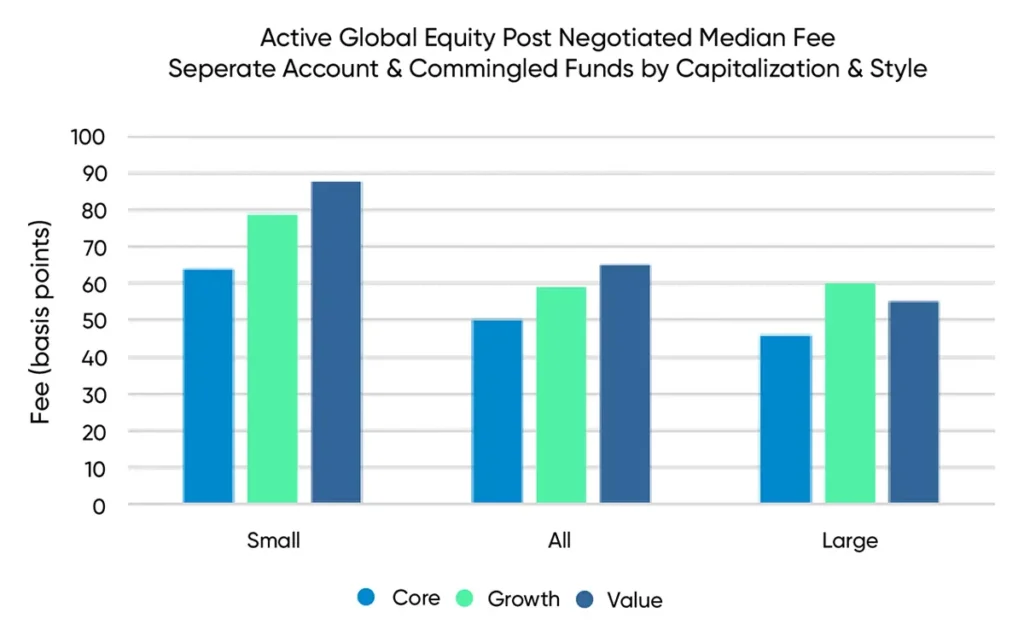
From a style perspective, there was a clear premium paid (6-8 basis points) for value over growth within small and all-cap. The opposite held within the global large cap, where we found a premium for growth.
Median fees compared to 2020
Comparing the median for U.S. equity in 2023 to 2020, fees came down on average 1.5 basis points across all mandates. The largest decrease observed was in the all-cap core space, where the median had come down nearly 6 basis points. Interestingly, in the smaller cap spectrum (mid, SMID, and small), value fees had the largest decrease between 3.2 and 4.3 basis points. Growth also decreased for the mid and small-cap mandates, but only about half of what value experienced. Large-cap value, mid-cap core, and small-cap growth did see fees increase, but the gains were minimal, on average less than .5 basis points.
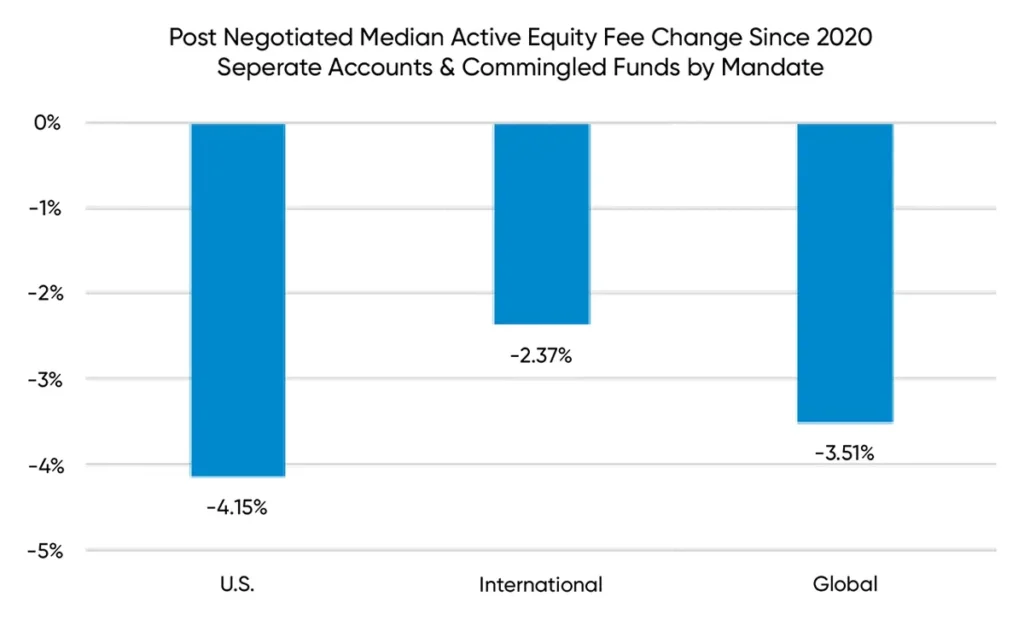
Across all developed markets, regardless of capitalization, we have seen the median post-negotiated fee come down over the last three years. As the chart above demonstrates, U.S. equity fees have seen the largest decrease, greater than 4%, while International has been the most resilient, decreasing 2.37%. Along style lines, global value has seen the greatest fee compression at 10%, while U.S. growth fees have remained steady.
Disclaimer
The content provided by Confluence Technologies, Inc. is for general informational purposes only and does not constitute legal, regulatory, financial, investment, or other professional advice. It should not be relied upon as a substitute for specific advice tailored to particular circumstances. Recipients should seek guidance from appropriately qualified professionals before making any decisions based on this content.
Unless otherwise stated, Confluence Technologies, Inc. (or the relevant group entity) owns the copyright and all related intellectual property rights in this material, including but not limited to database rights, trademarks, registered trademarks, service marks, and logos.
No part of this content may be adapted, modified, reproduced, republished, uploaded, posted, broadcast, or transmitted to third parties for commercial purposes without prior written consent.
Author

About Confluence® Technologies
Confluence is a global leader in enterprise data and software solutions for regulatory, analytics, and investor communications. Our best-of-breed solutions make it easy and fast to create, share, and operationalize mission-critical reporting and actionable insights essential to the investment management industry. Trusted for over 30 years by the largest asset service providers, asset managers, asset owners, and investment consultants worldwide, our global team of regulatory and analytics experts delivers forward-looking innovations and market-leading solutions, adding efficiency, speed, and accuracy to everything we do. Headquartered in Pittsburgh, PA, with 700+ employees across North America, the United Kingdom, Europe, South Africa, and Australia, Confluence services over 1,000 clients in more than 40 countries. For more information, visit www.confluence.com.