
Q2 2024 Factor Performance Analysis
Market Background
In Q2 2024, global equity markets continued to rise, with the MSCI ACWI returning just above 10%. The US market favored Growth, Quality, and High Momentum stocks, while Europe saw outperformance in Growth and Size. The UK market mirrored the US, demonstrating outperformance in Growth, Quality, and Size. Emerging Markets were led by Momentum, followed by Size. Canada exhibited a contrasting trend compared with its peers, with a notably larger factor premium for Yield.
The overall global economic activity remains relatively resilient, supported by declining inflation rates and growing private sector confidence. Despite these positive signs, rising geopolitical tensions are expected to impact economic dynamics, depending on the outcomes of global events.
Oil prices slightly increased to $86.76/barrel from the last quarter after dropping to $84/barrel in May. Bitcoin hit all-time highs in Q2, even as the market began decreasing expectations rate cut since the beginning of 2024. Finally, gold closed the quarter out at $2,382/TOz, after reaching a record high of $2,426/TOz in May.
Factor Summary
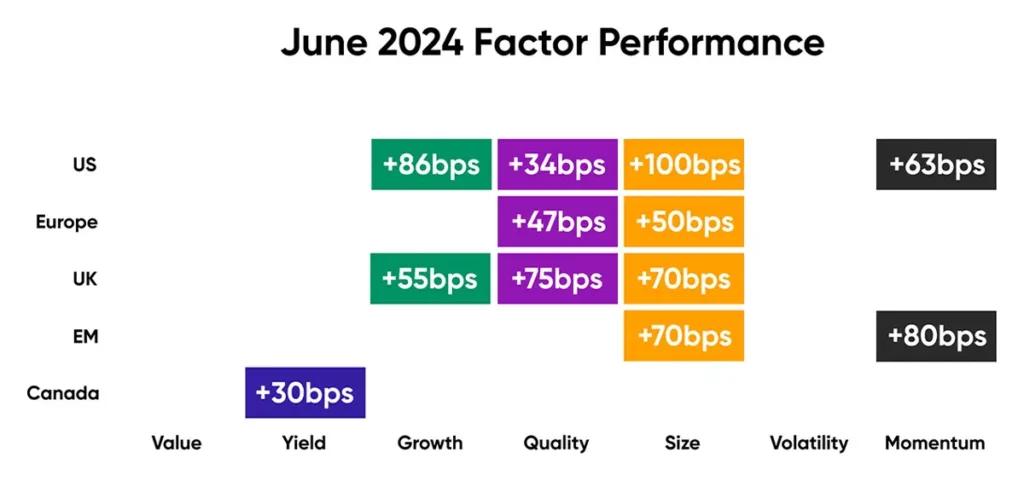
Source: Confluence
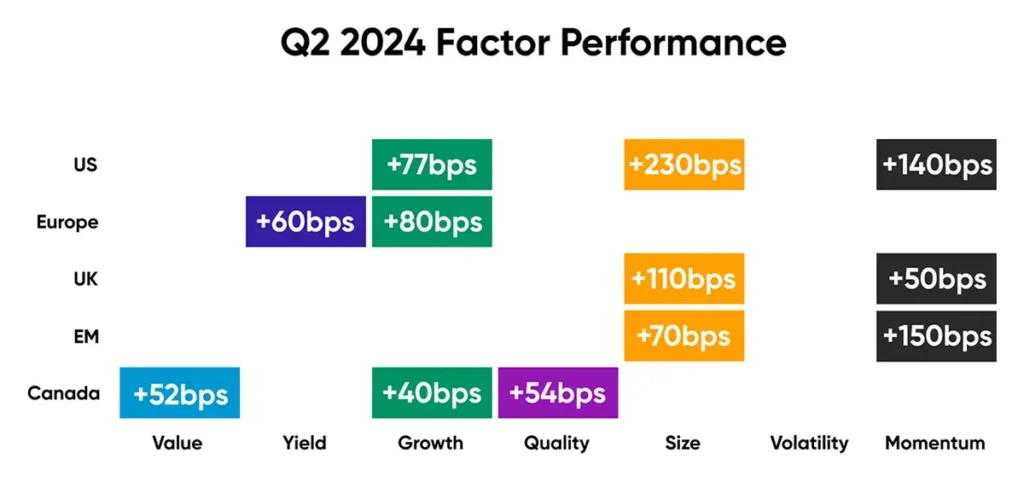
Source: Confluence
US Equities
After a turbulent beginning, stocks ended the second quarter higher as the market stayed optimistic, given the downward trend of Inflation. The S&P 500 concluded the quarter outperforming its equal-weight counterpart by 3.92%.
The annual inflation rate in the United States was 3.3% for the 12 months ending in May, down from the previous rate of 3.4%. Gasoline and used car prices likely decreased, shelter costs moderated, while food prices probably increased slightly. Meanwhile, core inflation is expected to remain steady at 3.4%
Quality, exemplified by the return on equity subfactor, led the US market in Q2, driving nearly 330bps of relative performance, with an additional 80bps surge observed in June alone. Growth and Momentum stocks continued their market outperformance, with the “Momentum 12-1” subfactor surpassing market performance by almost 110bps during the quarter.
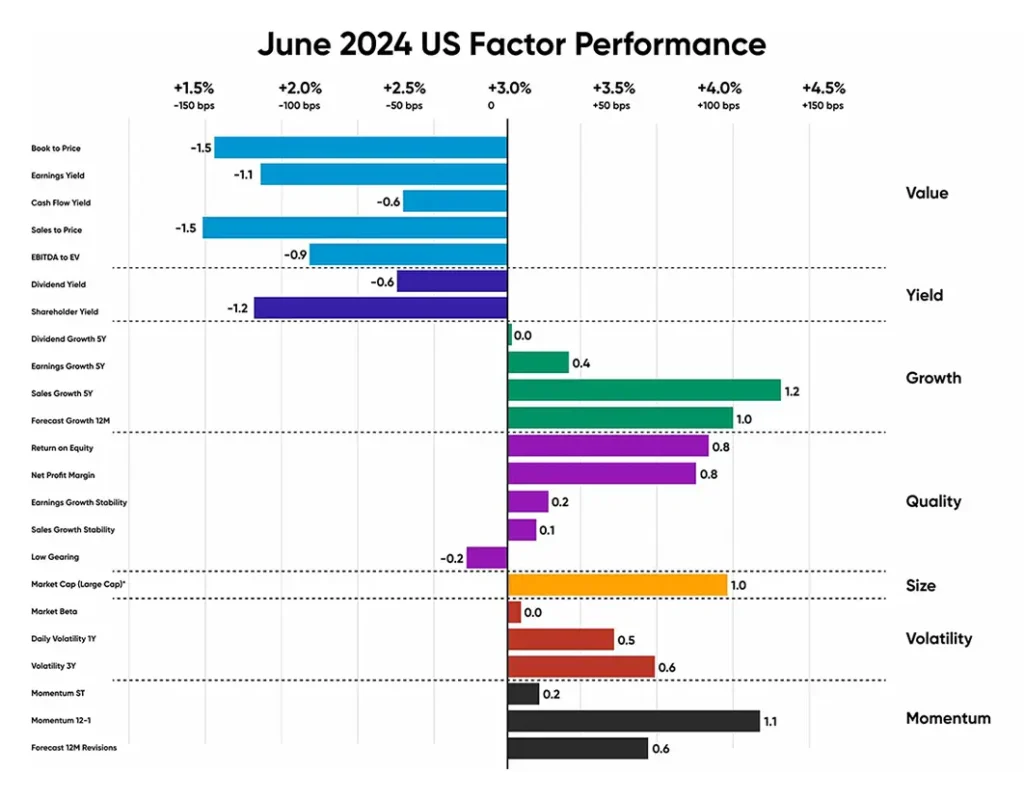
Source: Confluence
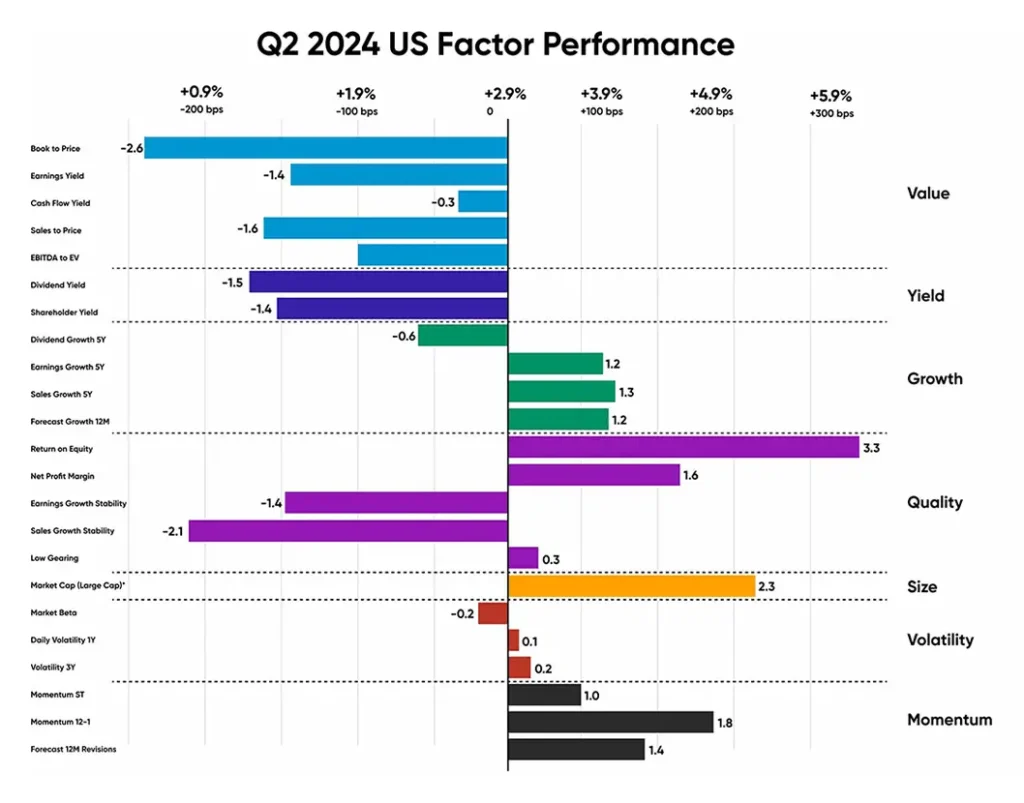
Source: Confluence
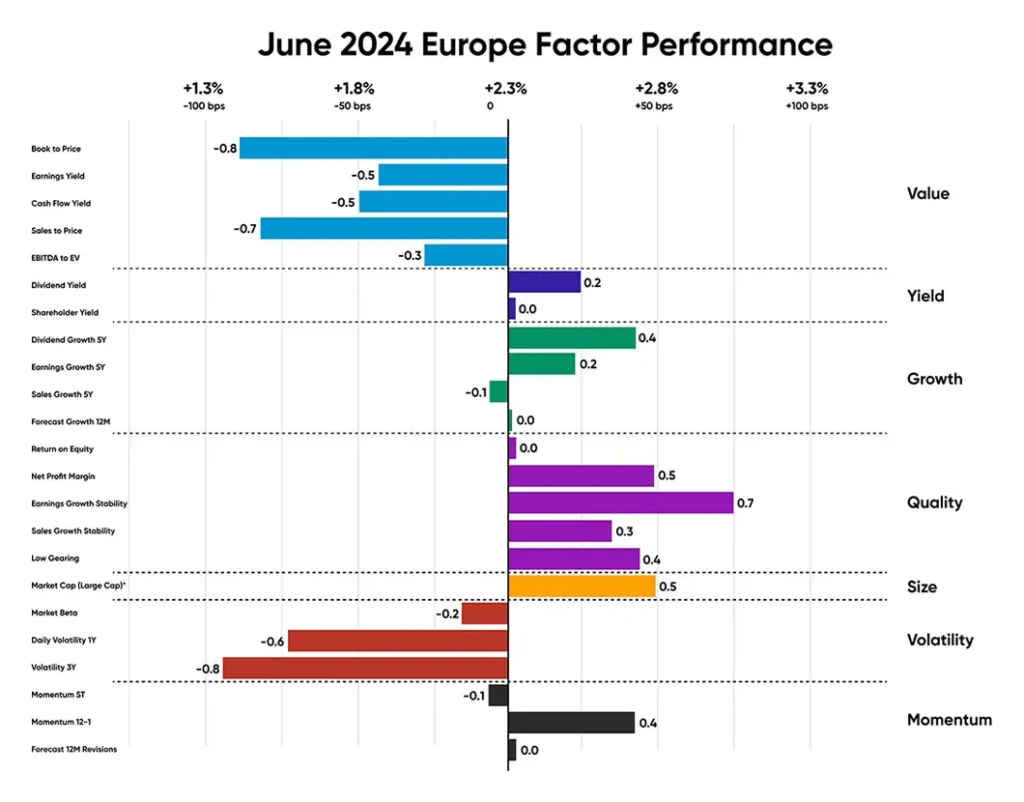
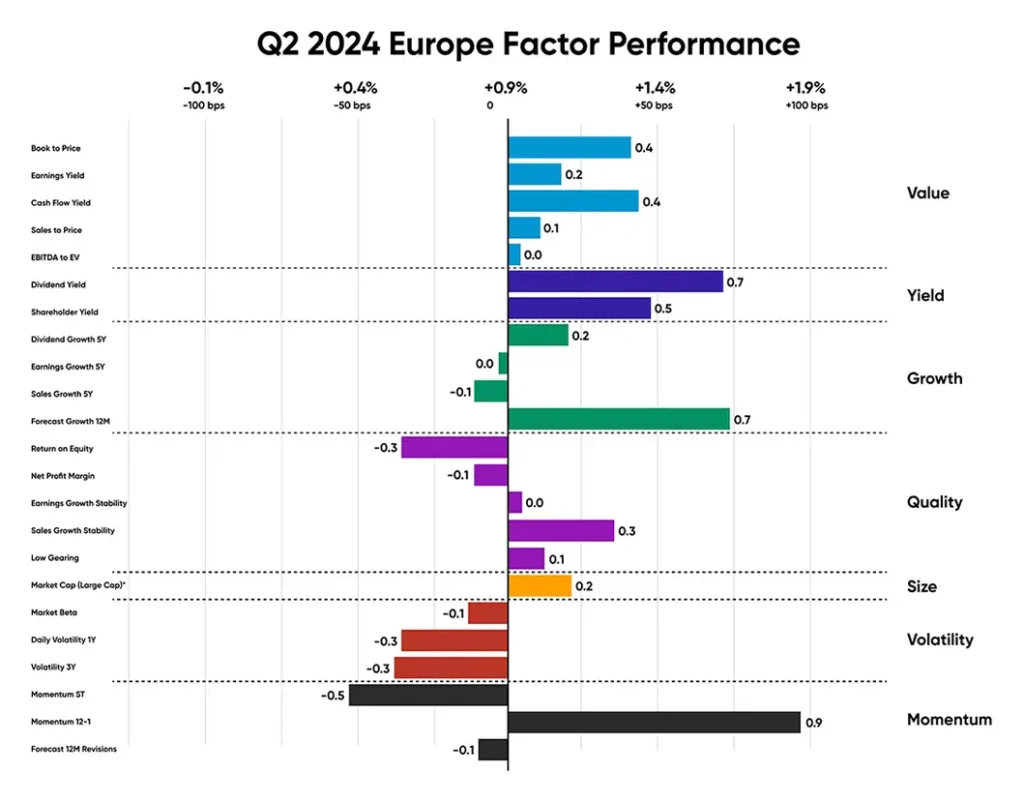
European Equities
The European stock market displayed an uncertain factor trend this month, with Growth and Momentum sending mixed signals. Notably, Value and Volatility stocks consistently underperformed the market, while Size and Quality dominated gains in June. Although all Quality factors outperformed the market in June, return on equity and net profit margin underperformed quarterly.
Following a brief rise in May, the Eurozone inflation in Q2 eased to 2.5% in June, meeting market expectations, with Belgium reaching a 10-month high, while Germany experienced a decline. The main components of the Euro area inflation services had the highest annual rate in June at 4.1%, remaining unchanged from May. This was followed by food, alcohol, and tobacco at 2.5%, slightly down from 2.6% in May, and energy at 0.2%, down from 0.3% in May. Notable outperformers with earnings growth stability include healthcare company UCB (+21% in Q2), French industrials company Schneider Electric SE (+8% in Q2), and financials company Tatra Banka AS (+12% in Q2).
Source: Confluence
Source: Confluence
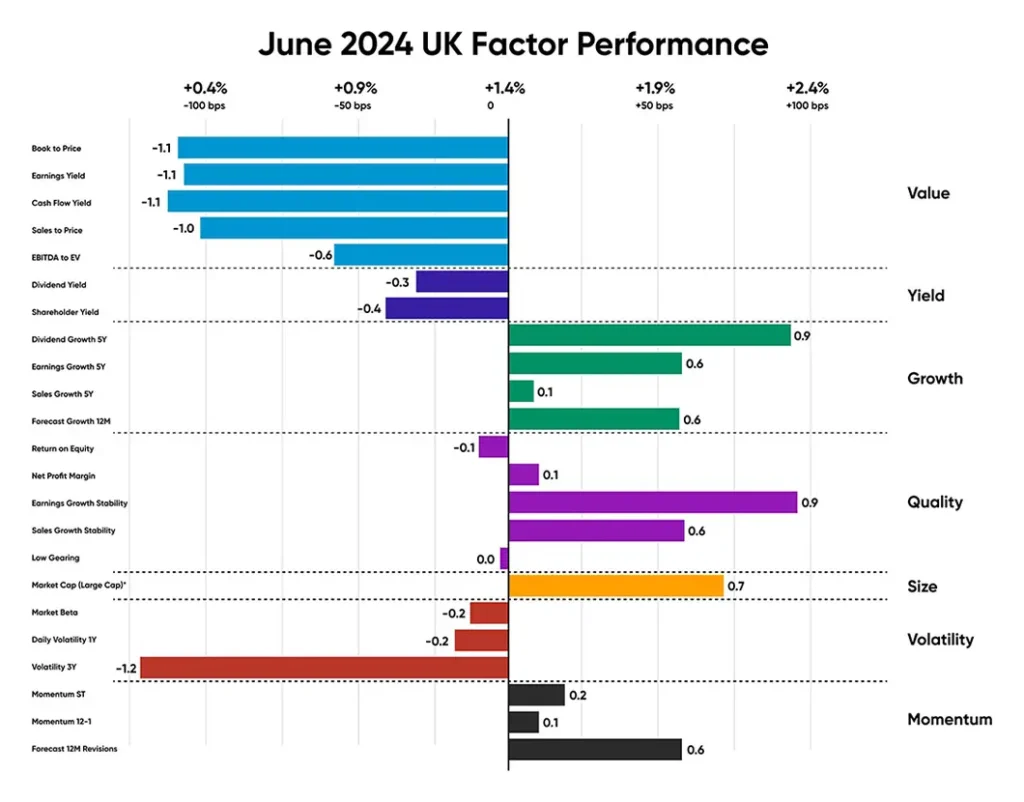
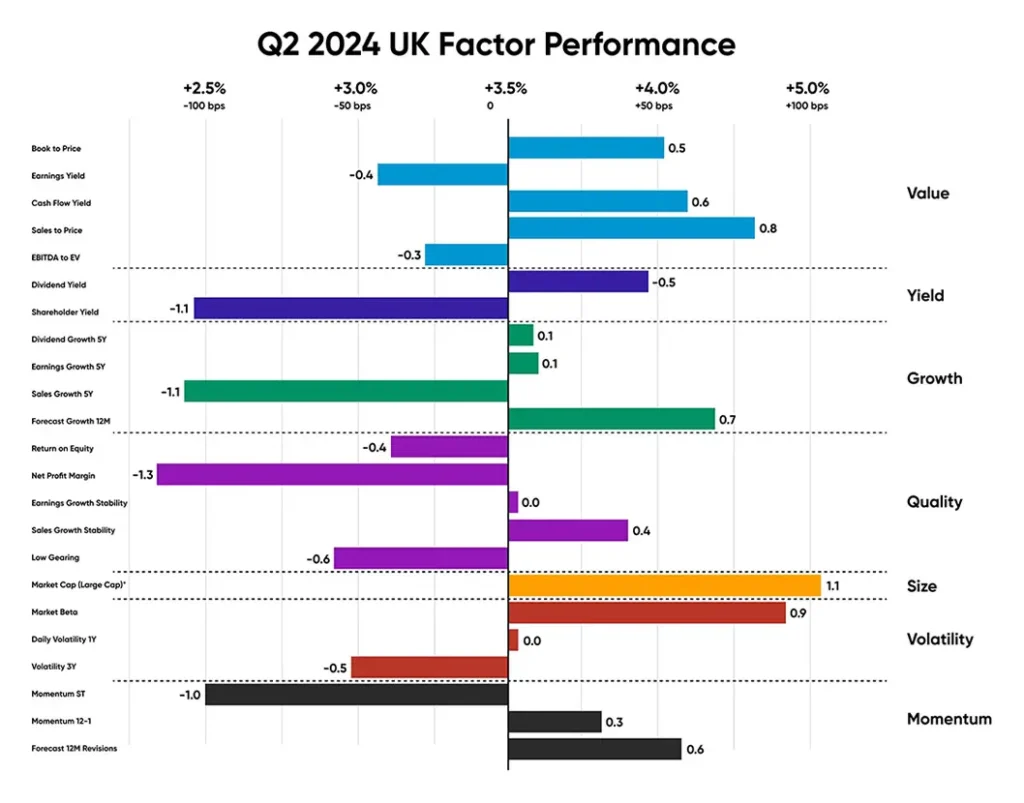
UK Equities
While the UK has historically trailed behind the US and Europe in performance, in the second quarter of 2024, UK equities outperformed their US and European counterparts with a quarterly performance of 3.5%.
The annual inflation rate in the UK slowed to 2% in May 2024, the lowest since July 2021. The Inflation was led by a slowdown in the cost of food (1.7%), and the cost of housing and utilities continued to decline to -4.8%.
Like their European counterparts, June showed a distinct preference for Size and Quality stocks, particularly those with strong earnings growth stability, while the quarterly chart reflects strong outperformance in Size, by 110bps.
Quality equities from an Earnings Growth Stability perspective that helped Quality outperform in the region include financials company HSBC Holdings PLC (+15% in Q2); AstraZeneca PLC (+16% in Q2) and Anglo American PLC (+28% in Q2).
Source: Confluence
Source: Confluence
Emerging Market Equities
The Emerging markets in this quarter saw a notable outperformance in Value, Growth, Quality, and Momentum outperforming the market, particularly forecast 12M revisions outperforming the market by 260bps. In this quarter, volatile stocks showed an underperformance, while Quality stocks showed mixed performance with the low-gearing subfactor, which assesses companies with low leverage, notably underperformed in the month of June, as well as the quarter. Companies that led Emerging Markets this quarter include Taiwanese semiconductor company TSMC (+40% in Q2) and Chinese energy company China Shenhua Energy Company (+11% in Q2).

Source: Confluence

Source: Confluence
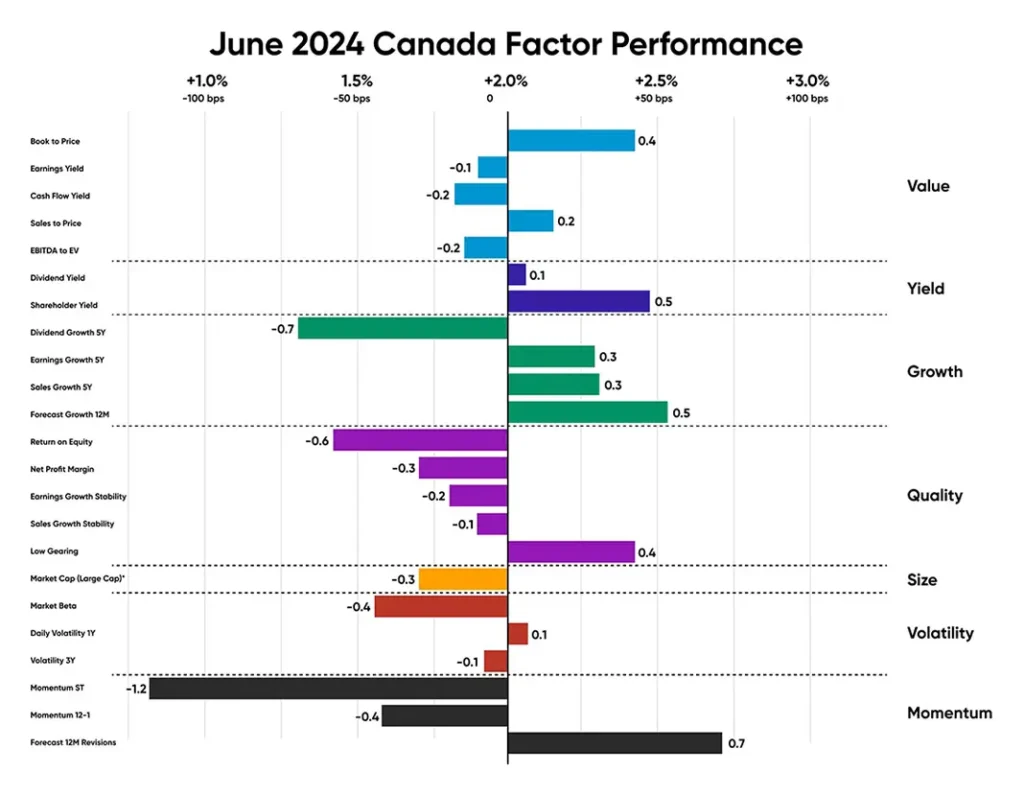
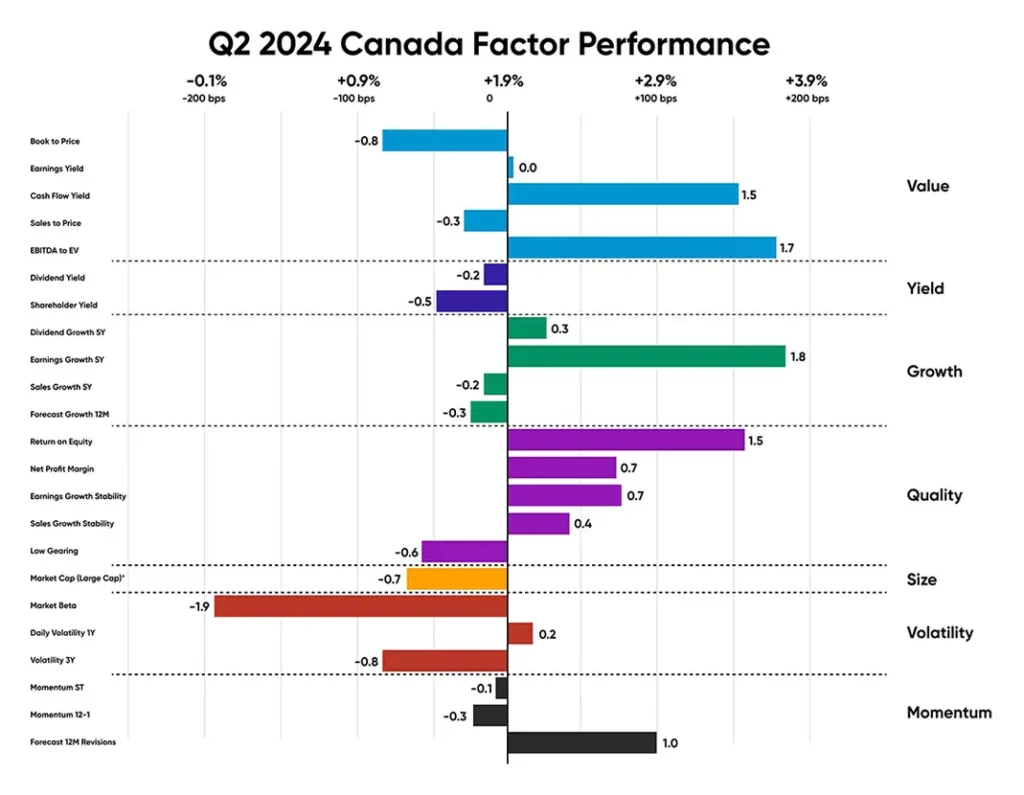
Canadian Equities
In Q2, Canadian investors preferred Quality with a strong return on equity, outperforming by 150bps in the quarter. Growth subfactor, particularly earnings growth 5Y offered notable factor premium in the quarter, outperforming by 180bps.
The annual inflation rate in Canada increased to 2.9% in May 2024, up from a three-year low of 2.7% in the previous month, defying market expectations of a slowdown to 2.6%. Inflation for food also rose, reaching 2.5%, driven by higher grocery costs, marking the first acceleration since June 2023.
The Quality stocks with a high ROE ratio that led Canadian markets in Q2 mainly include materials company Agnico (+11% in Q2); tech company Constellation (+5% in Q2); and financials company RBC (+7% in Q2). Earnings growth stability was led by consumer staples company Loblaw Companies Ltd (+5% in Q2).
Source: Confluence
Source: Confluence
Appendix: How to read the charts
Each factor’s performance is based on the relative performance of its top 50% of stocks by market cap, compared to the overall market. The Size factor uses the top 70% of stocks, as the only exception.
For example, for the book-to-price factor, we determine the period’s performance of the basket of stocks with the highest book-to-price values, relative to the total market. Each factor is analyzed independently, market and fundamental data are adjusted to enable sector-average (within each country) relative data to be used, and the performance measurement isolates the factor’s contribution to return.
Disclaimer
The content provided by Confluence Technologies, Inc. is for general informational purposes only and does not constitute legal, regulatory, financial, investment, or other professional advice. It should not be relied upon as a substitute for specific advice tailored to particular circumstances. Recipients should seek guidance from appropriately qualified professionals before making any decisions based on this content.
Unless otherwise stated, Confluence Technologies, Inc. (or the relevant group entity) owns the copyright and all related intellectual property rights in this material, including but not limited to database rights, trademarks, registered trademarks, service marks, and logos.
No part of this content may be adapted, modified, reproduced, republished, uploaded, posted, broadcast, or transmitted to third parties for commercial purposes without prior written consent.
Author

About Confluence® Technologies
Confluence is a global leader in enterprise data and software solutions for regulatory, analytics, and investor communications. Our best-of-breed solutions make it easy and fast to create, share, and operationalize mission-critical reporting and actionable insights essential to the investment management industry. Trusted for over 30 years by the largest asset service providers, asset managers, asset owners, and investment consultants worldwide, our global team of regulatory and analytics experts delivers forward-looking innovations and market-leading solutions, adding efficiency, speed, and accuracy to everything we do. Headquartered in Pittsburgh, PA, with 700+ employees across North America, the United Kingdom, Europe, South Africa, and Australia, Confluence services over 1,000 clients in more than 40 countries. For more information, visit www.confluence.com.