
Q2 2023 Fee Analyzer Report
Executive summary
This report used Confluence’s Investment Metrics Fee Analyzer, the institutional industry’s most comprehensive tool to analyze post-negotiated fees to compare the performance and fees from active Emerging Markets equity managers with high dividend yield portfolios to the broad peer group.
The analysis includes over 1,100 active manager post-negotiated fees from 76 asset managers from the Investment Metrics (IM) Emerging Markets Equity peer group.
Highlights
- Active Emerging Markets equity managers’ relative performance has rebounded in 2023; the median portfolio in the IM Emerging Markets Large Cap peer group has outperformed the MSCI Emerging Markets Index by 2.1% year to date.
- Emerging Markets equity portfolios with above median dividend yields (>3%) offer even stronger relative performance, outperforming the benchmark by 3.8%.
- Over three years, emerging markets portfolios with above median dividend yields produced significantly stronger returns than peers, with lower risk and fees.
Emerging markets equity performance
After a difficult 2022, during which the MSCI Emerging Markets Index returned -19.74%, emerging markets equity performance has rebounded in 2023. As Chart 1 highlights, the benchmark’s return year to date is 5.1%. More importantly, active manager relative performance has also been strong in 2023, outperforming by more than 2% at the median level.
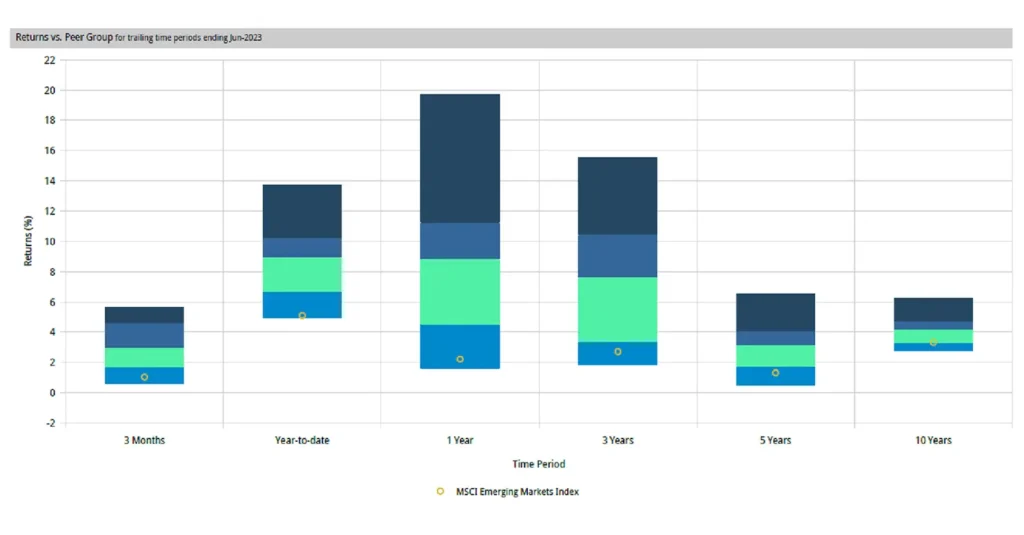
Source: Investment Metrics, a Confluence company
Emerging markets equity high dividend yield (>3%)
As our colleagues highlighted in their recent Q21H Factor Performance Report, emerging markets equity performance was driven by Value, Yield, and Quality during the first half of 2023. With this in mind, we screened the IM Emerging Markets Equity peer group for products with above-median dividend yields (>3%). As Chart 2 highlights, these portfolios have very strong absolute and relative performance, returning 8.93% at the median level, which is more than 3.8% above the benchmark year to date.
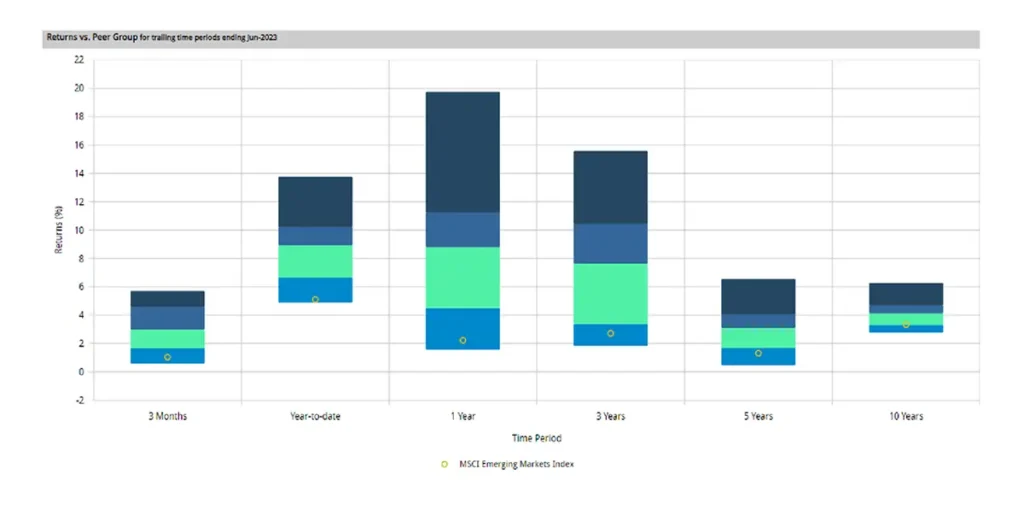
Source: Investment Metrics, a Confluence company.
Emerging markets equity high dividend yield risk vs. return
What makes the emerging market’s high dividend products compelling, beyond the lower fee, is their risk /return profile. Chart 3 compares the median 3-year standard deviation and return for the high dividend products versus the IM Emerging Markets Large Cap peer group. The higher dividend products have significantly higher returns (7.63% vs. 3.72%) with lower risk (standard deviation 18.2 vs. 18.5).
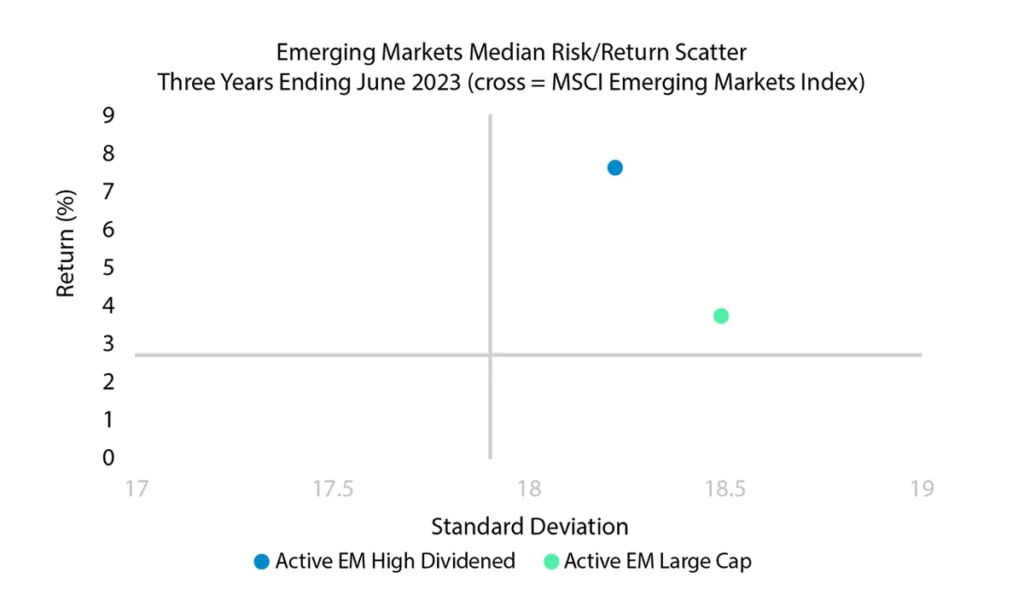
Source: Investment Metrics, a Confluence company.
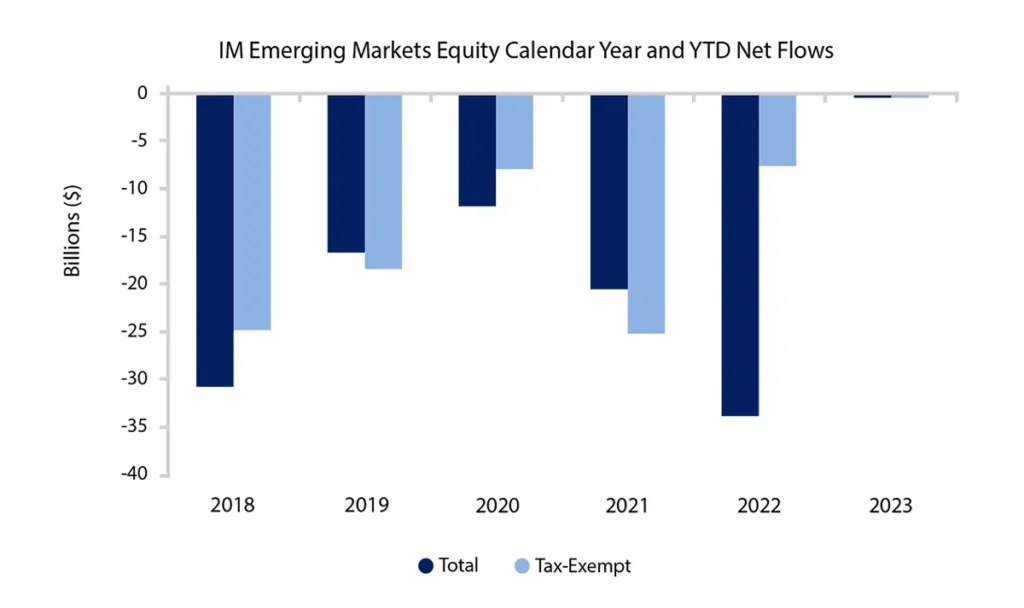
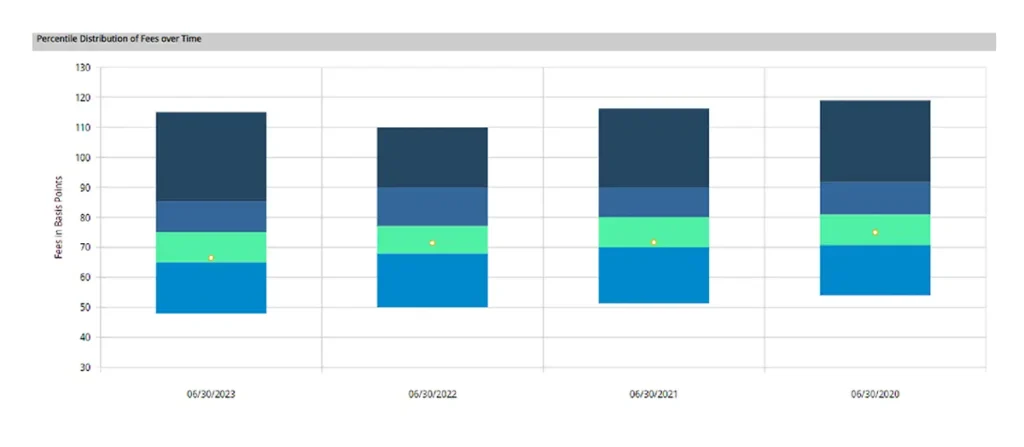
In the last few years, emerging markets equity portfolios have faced tremendous headwinds, which have resulted in flows out (Chart 4) and downward pressure on fees. In Chart 5, we show the postnegotiated fee ranges for active emerging markets equity portfolios over time. Since 2020, we have seen the median fee come down more than 7% to 75 basis points as of Q2 2023. Included in the chart is the median fee for the high dividend yield products. As of Q2 2023, the median fee for the high dividend yield portfolios was 66.5 basis points, a 10% discount compared to peers.
Source: Investment Metrics, a Confluence company.
Emerging markets equity fees
The appetite for emerging markets has faced tremendous headwinds resulting in flows out and downward pressure on fees (Chart 4). In Chart 3, we show the post-negotiated fee ranges for active emerging markets equity portfolios over time. Since 2020, we have seen the median fee come down more than 7% to 75 basis points as of Q2 2023. Included in the chart is the median fee for the high dividend yield products. As of Q2 2023, the median fee for the high dividend yield portfolios was 66.5 basis points, a 10% discount compared to peers.
Source: Investment Metrics, a Confluence company.
Investment Metrics Fee Analyzer
Investment Metrics’ Fee Analyzer is the industry’s leading source of post-negotiated manager fees. Fee Analyzer is an interactive tool used to benchmark post-negotiated manager fees across 70,000 observations and 65 investment styles. It compares negotiated fees (rather than list or published fees) for different plan types, mandate sizes, and asset classes. With Fee Analyzer’s reliable fee data, asset allocators and managers gain competitive insights from benchmarking and evaluating fees vs. returns and risk—essential to manager selection, fee transparency, and pricing efficiency across the institutional investment market.
Disclaimer
The content provided by Confluence Technologies, Inc. is for general informational purposes only and does not constitute legal, regulatory, financial, investment, or other professional advice. It should not be relied upon as a substitute for specific advice tailored to particular circumstances. Recipients should seek guidance from appropriately qualified professionals before making any decisions based on this content.
Unless otherwise stated, Confluence Technologies, Inc. (or the relevant group entity) owns the copyright and all related intellectual property rights in this material, including but not limited to database rights, trademarks, registered trademarks, service marks, and logos.
No part of this content may be adapted, modified, reproduced, republished, uploaded, posted, broadcast, or transmitted to third parties for commercial purposes without prior written consent.
Authors


About Confluence® Technologies
Confluence is a global leader in enterprise data and software solutions for regulatory, analytics, and investor communications. Our best-of-breed solutions make it easy and fast to create, share, and operationalize mission-critical reporting and actionable insights essential to the investment management industry. Trusted for over 30 years by the largest asset service providers, asset managers, asset owners, and investment consultants worldwide, our global team of regulatory and analytics experts delivers forward-looking innovations and market-leading solutions, adding efficiency, speed, and accuracy to everything we do. Headquartered in Pittsburgh, PA, with 700+ employees across North America, the United Kingdom, Europe, South Africa, and Australia, Confluence services over 1,000 clients in more than 40 countries. For more information, visit www.confluence.com.