
Q1 2024 Factor Performance Analysis
Market background
In Q1 2024, global equity markets performed strongly, with the MSCI ACWI returning just above 8%. The US market favored Growth, Volatility, and high Momentum stocks, driven by a clear risk-on factor profile, while Europe saw outperformance in Size and Momentum. In contrast, the UK market positioned defensively, showing a preference for Value and Yield stocks over Growth and Volatility. Emerging Markets were led by Momentum, with Value and Growth stocks also marginally outperforming. Canada exhibited a mix of US and EM trends, with a notably larger factor premium for Value and Growth compared with its peers.
Global market attention is on the US Federal Reserve for guidance on approaching declining inflation and positive economic sentiment, ensuring a cautious approach to avoid premature rate adjustments. Despite earlier market anticipation of a rate cut this quarter, US inflation remains above 3%, prompting Jerome Powell’s prudent stance, which postponed market expectations of a rate cut until July. Meanwhile, Europe maintains a leading role in managing inflation, evidenced by reaching a 28-month low of 2.4% in March, with a core rate of 2.9%. The European Central Bank is anticipated to maintain steady rates, though markets speculate a potential 25bps rate cut as early as June, subject to further CPI data.
Oil prices increased to $86/barrel as conflict in Israel and Gaza continues. Bitcoin and other risk-on assets surged on the news of potential rate cuts, hit all-time highs in Q1, even as the market began decreasing expectations for a Q1 rate cut. Finally, gold closed the quarter out +3% at $2,124/TOz. However, it increased significantly in the first week of April, reaching over $2,300/TOz, or +15% since January 1st.
Factor summary
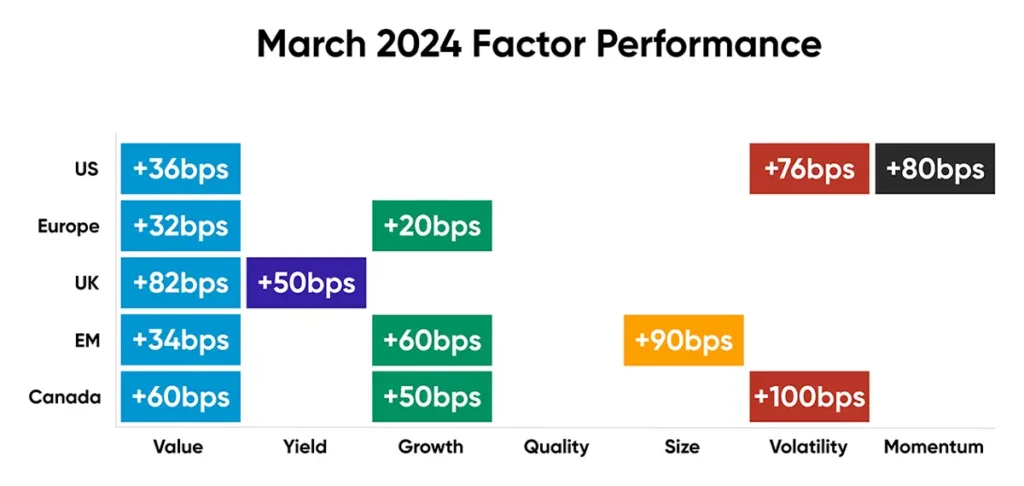
Source: Investment Metrics, a Confluence company
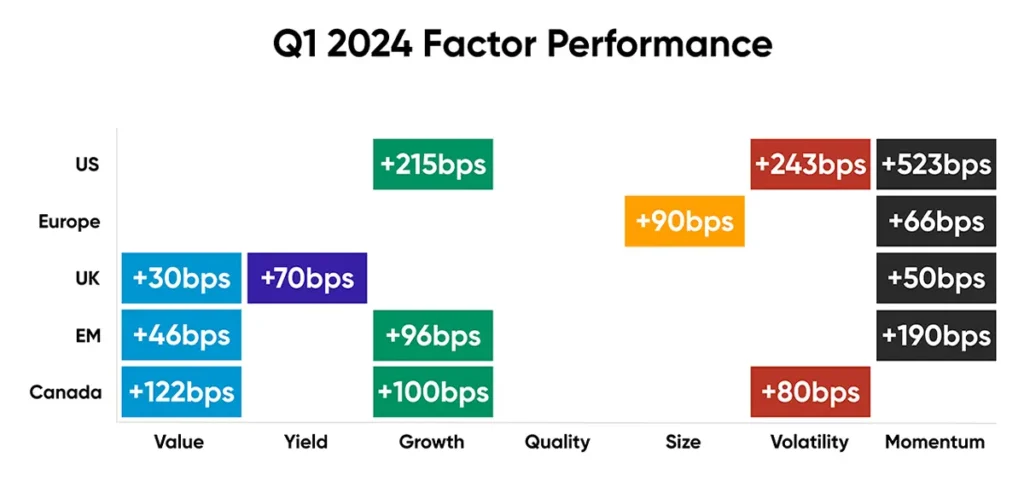
Source: Investment Metrics, a Confluence company
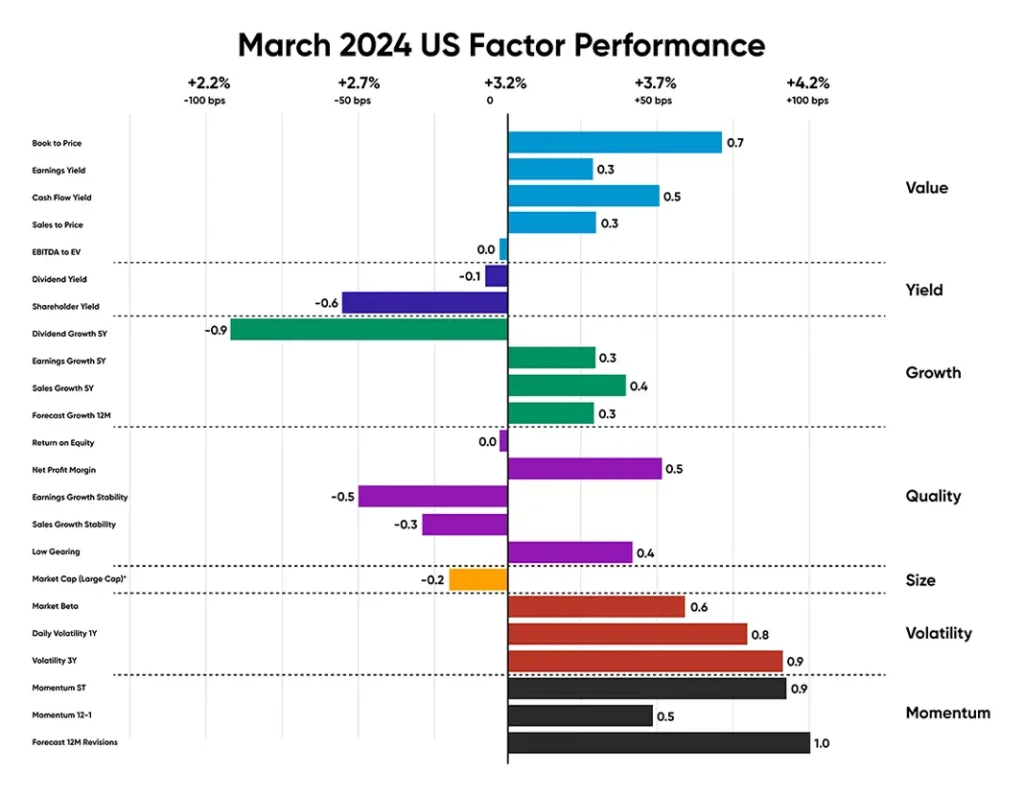
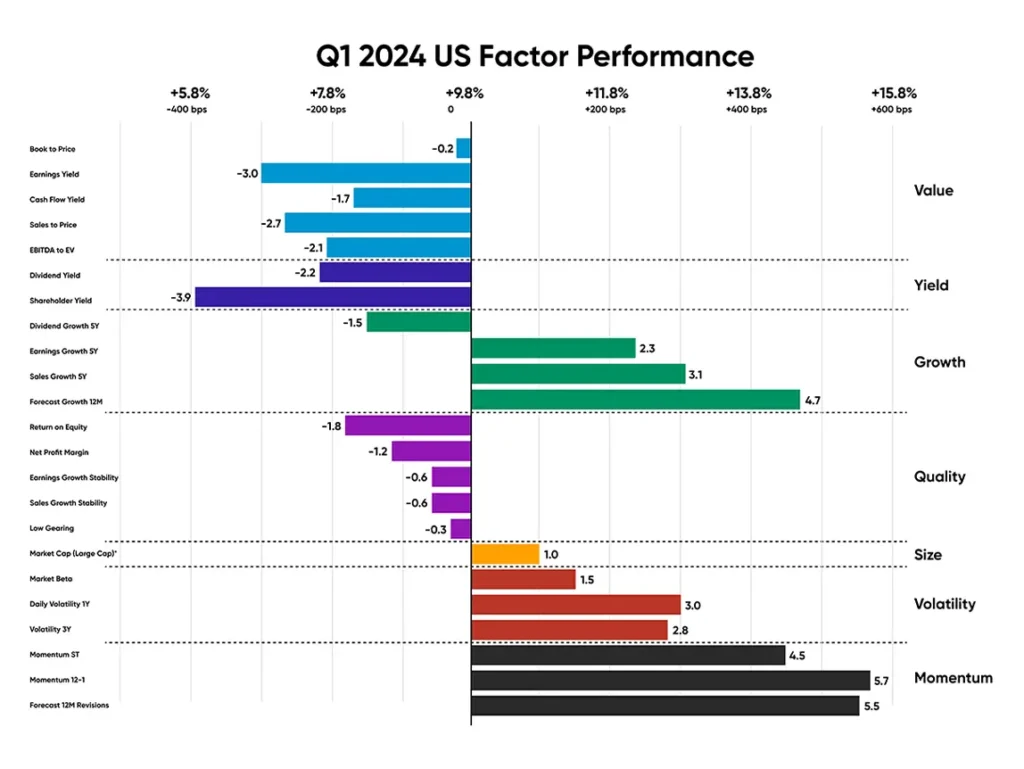
US equities
US equities began the first quarter of 2024 with robust returns, building on the momentum surge witnessed towards the end of 2023. The S&P 500 maintained its outperformance over its equal weight counterpart, yielding a return of 10.23% compared to the equally weighted S&P 500’s 7.39%, indicating a top-heavy rally primarily driven by mega-cap stocks.
Despite inflation persistently exceeding 3%, other economic indicators portray a positive outlook for the US economy. Consumer spending reached a new all-time high in Q1, totaling $15.5 trillion, while consumer confidence surged to its highest level since July 2021. Although retail sales growth moderated compared to Q4, they remained positive throughout Q1, in contrast with the performance of their European counterparts. Manufacturing production expanded at its quickest pace in nearly two years, accompanied by businesses’ optimism regarding future output growth amidst expectations of improving economic conditions.
Annual Momentum, exemplified by the “Momentum 12-1” subfactor, led the US market in Q1, driving nearly 600bps of relative performance, with an additional 100bps surge observed in March alone. Growth and Volatility stocks continued their market outperformance, with the “forecast growth 12M” subfactor surpassing market performance by almost 500bps during the quarter.
Momentum 12-1 powered the US stock market this quarter, led by tech stocks like Nvidia and Meta, which respectively returned 82% and 37% in Q1. This rally wasn’t limited to just tech; Stocks in Industrials (General Electric, +37% in Q1; Caterpillar, +24% in Q1), Financials (JP Morgan, +18% in Q1; Berkshire Hathaway, +17% in Q1) and Healthcare (Eli Lilly, +33% in Q1; Merck, +21% in Q1) all contributed to the momentum surge.
Source: Investment Metrics, a Confluence company
Source: Investment Metrics, a Confluence company
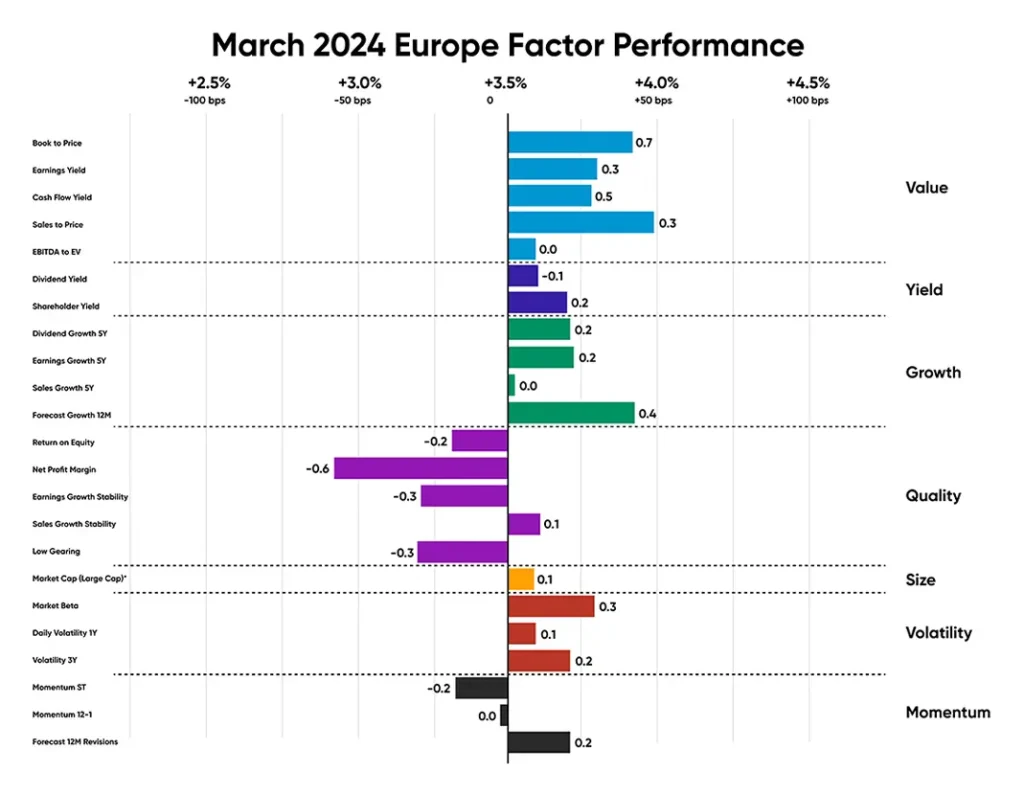
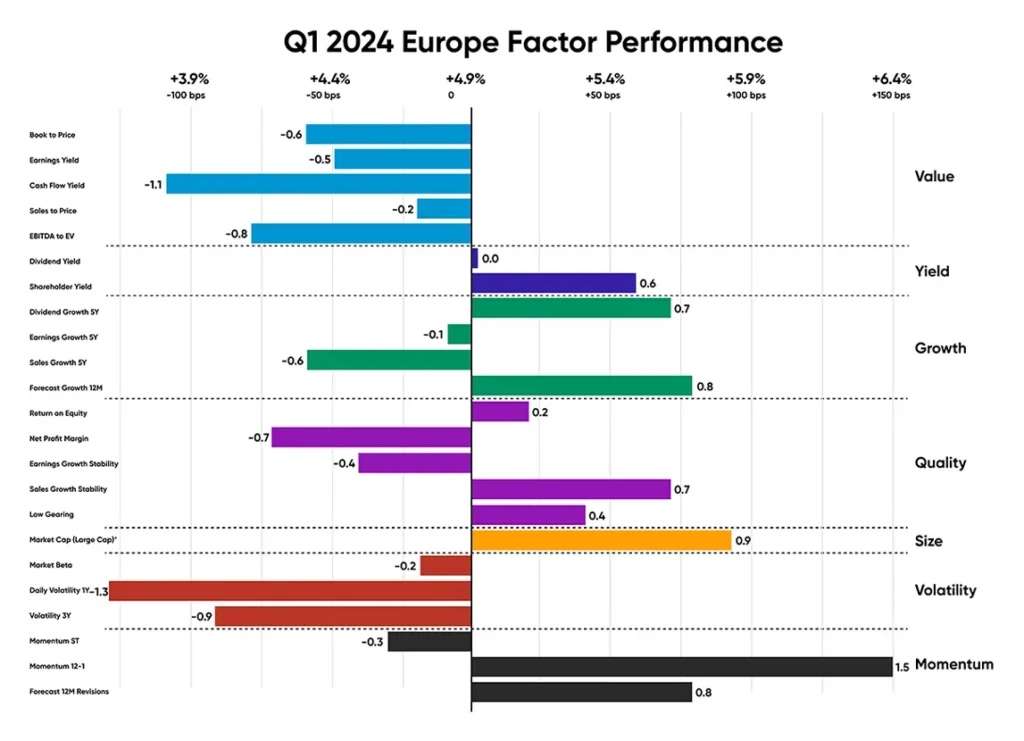
European equities
The European stock market displayed an uncertain factor trend this month, with Quality and Growth sending mixed signals. Notably, Value and Volatility stocks consistently underperformed the market, while Size and Momentum dominated gains in Q1. Although Value and Volatility slightly outperformed the market in March, their factor premiums of 50bps were half of those in the US, where top factors outperformed by 100bps.
In the Eurozone, inflation exceeded expectations in Q1, reaching a 28-month low of 2.4%, prompting anticipation of potential ECB rate cuts in June, as indicated by German 10Y Bund falling to 2.2%. European consumer spending remained steady, rising by 0.06% from the previous quarter, with consumer confidence hitting its highest level since 2022. However, the S&P Global Construction and Manufacturing PMI’s declined this quarter, extending a 12-month output decline streak, while retail sales fell by 0.50% in February after similar decreases in December and stagnation in January.
Notable outperformers with strong price momentum include Spanish bank BBVA (+31% in Q1), Italian bank Unicredit SPA (+40% in Q1), and German industrial firm Daimler Truck Holding AG (+35% in Q1).
Source: Investment Metrics, a Confluence company
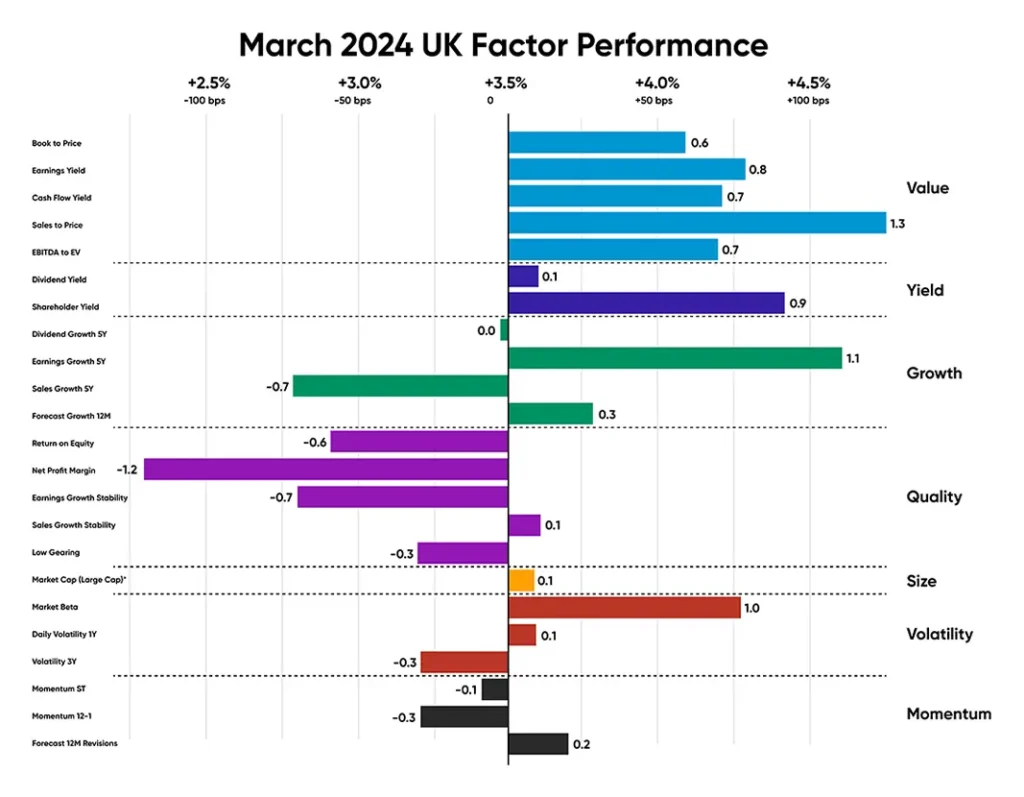
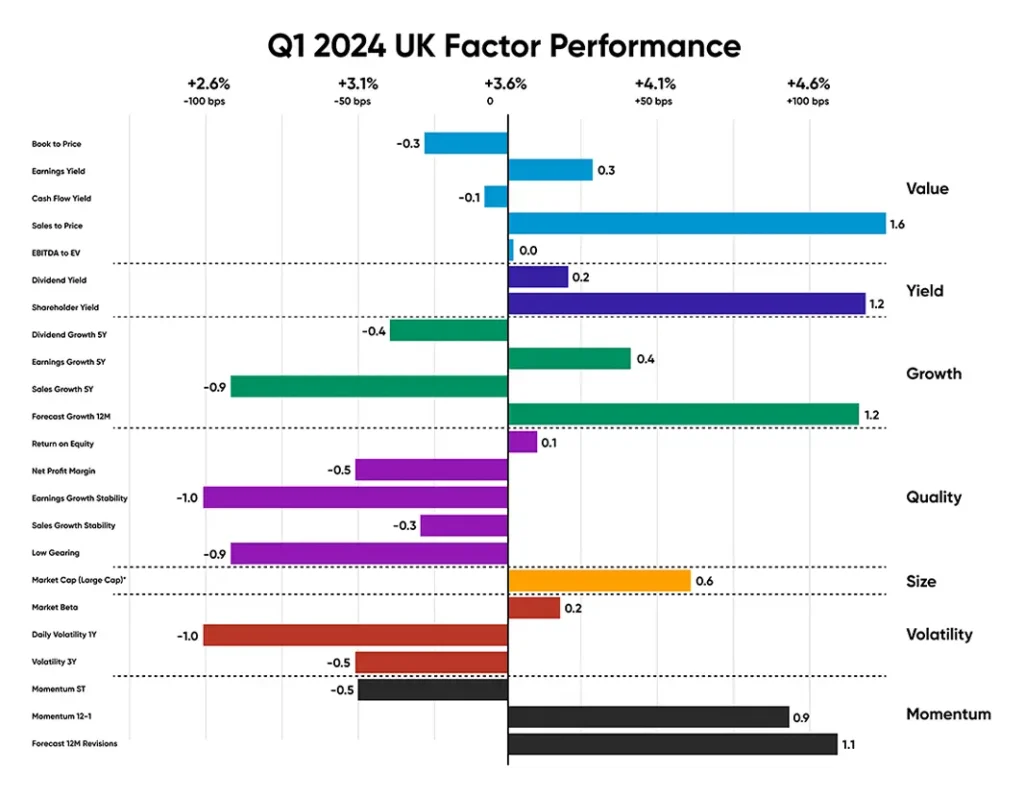
UK equities
While the UK has historically trailed behind the US and Europe in performance, the disparity has narrowed notably in recent times. In March, UK equities even outperformed their US and European counterparts by
nearly 100bps. Over Q1, the UK still underperformed Europe by approximately 100bps, a significant improvement from the over 900bps underperformance observed in Q4.
Inflation in the UK declined to 3.4% after stagnating at 4% between November and January, contrasting with the US where inflation increased month-on-month. Despite this, unemployment in the UK rose slightly to 3.9%, and retail sales remained stagnant as of February. Consumer confidence also remained negative, signaling persistent pessimism, although there have been slight improvements in future expectations. Additionally, after six consecutive months of decline, both the S&P Construction and Manufacturing PMIs surpassed 50 in March, indicating expansion in activity for the first time since July 2022.
Like their European counterparts, the factor trend in the UK was less clearly defined compared to the US. March showed a distinct preference for Value stocks, particularly those with a strong sales-to-price ratio, as evidenced by the quarterly chart where sales to price outperformed all other subfactors by +140bps.
Value equities from a sales-to-price perspective that helped Value outperform in the region include pharmaceutical firm GSK PLC (+17% in Q1); Airspace company BAE Systems (+20% in Q1); Insurance company Beazley PLC (+28% in Q1) and NatWest Group (+25% in Q1)
Source: Investment Metrics, a Confluence company
Source: Investment Metrics, a Confluence company
Emerging market equities
In the previous quarter, there was a notable shift from the typical preference for Value, Yield, and dividend growth towards favoring Quality stocks, particularly those with consistent earnings and sales growth. In this quarter, high Yield stocks showed neutral performance while Quality stocks, especially those with a high net profit margin and stable sales growth, stood out. However, the low-gearing subfactor, which assesses companies with low leverage, notably underperformed in both periods.
Additionally, there was a significant change in Growth equity performance, with all Growth subfactors driving outperformance in both the monthly and quarterly perspectives for the first time in years.
Companies that led Emerging Markets this quarter include TSMC (+26% in Q1); China Shenhua Energy Company (+22% in Q1); Chinese technology company Foxconn (+47% in Q1) and Agricultural Bank of China (+14% in Q1).
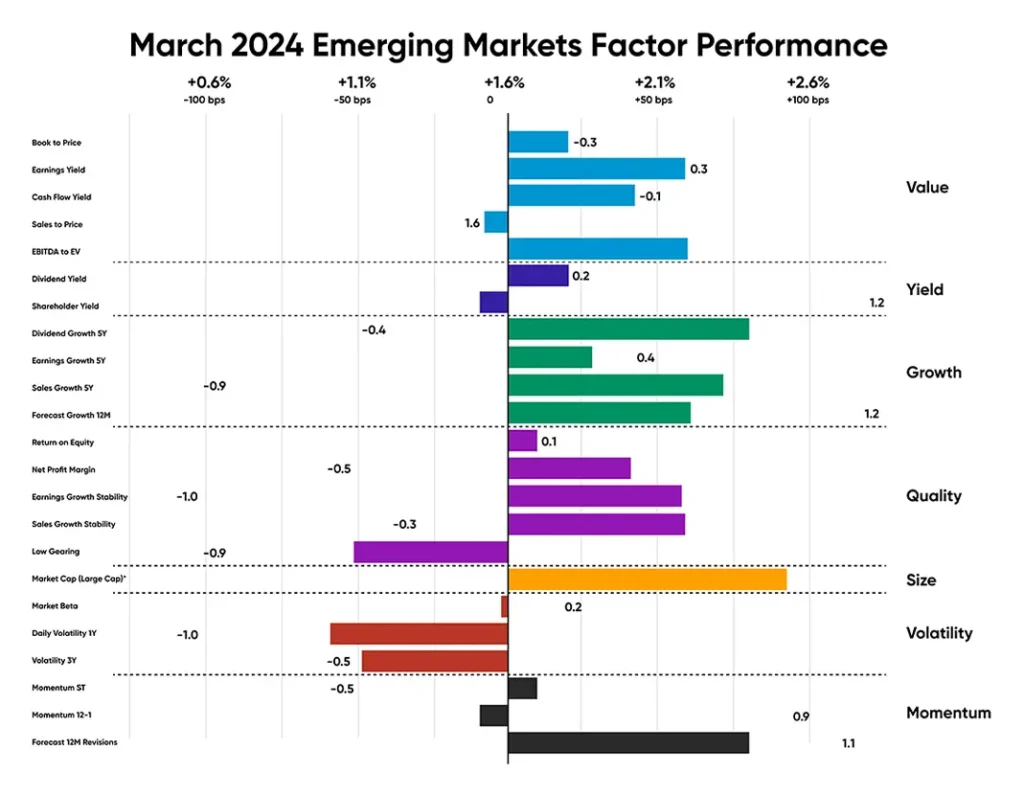
Source: Investment Metrics, a Confluence company
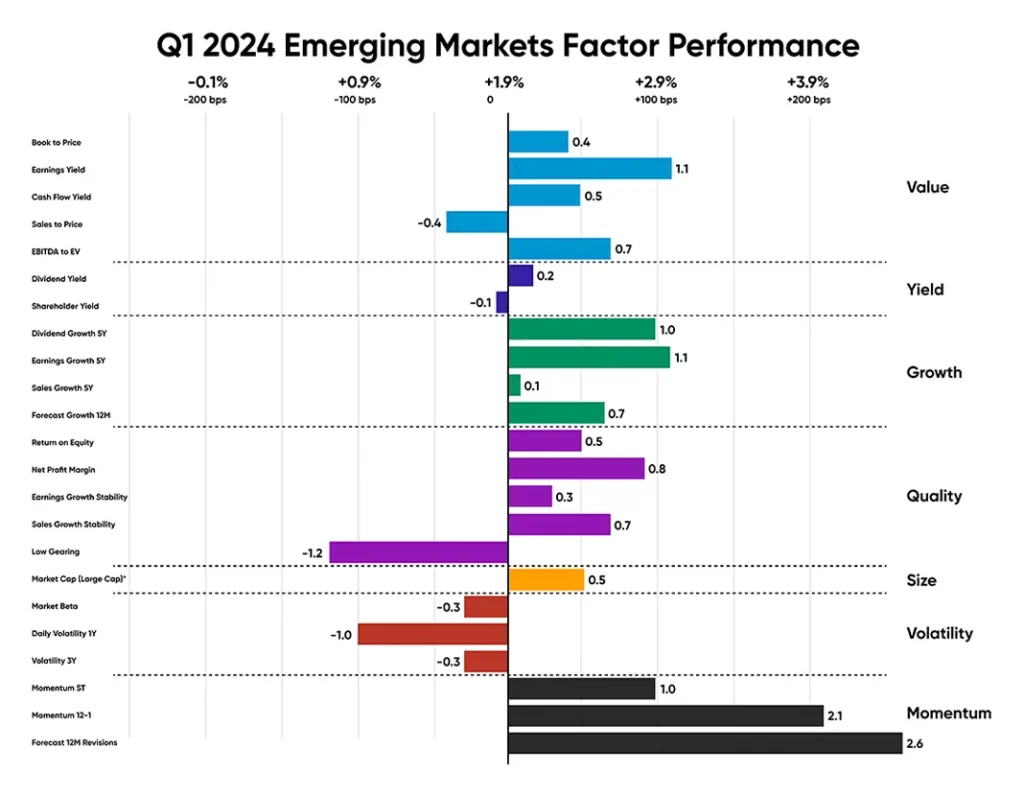
Source: Investment Metrics, a Confluence company
Canadian equities
In Q1, Canadian investors preferred volatile equity with strong cash flow yield and sales growth, both of which outperformed by 100bps in March and by 200bps in the quarter. Value, Growth, and Quality (except for stability-focused Quality subfactors) offered notable factor premiums in the quarter, especially stocks with a high EBITDA-EV ratio.
Like its American neighbors, inflation remained stubbornly sticky in Canada, hovering above 3% all of Q4 before dipping down to 2.8% in February, falling just behind Europe when it comes to reaching the long-term 2% target. Consumer spending has also maintained its pace from Q3 and Q4 2023, However, unemployment reached 6.1% in March, and manufacturing has contracted for the 11th consecutive month, albeit at the slowest rate in the past year.
The value stocks with a high EBITDA-to-EV ratio that led Canadian markets in Q1 mainly include companies in Energy (Suncor Energy Inc., +16% in Q1; Cenovus Energy, +20% in Q1; Imperial Oil, +21% in Q1), Financials (Fairfax Financial Holdings, +18% in Q1; Nuvei Corp., +20% in Q1), as well as tech firm Celestica Inc. (+52% in Q1) and healthcare company Green Thumb Industries (+30% in Q1).
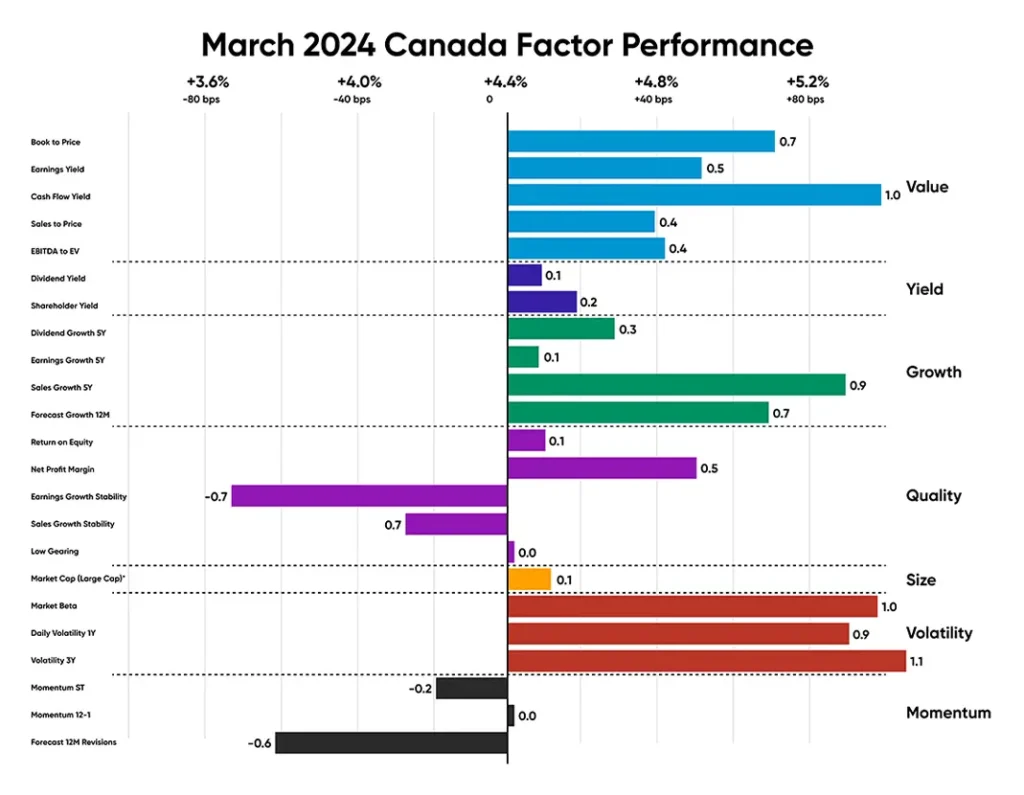
Source: Investment Metrics, a Confluence company
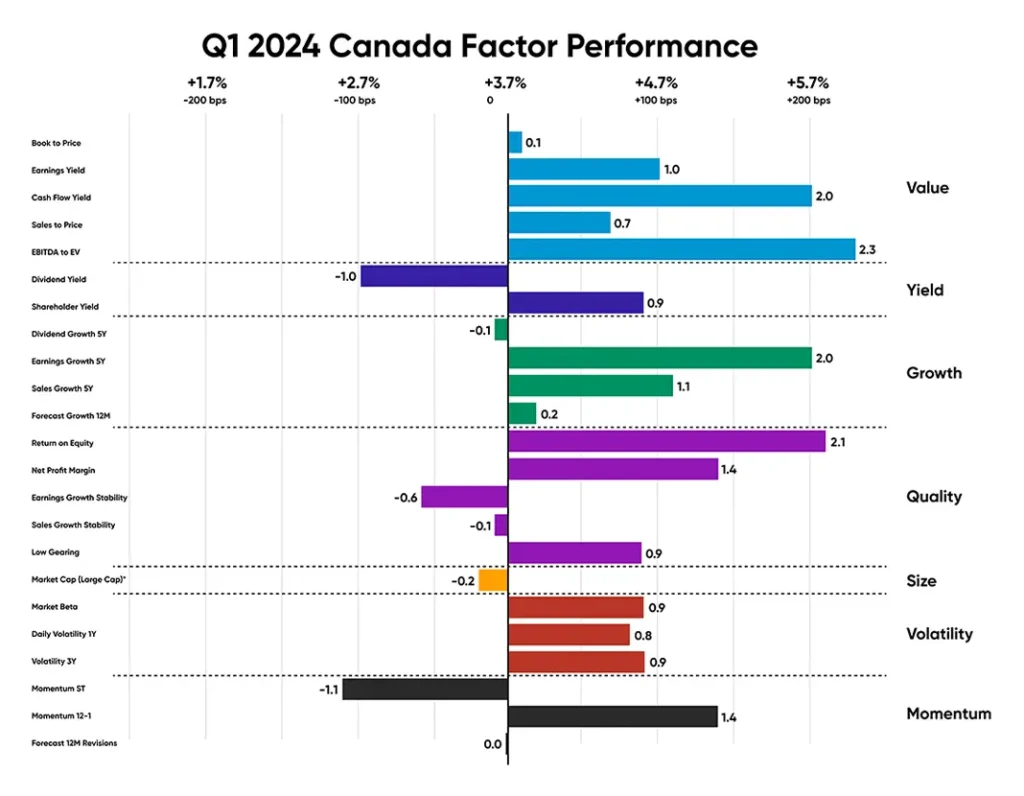
Source: Investment Metrics, a Confluence company
Disclaimer
The content provided by Confluence Technologies, Inc. is for general informational purposes only and does not constitute legal, regulatory, financial, investment, or other professional advice. It should not be relied upon as a substitute for specific advice tailored to particular circumstances. Recipients should seek guidance from appropriately qualified professionals before making any decisions based on this content.
Unless otherwise stated, Confluence Technologies, Inc. (or the relevant group entity) owns the copyright and all related intellectual property rights in this material, including but not limited to database rights, trademarks, registered trademarks, service marks, and logos.
No part of this content may be adapted, modified, reproduced, republished, uploaded, posted, broadcast, or transmitted to third parties for commercial purposes without prior written consent.
About Confluence® Technologies
Confluence is a global leader in enterprise data and software solutions for regulatory, analytics, and investor communications. Our best-of-breed solutions make it easy and fast to create, share, and operationalize mission-critical reporting and actionable insights essential to the investment management industry. Trusted for over 30 years by the largest asset service providers, asset managers, asset owners, and investment consultants worldwide, our global team of regulatory and analytics experts delivers forward-looking innovations and market-leading solutions, adding efficiency, speed, and accuracy to everything we do. Headquartered in Pittsburgh, PA, with 700+ employees across North America, the United Kingdom, Europe, South Africa, and Australia, Confluence services over 1,000 clients in more than 40 countries. For more information, visit www.confluence.com.