
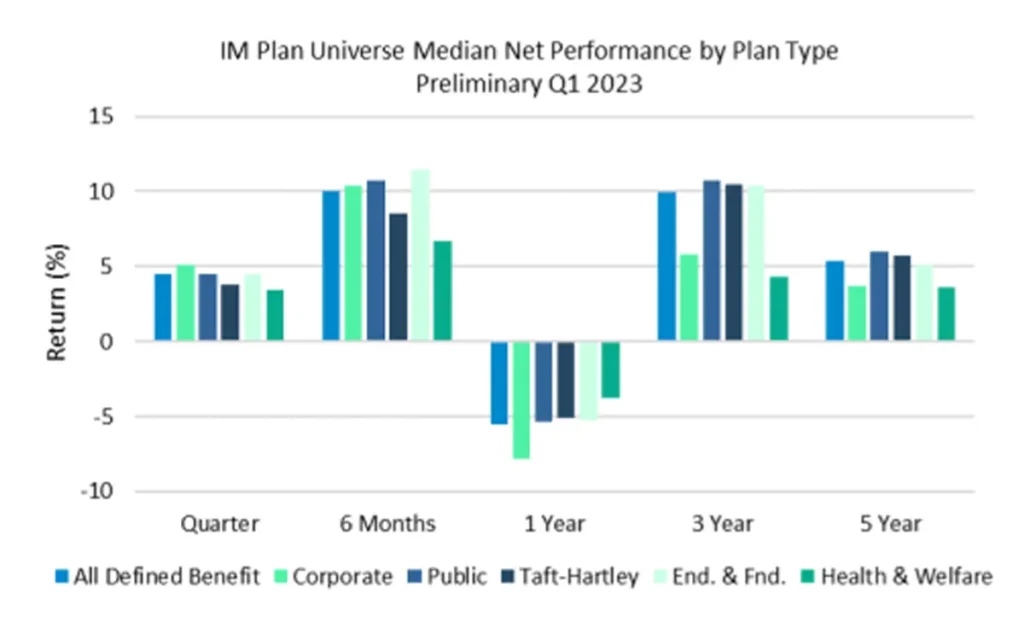
Defined Benefit plans in the Investment Metrics Plan Sponsor Universes posted a median net return of 4.47% for the first quarter of 2023. Plan performance rebounded over the last two quarters with a median return of 10.07%, after three consecutive negative quarters to start the calendar year in 2022. For the quarter, corporate plans posted the strongest performance with a median return of 5.14%, though their one year returns still lagged behind other plan types by at least 2%. Endowment & Foundations had the strongest performance over the previous two quarters with a median return of 11.43%.
Source: Investment Metrics, a Confluence company
All Defined Benefit: 749, Corporate: 163, Public: 271, Taft-Hartley: 202, End. & Fnd: 685, Health & Welfare: 184
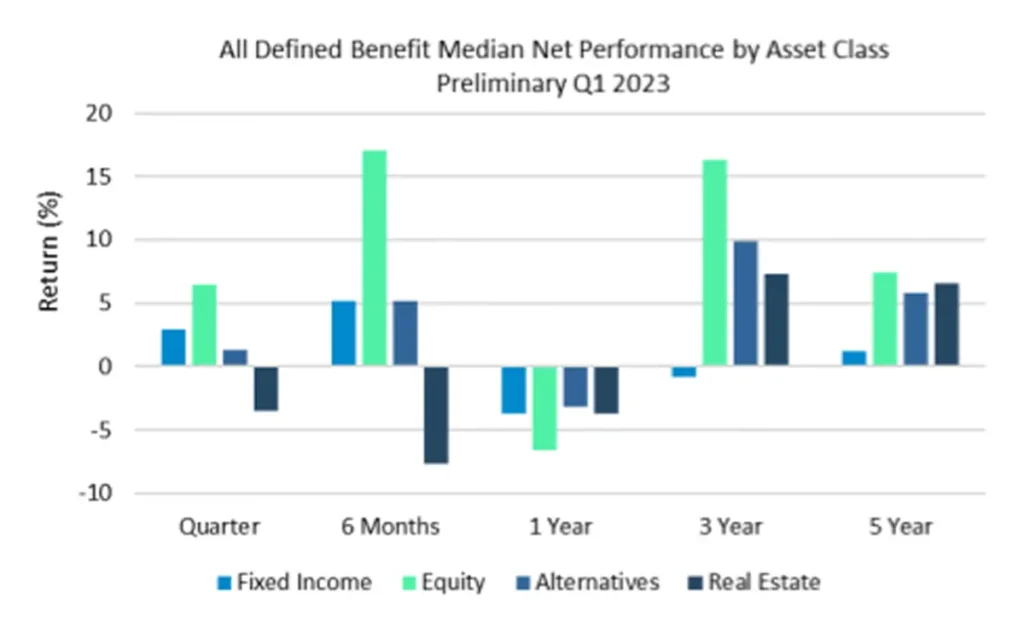
The strong results in the first quarter of 2023 were driven by positive performance across equity, fixed income, and alternatives, which returned 6.47%, 2.93% and 1.31% at a median level respectively. Real estate, however, was negative for the quarter with a median return of -3.54%. Over the last two quarters, real estate was the only negative performing major asset class with a median return of -7.69%. Higher interest rates and a decreasing demand for office spaces have played a role in the poor performance over this time.
Source: Investment Metrics, a Confluence company
Investment Metrics Plan Universe
Investment Metrics Plan Universe is the industry’s most granular analytics tool for plan sponsors including standard and custom peer group comparisons of performance, risk, and asset allocations by plan type and size. The data is sourced directly from over 4,000 institutions using our reporting and analytics solutions including investment consultants, advisors, and asset owners. Plan Universe is updated quarterly and typically available on or near the following schedule: preliminary data available on the 14th business day after quarter end, a second cut on the 21st business day, and final cut on the 29th business day, the data includes 20+ years’ history on:
- Trust Funds, Corporates, Public Plans, Taft-Hartley, Endowments & Foundations, High Net Worth, Health & Welfare, and custom groups.
- Asset Allocations broken into equity (US, global, global ex-US), fixed income (US, global, and global ex-US), alternatives, real estate (public and private), multi-asset and cash. Emerging Markets allocations are available for equities and debt securities.
- Net and gross performances displayed by quartile with full percentiles via download.
- With all information aggregated by Plan Size.
Disclaimer
The content provided by Confluence Technologies, Inc. is for general informational purposes only and does not constitute legal, regulatory, financial, investment, or other professional advice. It should not be relied upon as a substitute for specific advice tailored to particular circumstances. Recipients should seek guidance from appropriately qualified professionals before making any decisions based on this content.
Unless otherwise stated, Confluence Technologies, Inc. (or the relevant group entity) owns the copyright and all related intellectual property rights in this material, including but not limited to database rights, trademarks, registered trademarks, service marks, and logos.
No part of this content may be adapted, modified, reproduced, republished, uploaded, posted, broadcast, or transmitted to third parties for commercial purposes without prior written consent.
Author

About Confluence® Technologies
Confluence is a global leader in enterprise data and software solutions for regulatory, analytics, and investor communications. Our best-of-breed solutions make it easy and fast to create, share, and operationalize mission-critical reporting and actionable insights essential to the investment management industry. Trusted for over 30 years by the largest asset service providers, asset managers, asset owners, and investment consultants worldwide, our global team of regulatory and analytics experts delivers forward-looking innovations and market-leading solutions, adding efficiency, speed, and accuracy to everything we do. Headquartered in Pittsburgh, PA, with 700+ employees across North America, the United Kingdom, Europe, South Africa, and Australia, Confluence services over 1,000 clients in more than 40 countries. For more information, visit www.confluence.com.