
July 2024 Factor Performance Analysis
Market background
After reaching new highs early on, global stocks gave back some of their monthly gains in the second half of July. The US market favored Value and Yield, while Europe saw outperformance in Growth and Size. The UK market mirrored the US, demonstrating outperformance In Value and Yield. Emerging Markets were led by Value, Yield and Size. Canada exhibited a contrasting trend compared with its peers, with a notably larger factor premium for Quality and Momentum.
Crude oil dropped to $74/barrel on Aug 2nd after peaking to easing to $81/barrel in early July, the month-end price in July was $74/barrel akin to the previous month-end close.
Gold prices continued to surge in July, peaking to $2,316/ troy ounce at month-end. Crypto became a more prominent topic in the U.S. presidential election debate, despite mixed price performance in July 2024, the crypto industry made significant strides with the introduction of spot Ethereum exchange-traded products (ETPs).
Factor summary
- US Equities: Value and Yield outperformed
- Europe: Growth and Size outperformed
- UK: Value, Yield and Size outperformed
- Emerging Markets: Value, Yield and Quality outperformed
- Canada: Quality and Momentum outperformed
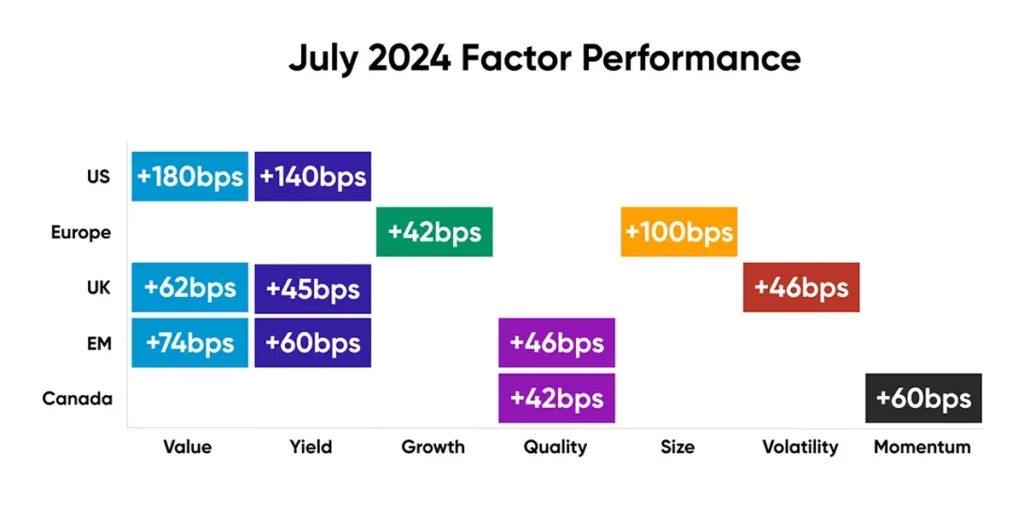
Source: Confluence Style Analytics
US equities
The first half of July sustained the gains of 2024, with S&P 500 rising to 3.79% for the month and 18.90% year-to-date by mid-July. The index then fell by 4.72%, before rebounding on the final day, finishing the month with a positive return of 2.0%. Value subfactors particularly, earnings yield and cashflow yield, outperformed this month by approximately 180 bps, and Yield subfactors closely followed outperforming by 140 bps. The surge was primarily driven by the concentration of large tech stocks, which make up significant portions of the indices.
The U.S. economy faced an unexpected setback in July, with a sharp decline in hiring and the unemployment rate increasing for the fourth consecutive month, intensifying concerns that the labour market was weakening, potentially leaving the economy vulnerable to a recession.
Stocks with steady earnings yield which contributed to the performance of US in July include the tech giants Apple (6% in July), and Meta Platforms (1.2% in July). Additionally, companies with high shareholder yield including industrials company General Electric (+7% in July) also contributed to the outperformance.
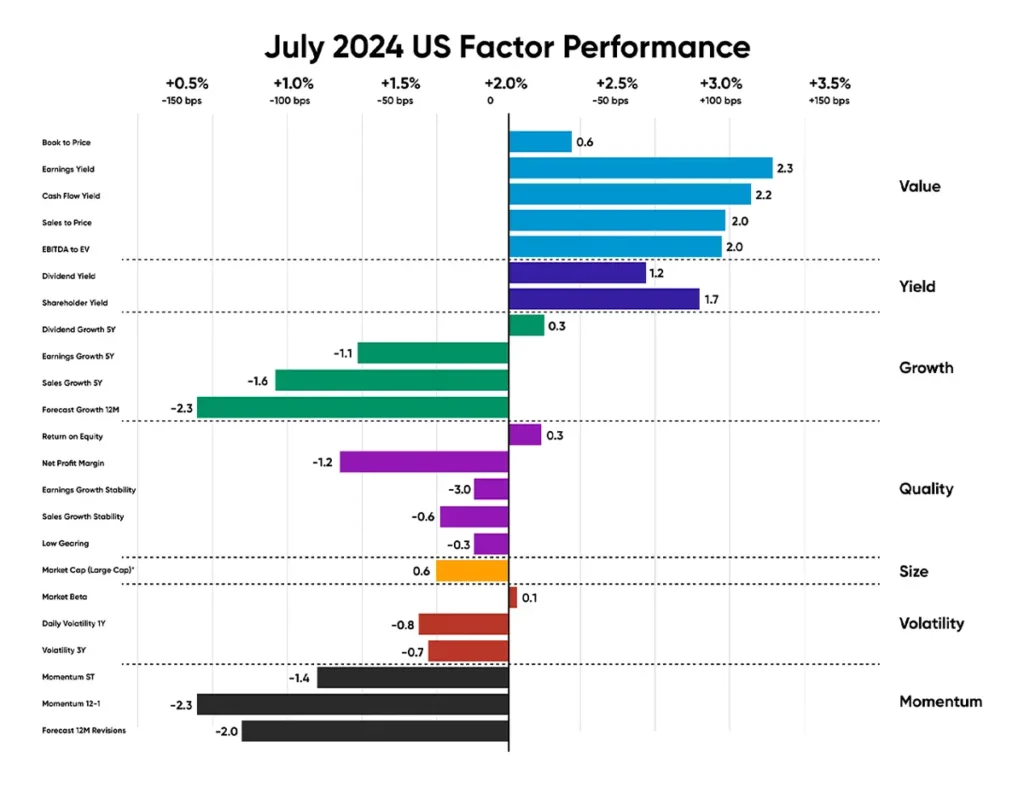
Source: Confluence Style Analytics
European equities
In Europe, Growth stocks continued to outperform by 42 bps, extending the trend from the previous quarter with Size factor outperforming the market by 100 bps.
A positive trend was noted in Growth subfactors, particularly in sales growth over 5 Years and earnings growth over 5 Years. Both subfactors outperformed the market by 50 bps.
Euro zone displayed a largely stable economic sentiment in July, with service sector production rebounding to a new record high while industrial production declining. The Eurozone unemployment report remained unchanged from the previous month, while the Headline inflation in the euro zone unexpectedly rose to 2.6% in July.
Key drivers of high-Value European stocks with positive market beta in the month of July include comm services company Spotify (+11% in July), financials company Unicredit SPA (+10% in July), and utilities company Enel (+6% in July).
Companies with large market cap that contributed to the outperformance of Euro Zone include Italian financials company Intesa (+9% in July), and French healthcare company Sanofi (+7% in July).
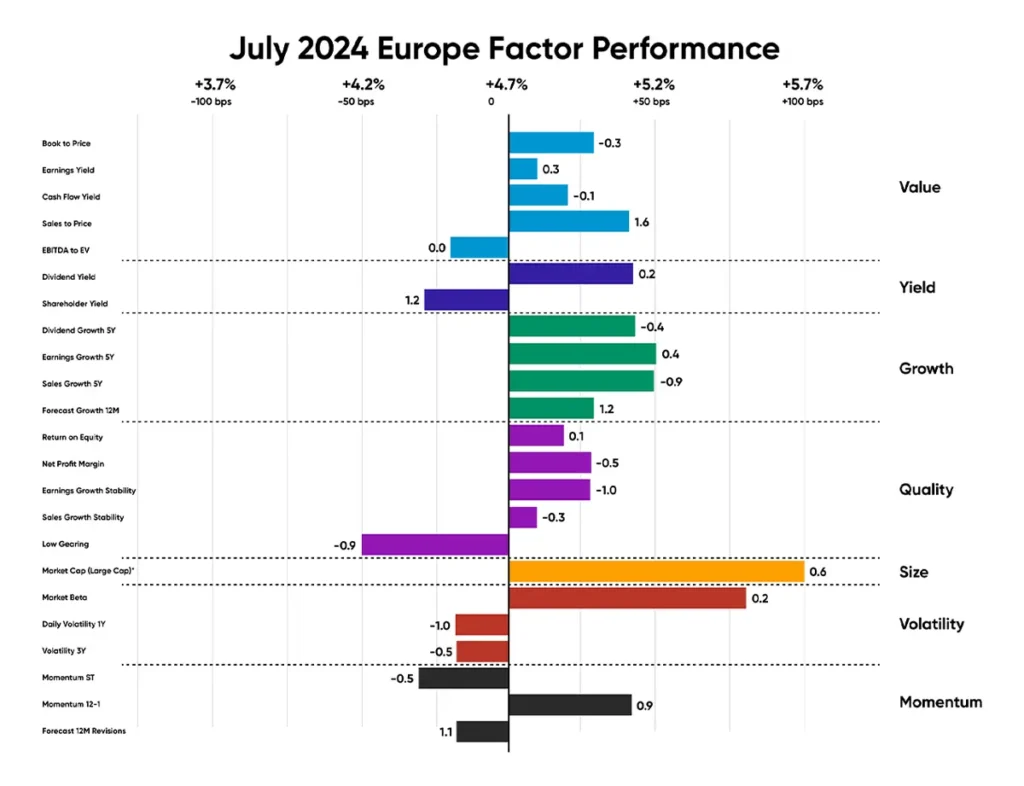
Source: Confluence Style Analytics
UK equities
UK Smaller Companies had a strong month, as low valuations and expectations of interest rate cuts lifted sentiment. July showed a distinct preference for Value, Yield and Volatility stocks. Although most quality subfactors outperformed the market, stocks with high net profit margins underperformed in July.
Despite the UK’s purchasing managers index (PMI) reaching a two-month high due to growth in new business, uncertainty persists regarding the BoE’s decision. This month’s labor market figures indicate a continued gradual cooling, with the number of vacancies declining and unemployment increasing.
British stocks with a strong Market Beta that outperformed this month include financials company Barclays (+14% in July); consumer staples company Haleon PLc (+10% in July), healthcare company Samith and Nephew PLC (+16% in July.)
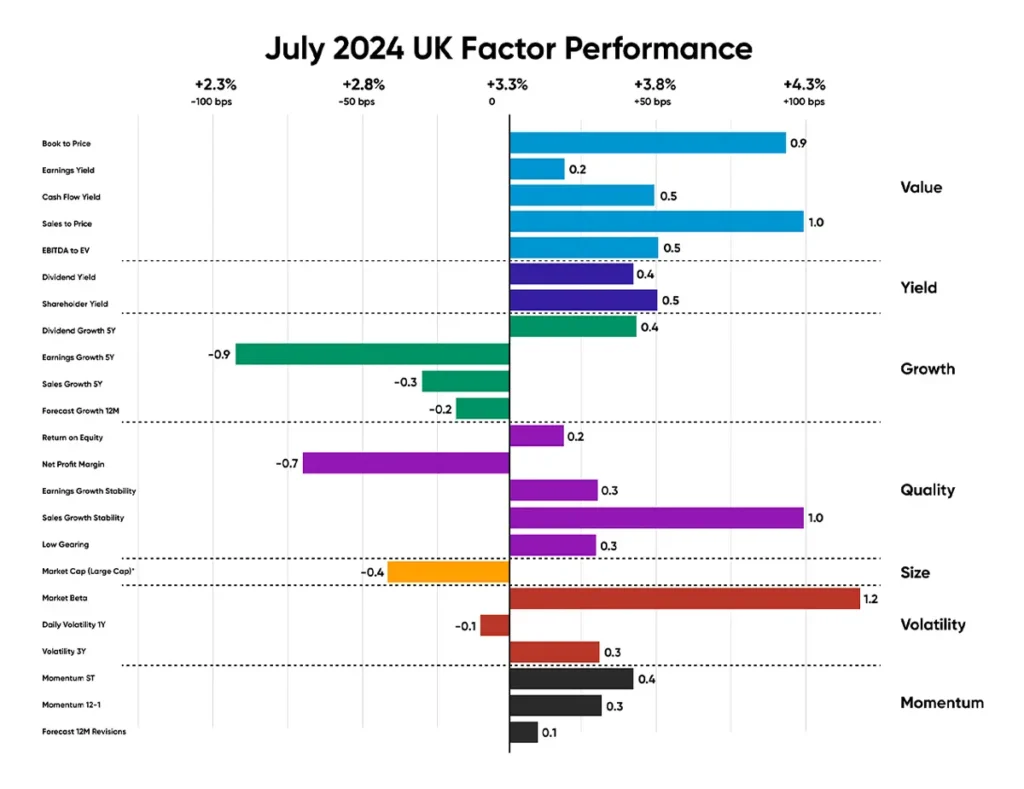
Source: Confluence Style Analytics
Emerging market equities
In July, the factor trend in Emerging Markets remained consistent with the trends observed in US and UK, with Value stocks generating active returns against the market, outperforming approximately 74 bps. Additionally, Quality observed a modest outperformance of 46 bps.
In emerging markets, recent policy divergences underscore the need to manage the risks associated with currency and capital flow volatility, as many central banks in these economies remain cautious about lowering rates.
Emerging Markets equities that outperformed in the month of July, captured by the cashflow yield subfactor, include a Chinese Consumer Discretionary company Alibaba Group Holding (+10.0% in July), Chinese financials company China Construction Bank Corp (+8.5% in July), Chinese financials company Industrial and Commercial Bank of China (+8.5% in July).
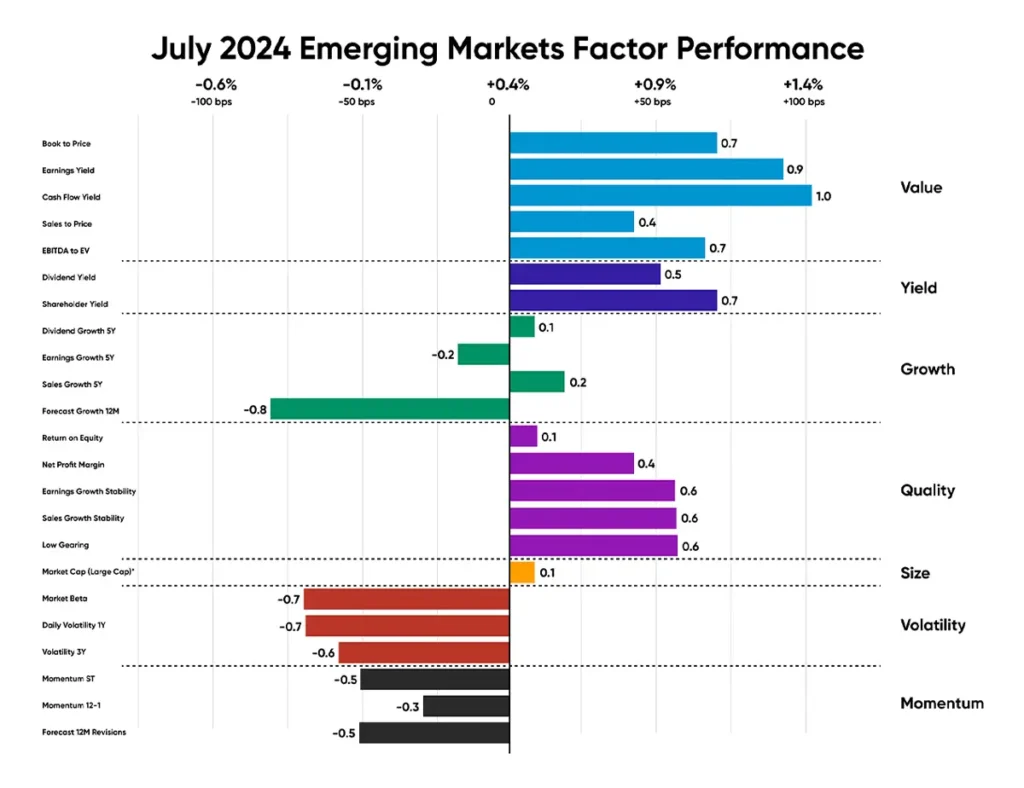
Source: Confluence Style Analytics
Canadian equities
The factor performance trend was more mixed in Canada, with neither Value nor Growth delivering significant premiums. Quality and Momentum led the market, outperforming by 42 bps and 60 bps respectively.
Unlike June, Canada saw a significant trend in Quality subfactors this month, with most subfactors outperforming the market, except for low gearing.
For the second consecutive month, Canadian employment remained largely unchanged, falling short of expectations. The unemployment rate held steady at 6.4%, as a slight decrease in the labor force offset job losses. This reduction in the labour force occurred despite ongoing population growth.
Stocks in Canada that outperformed with a strong sales-to-price include companies like consumer staples company Loblaw Companies Ltd (+6% in July), info tech company Constellation Software Inc. (+9% in July), and financials company Canadian Imperial Bank of Commerce (+9% in July).
Key companies driving the earnings growth performance in July were financials company Brookfield Corp (+17% in July), and materials company Agnico Eagle Mines Ltd (+18% in July).
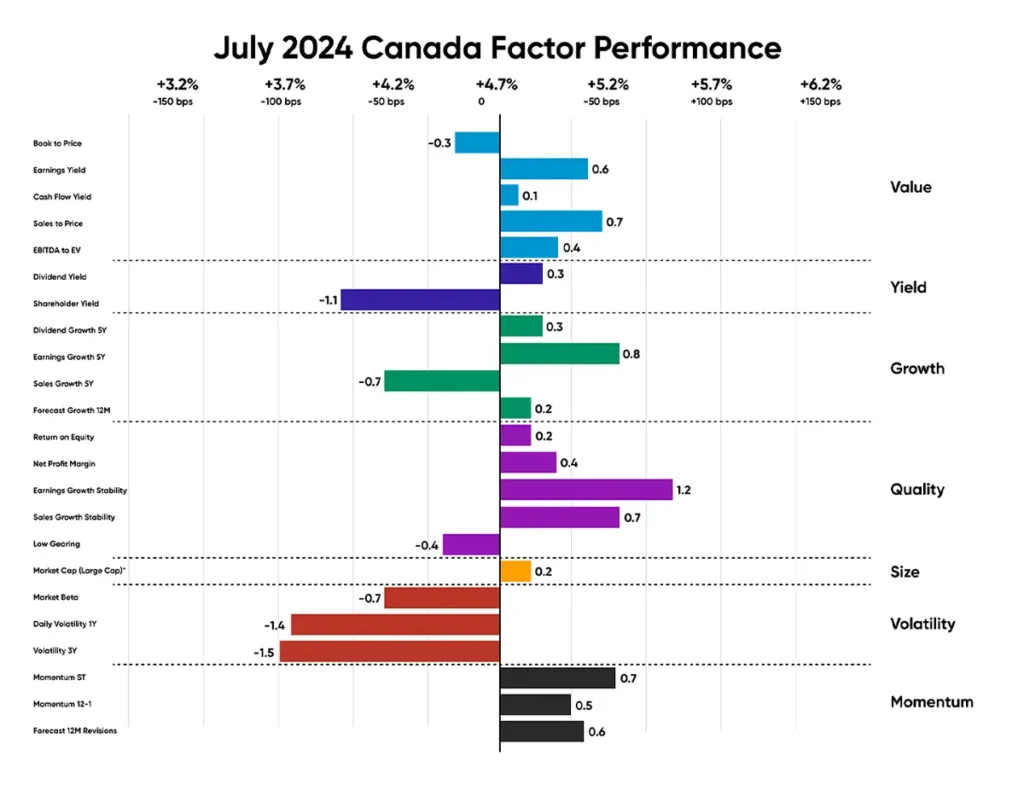
Source: Confluence Style Analytics
Appendix: How to read the charts
Each factor’s performance is based on the relative performance of its top 50% of stocks by market cap, compared to the overall market. The Size factor uses the top 70% of stocks, as the only exception.
For example, for the book-to-price factor, we determine the period’s performance of the basket of stocks with the highest book-to-price values, relative to the total market. Each factor is analyzed independently, market and fundamental data are adjusted to enable sector-average (within each country) relative data to be used, and the performance measurement isolates the factor’s contribution to return.
Disclaimer
The content provided by Confluence Technologies, Inc. is for general informational purposes only and does not constitute legal, regulatory, financial, investment, or other professional advice. It should not be relied upon as a substitute for specific advice tailored to particular circumstances. Recipients should seek guidance from appropriately qualified professionals before making any decisions based on this content.
Unless otherwise stated, Confluence Technologies, Inc. (or the relevant group entity) owns the copyright and all related intellectual property rights in this material, including but not limited to database rights, trademarks, registered trademarks, service marks, and logos.
No part of this content may be adapted, modified, reproduced, republished, uploaded, posted, broadcast, or transmitted to third parties for commercial purposes without prior written consent.
Author

About Confluence® Technologies
Confluence is a global leader in enterprise data and software solutions for regulatory, analytics, and investor communications. Our best-of-breed solutions make it easy and fast to create, share, and operationalize mission-critical reporting and actionable insights essential to the investment management industry. Trusted for over 30 years by the largest asset service providers, asset managers, asset owners, and investment consultants worldwide, our global team of regulatory and analytics experts delivers forward-looking innovations and market-leading solutions, adding efficiency, speed, and accuracy to everything we do. Headquartered in Pittsburgh, PA, with 700+ employees across North America, the United Kingdom, Europe, South Africa, and Australia, Confluence services over 1,000 clients in more than 40 countries. For more information, visit www.confluence.com.