

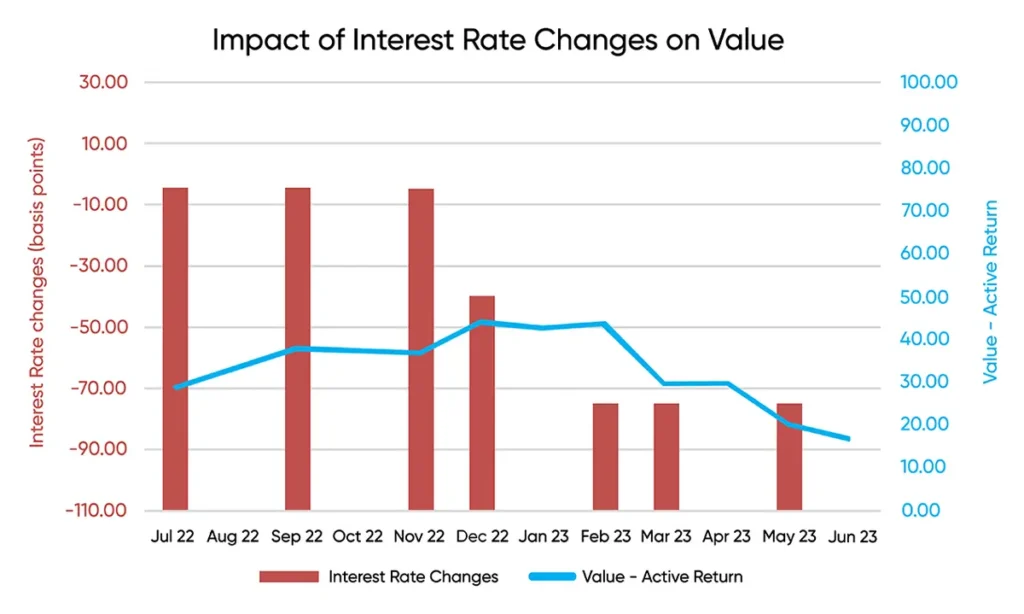
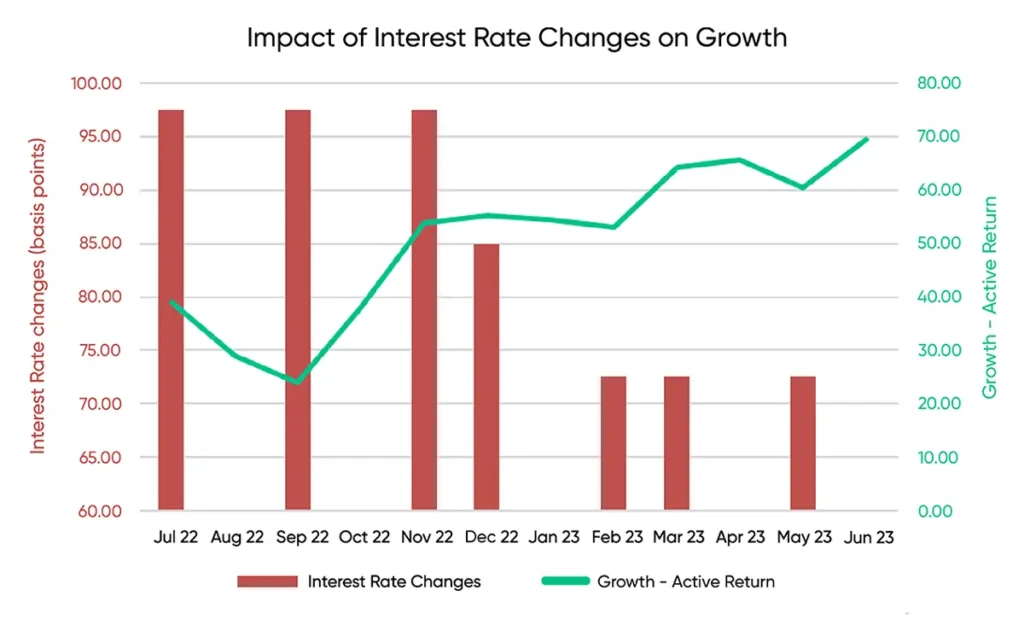
The macroeconomic backdrop holds a paramount influence on driving growth and value factor performances. Among these, interest rates have had the most profound effect, as shown in the charts below. Changes in interest rates from 2022 to 2023 have predominantly guided the returns of Large Cap Growth and Large Cap Value portfolios:
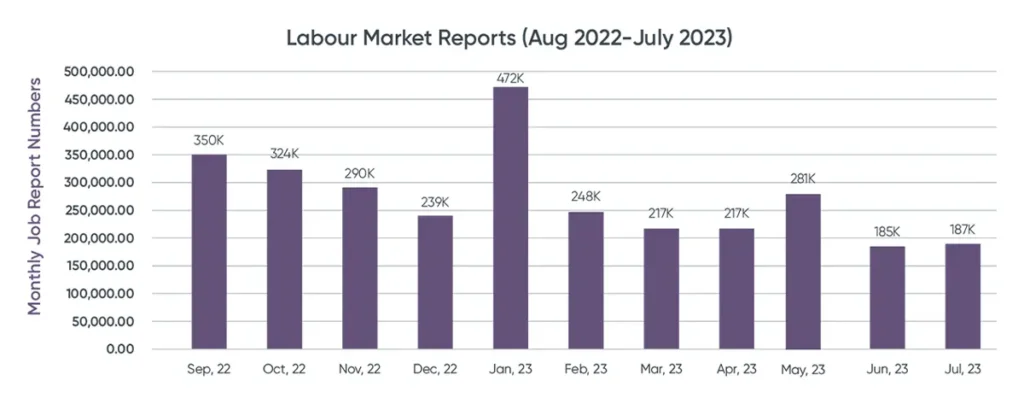
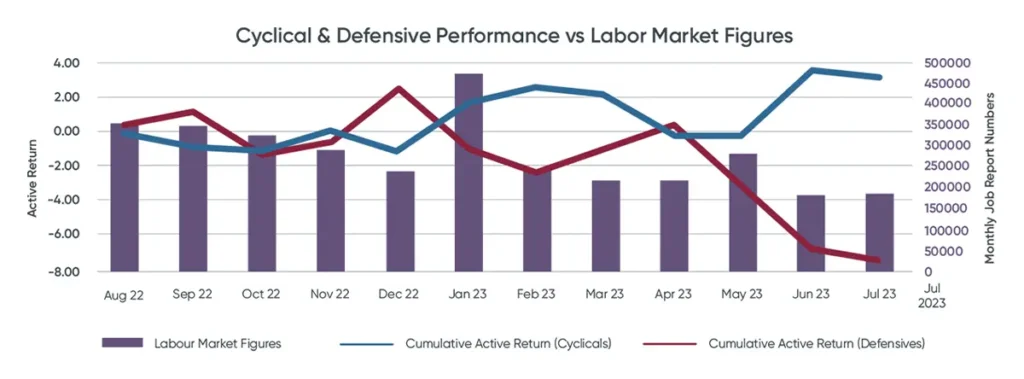
Job reports are one of the crucial indicators impacting interest rates. Job reports, often referred to as labor market reports, are critical in shaping the overall economic landscape of a country. Released by the Bureau of Labor Statistics, nonfarm payroll reports are closely watched by investors and economists. Positive job reports frequently contribute to higher interest rates in anticipation of positive economic expansion, international cashflows, and inflationary pressure.
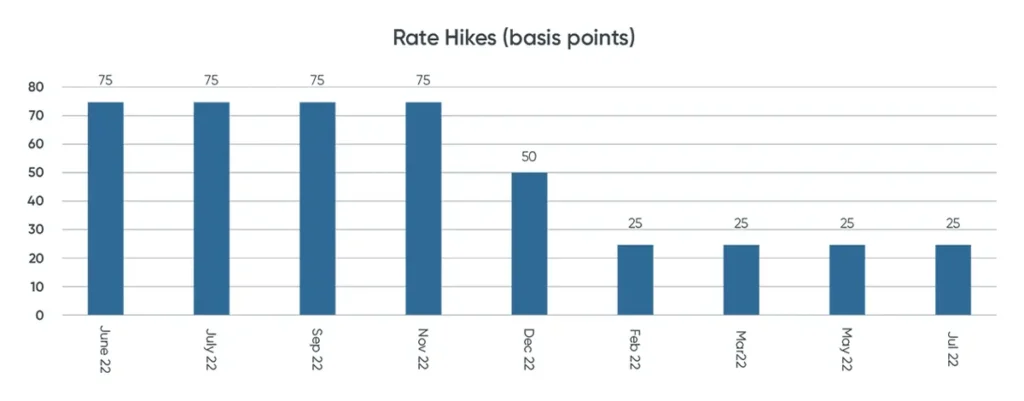
In July, the U.S. nonfarm payrolls rose to 187,000, impacting the unemployment rate to drop from 3.6% to 3.5%, while the annual wage inflation held steady at 4.4%. Following the release of the May employment data, the Fed decided to hold the interest rates steady in June to assess the economy’s progress. After the release of the July data, a 25-basis point increase was announced.
Labor market reports and fed rate hikes (2022 – 2023)
Cyclical sectors, which include consumer discretionary, industrials, and materials, are more sensitive to economic conditions than defensives. As high-interest rates indicate increased borrowing costs for businesses, this results in a slowdown in demand in the cyclical sectors. Consequently, this leads to decreased earnings and stock performance.
On the other hand, defensive sectors such as utilities, consumer staples, healthcare, and communication rely on stable earnings and dividends to attract investors. Defensive sectors, known for their bond proxy characteristics, tend to attract investors seeking stability. However, as the yield of fixed-income investments rises, investor preference eventually shifts from defensive stocks to Fixed Income investments, causing downward pressure on prices.
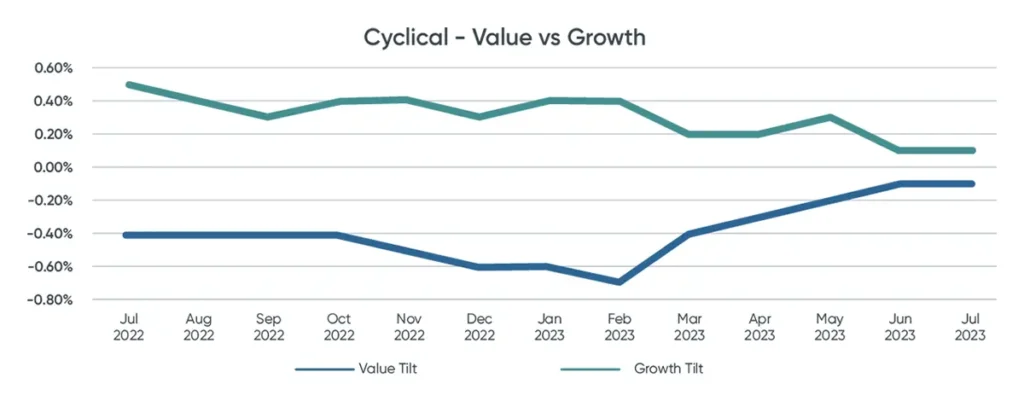
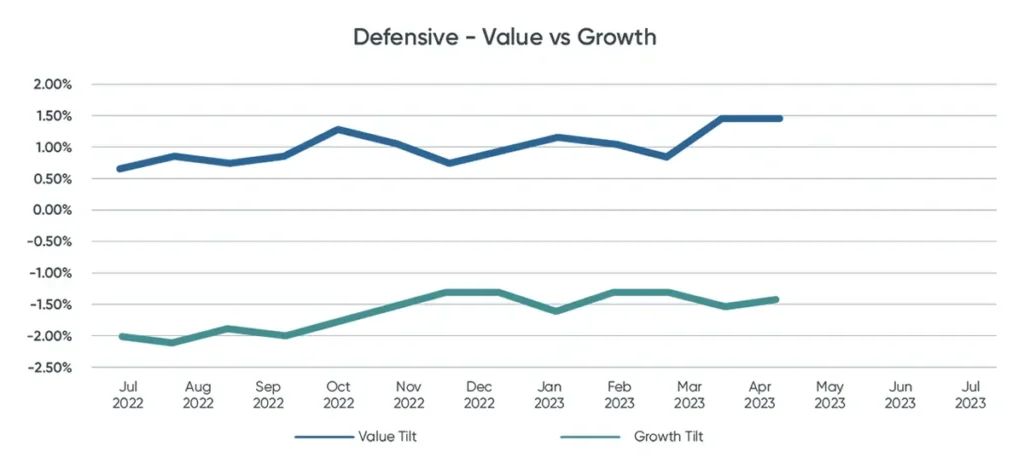
Using Style Analytics Portfolio Analyzer tool to generate a proxy portfolio for Cyclical / Defensive sectors, these proxies were analyzed against the S&P 500 to determine a factor exposure across time, the factors were then bucketed under Value and Growth labels to track modified Z-Scores over time.
The chart below indicates that cyclical sectors’ exposure to Value and Growth are much more sensitive to labor market reports than their defensive counterparts.
Cyclical sectors experienced pronounced fluctuations in both January and May, driven by the robust job report figures.
The below chart shows the performance of Cyclical vs defensive sectors in the changing interest rate environments. Following the May job reports data and the 25-basis point increase in interest rates, defensive sectors witnessed a significant increase in exposure to Value, leading to a decline in their overall performance:
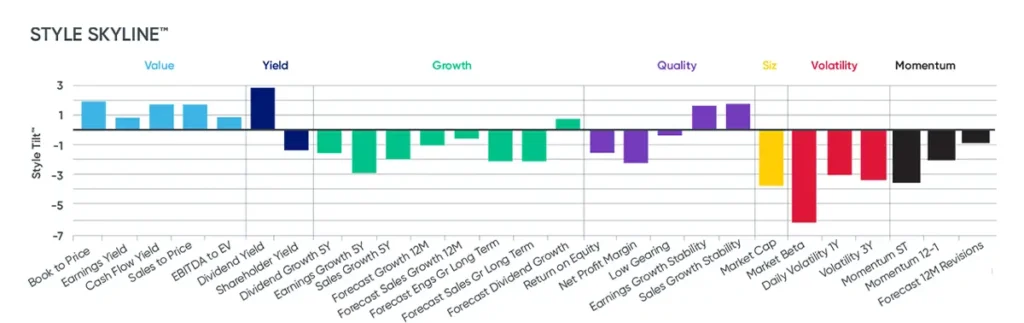
As the tilt Style Analytics skyline in the exhibits below indicate, the growth bias of Cyclical sectors and the value of defensives, the drop in performance of these sectors in the rising interest rate environment.
Or as illustrated by the tilt in the Style Analytics skyline presented below, the growth bias of Cyclical sectors juxtaposed with the value orientation of defensive sectors accentuates the decline in performance observed within these segments amid the backdrop of rising interest rates.
Or as shown in the tilt of the Style Analytics skyline below, the fact that Cyclical sectors focus more on growth and defensive sectors emphasize value highlights how these sectors have experienced a drop in performance interest rates went up.
Factor tilt skyline for cyclical sectors
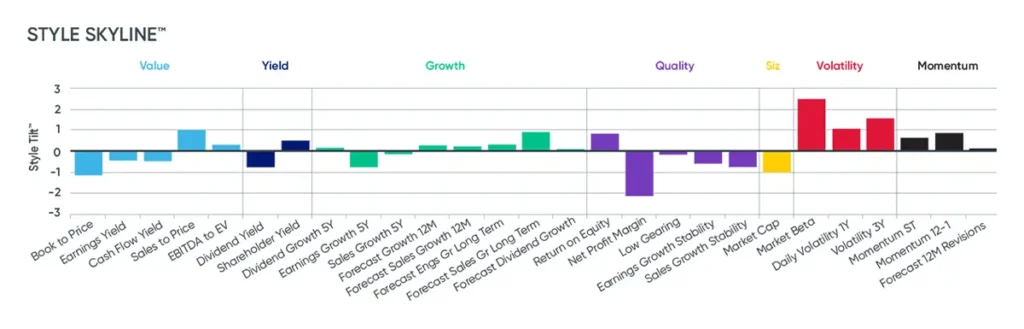
Factor tilt skyline for defensive sectors
The intricate relationship between economic indicators, interest rates, and sectoral performance underscores the dynamic nature of financial markets. The impact of job reports on interest rates is a testament to the interconnectedness of economic data and investor sentiment. As we’ve observed in recent months, positive job reports have contributed to the Federal Reserve’s decision to raise interest rates, setting off a chain reaction across cyclical and defensive sectors. Cyclical sectors, known for their sensitivity to economic conditions, experienced notable fluctuations in response to these shifts, while defensive sectors grappled with changing investor preferences amid rising fixed-income yields.
About the Style Analytics Portfolio Analyzer
The use of tools like Style Analytics Portfolio Analyzer has enabled a nuanced analysis of factor exposures, demonstrating the dynamics between Value and Growth within these sectors. As the financial landscape continues to evolve, platforms like Style Analytics are pivotal to navigating the complexity of changing interest rate environments and their multifaceted impacts on diverse market segments.
Disclaimer
The content provided by Confluence Technologies, Inc. is for general informational purposes only and does not constitute legal, regulatory, financial, investment, or other professional advice. It should not be relied upon as a substitute for specific advice tailored to particular circumstances. Recipients should seek guidance from appropriately qualified professionals before making any decisions based on this content.
Unless otherwise stated, Confluence Technologies, Inc. (or the relevant group entity) owns the copyright and all related intellectual property rights in this material, including but not limited to database rights, trademarks, registered trademarks, service marks, and logos.
No part of this content may be adapted, modified, reproduced, republished, uploaded, posted, broadcast, or transmitted to third parties for commercial purposes without prior written consent.
Author

About Confluence® Technologies
Confluence is a leading provider of specialist regulatory, analytics, and investor communication solutions for asset managers, asset servicers, investment consultants, and asset owners. Across performance, risk and peer analytics, regulatory filings and compliance monitoring, and shareholder reporting and document production, firms depend on Confluence for output they trust. We deliver this through deep domain expertise and purpose-built products developed over decades of research and engineering.
Confluence solutions are powered by Confluence POINT, AI-enabled automation that runs within and alongside Confluence’s trusted solutions. POINT optimizes inefficient workflows, delivering a meaningful impact on outcomes without requiring significant operational change.
Headquartered in Pittsburgh, PA, with 750+ employees in 15 offices across the United Kingdom, Europe, North America, South Africa, and Australia, Confluence services over 1,000 clients in more than 40 countries. For more information, visit www.confluence.com.
Confluence Media Contact:
Jon Schubin
Cognito