
April 2024 Factor Performance Analysis
Market background
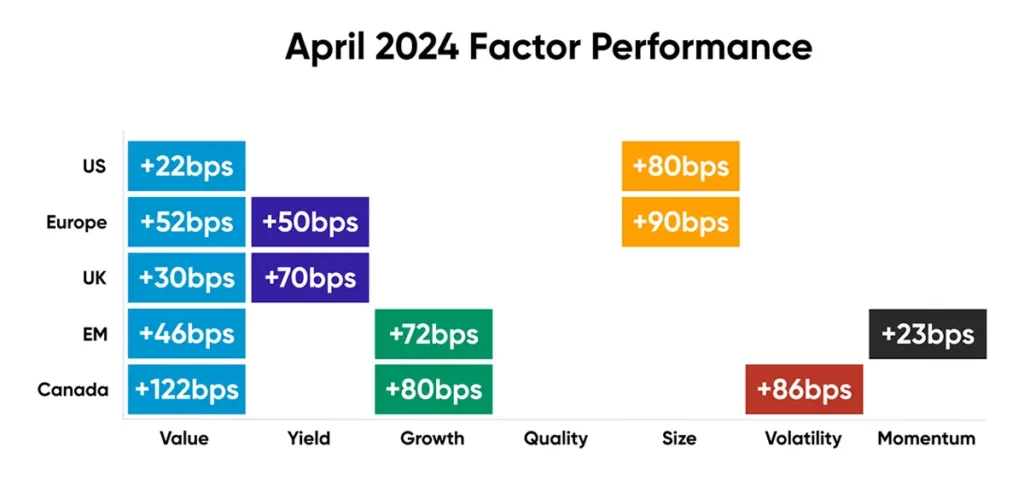
The equity markets witnessed a reversal in factor trends through April, with the Momentum surge ultimately ceasing. As shown in Figure 1 below, the trend in Developed World equity markets has transitioned from Momentum to Value.
Large-cap stocks outperformed in the United States and Europe. With the exception of Emerging Markets, stocks that previously outperformed across global equities underperformed their respective markets.
Following the sharp increase in crude oil prices throughout the first quarter of 2024, April saw a slight decrease from $83.17/barrel in March to $81.93/barrel. Gold prices saw a notable increase in April, rising from 2,214.35/ TOz in March to 2,333.55/TOz by April 1st.
Factor summary
Source: Investment Metrics, a Confluence company
- US Equities: Value and Size outperformed
- Europe: Value, Yield and Size outperformed
- UK: Value and Yield outperformed
- Emerging Markets: Growth and Value outperformed; Momentum slightly outperformed
- Canada: Value, Growth, and Volatility outperformed
US equities
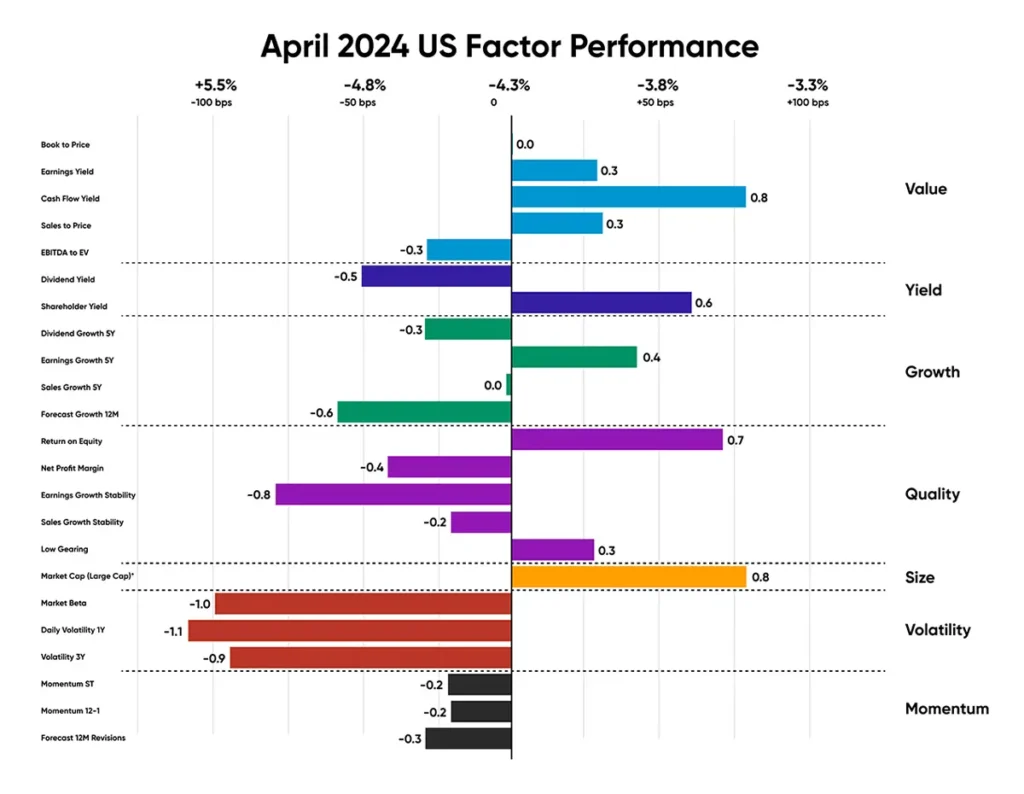
As higher-than-expected interest rates and faster-than-expected inflation dimmed hopes for interest rate cuts in the near term, the U.S. witnessed a dampening in equity returns through April. Following the robust Momentum surge in the U.S. equity markets in Q1 2024, April saw that trend crash, leading to an average underperformance of -23 basis points. The month-on-month returns saw a broadening trend of U.S. equities market from dominance of the Magnificent (Mag7) companies.
The performance was significantly driven by an outperformance of large cap stocks, while stocks with high Volatility saw a reversal from last month averaging an underperformance of 100bps. Except for high return on equity (ROE) companies, which returned to outperforming by +70 basis points, high-quality companies continued to contribute to the underperformance of the U.S. markets.
Although the US stock market was driven by Large Value companies in April, the Mag7 group still exerted significant influence, contributing to 51% of the index return. Notably, NVIDIA (up 74.5% year-to-date) alone represented 41% of the S&P 500’s year-to-date gain, plus stocks that underperformed in US ROE.
Source: Investment Metrics, a Confluence company.
European equities
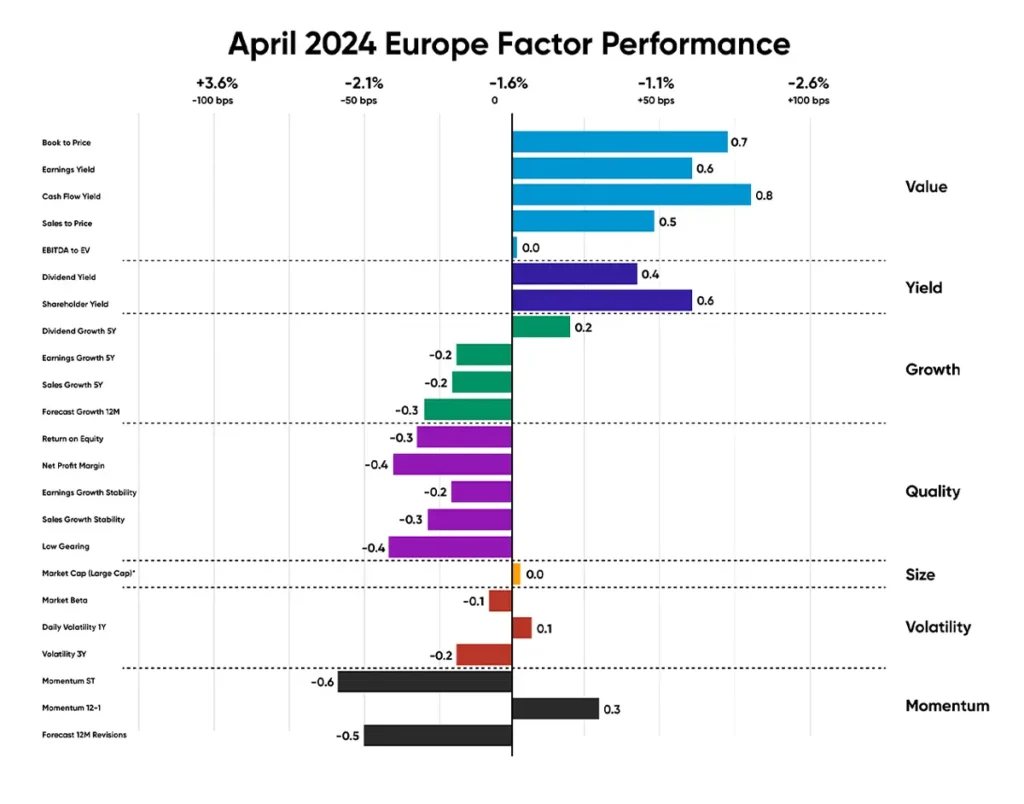
In April, Value stocks in Europe maintained their outperformance, continuing the trend noted in March. Yield also played a significant role in bolstering the market’s performance, resulting in an average outperformance of 50bps. Like the U.S., European equities experienced a decline in Momentum performance which indicated that the previous winners were no longer maintaining their streak as short-term momentum underperformed the market by 60bps. Growth stocks observed a reversal in trend, with all Growth sub-factors, except for dividend growth over 5Y, underperforming the market.
Eurozone inflation remained stable at 2.4% in April, aligning with the estimates. Core inflation, excluding energy, food, alcohol, and tobacco, stood at 2.7%.
Key drivers of outperformance in Europe included a Belgium healthcare company UCB SA and Co (+8.61% in April); Spanish bank Banco Santander (+24.33% in April); and German Industrials company Hapag-Lloyd AG (+22.25% in April).
Source: Investment Metrics, a Confluence company.
UK equities
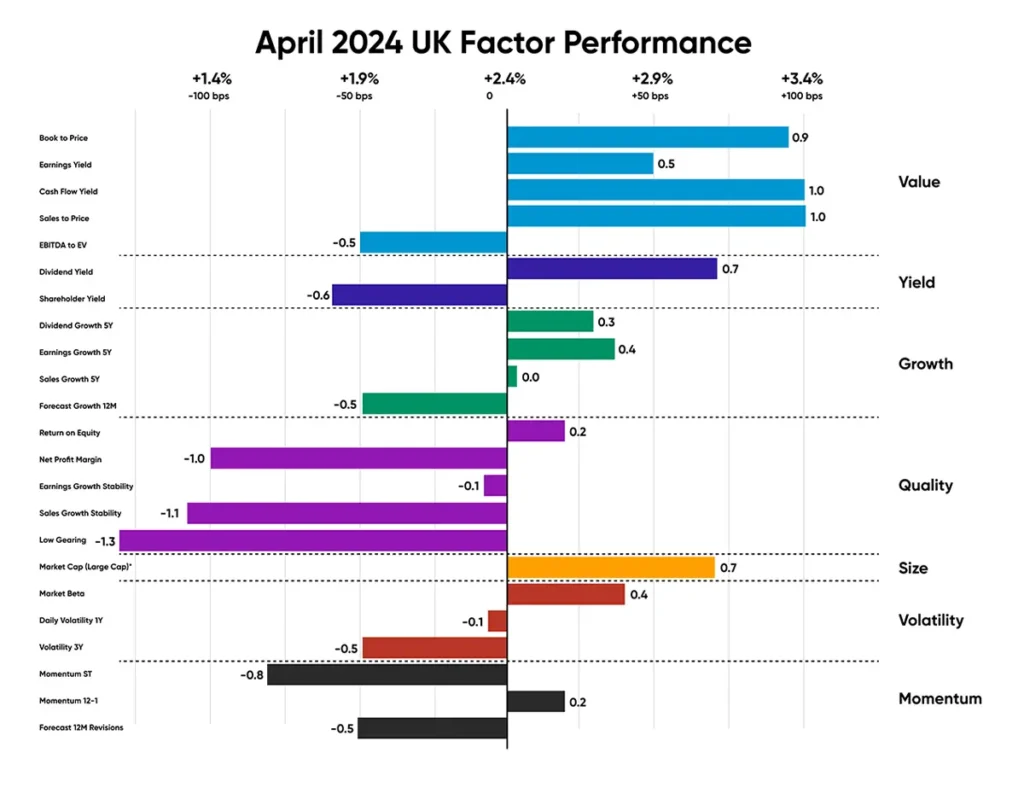
The UK market observed a preference for Value stocks, coupled with a downward trend in Quality and Momentum. The positive outperformance was partly attributed to a beneficial impact from stocks within the Healthcare sector, such as AstraZeneca (returning +11.97% in April), along with a resilient performance from Consumer Staples stocks.
From a Yield perspective, equity performance in the UK reflected mixed sentiment. Stocks with a high dividend yield outperformed by 70bps, while stocks with a significant shareholder’s yield countered by a -60bps underperformance. All Momentum subfactors suffered a significant setback as their constituents experienced an average underperformance of -30bps.
Some of the British financial companies that drove Value through April included financial company HSBC Group (11.39% in April), Natwest Group (13.31% in April), and Barclay’s PLC (9.67% in April).
Source: Investment Metrics, a Confluence company.
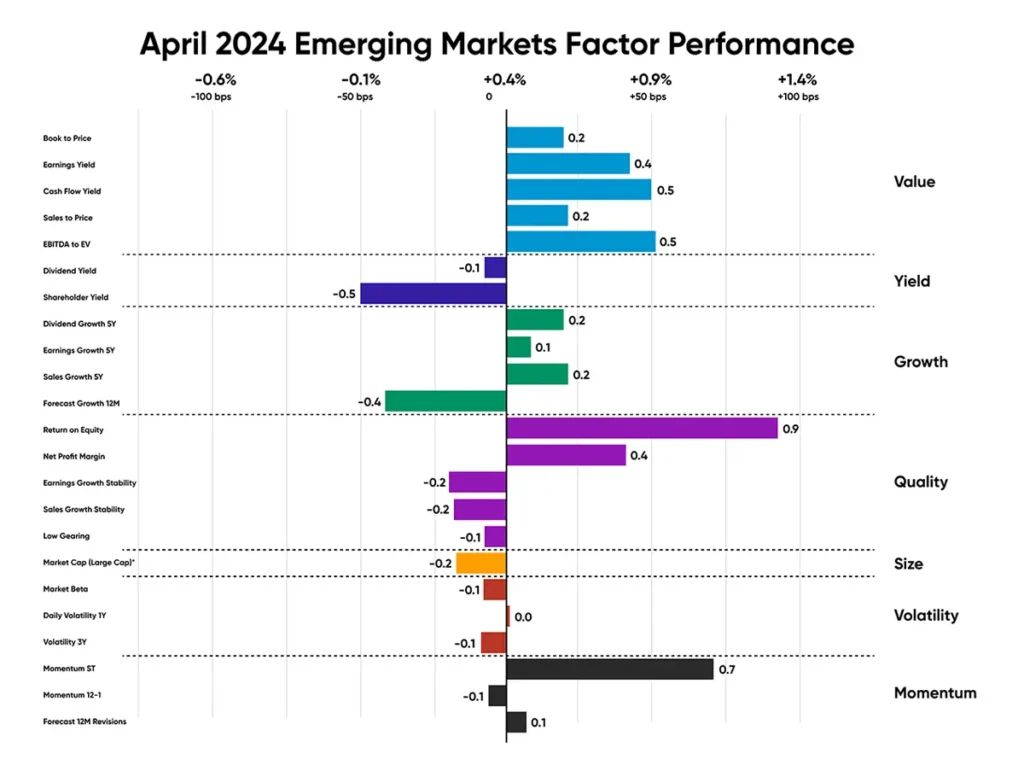
Emerging market equities
The observed shift in Emerging Markets reverted to favoring Value, in contrast to last month’s Value stock underperformance. With an average outperformance of 16bps, the trajectory for Quality subfactors also diverged from the previous month, indicating varied sentiments. This outperformance was significantly driven by the positive outperformance from ROE, while others, particularly “earnings growth stability,” “sales growth stability,” and “low gearing,” exhibited negative returns.
Stocks with high expected growth, as captured by the “Forecasted 12M Growth” Growth sub-factor, underperformed by approximately 50bps and contributed to the decline in performance for Emerging Markets in April.
The ROE contribution to Emerging Markets equities’ outperformance through April was significantly led by India and strongly influenced by Indian financial company Life Insurance Corp of India (+6.74% in April); Coal India Limited (+4.61% in April); Indian materials company Chandra Asri Pacific PT (+26.80% in April) and China Comm Service company Tencent Ltd (+14.36% in April).
Source: Investment Metrics, a Confluence company.
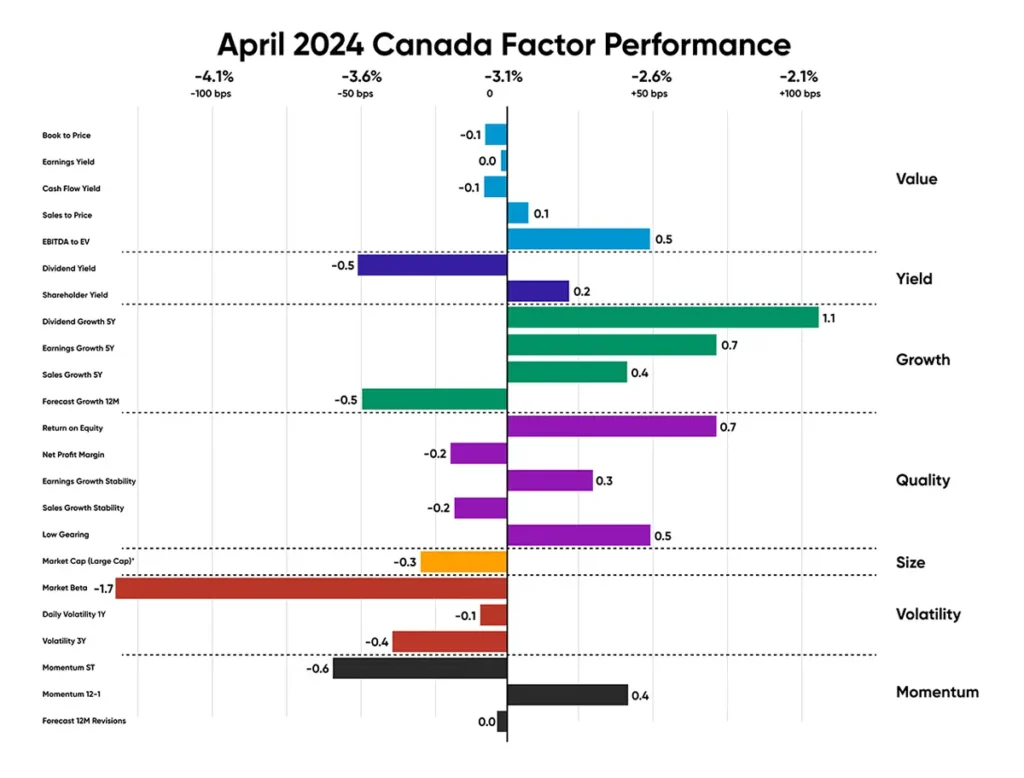
Canadian equities
In Canada, the factor performance trend was spearheaded by Growth. Companies with strong dividend growth over five years outperformed the market by 110bps, closely followed by stocks with a high earnings growth over 5Y, outperforming by 70bps.
A varied pattern emerged among Quality stocks this month, with high return on equity (ROE), stable earnings growth, and low gearing contributing to outperformance. Net profit margin and sales growth stability had a mitigating effect on these stocks. Similar to the US, UK, and Europe, Momentum experienced a significant decline in performance, with short-term momentum plunging to a -60bps performance compared to the market.
Canadian stocks with a high dividend growth over 5Y that drove the Growth outperformance included companies like Canadian industrial firm Agnico Eagle Mines (+6.2% in April), Dollarama Inc (+9.7% in April), Teck Resources Ltd (+7.6% in April).
Source: Investment Metrics, a Confluence company.
Disclaimer
The content provided by Confluence Technologies, Inc. is for general informational purposes only and does not constitute legal, regulatory, financial, investment, or other professional advice. It should not be relied upon as a substitute for specific advice tailored to particular circumstances. Recipients should seek guidance from appropriately qualified professionals before making any decisions based on this content.
Unless otherwise stated, Confluence Technologies, Inc. (or the relevant group entity) owns the copyright and all related intellectual property rights in this material, including but not limited to database rights, trademarks, registered trademarks, service marks, and logos.
No part of this content may be adapted, modified, reproduced, republished, uploaded, posted, broadcast, or transmitted to third parties for commercial purposes without prior written consent.
Author

About Confluence® Technologies
Confluence is a global leader in enterprise data and software solutions for regulatory, analytics, and investor communications. Our best-of-breed solutions make it easy and fast to create, share, and operationalize mission-critical reporting and actionable insights essential to the investment management industry. Trusted for over 30 years by the largest asset service providers, asset managers, asset owners, and investment consultants worldwide, our global team of regulatory and analytics experts delivers forward-looking innovations and market-leading solutions, adding efficiency, speed, and accuracy to everything we do. Headquartered in Pittsburgh, PA, with 700+ employees across North America, the United Kingdom, Europe, South Africa, and Australia, Confluence services over 1,000 clients in more than 40 countries. For more information, visit www.confluence.com.