
Q3 2023 Factor Performance Analysis
Market background
During the third quarter of 2023, global equity markets lost the momentum that had propelled markets earlier in the year as it grappled with substantial challenges including rising geopolitical tensions in Ukraine and Israel as well as continued inflationary pressures on the global economy. The MSCI ACWI, while still showing a year-to-date gain of over 10%, experienced a sharp decline in September, with a quarterly return dropping to -3.4%, a stark contrast to the robust performance in the initial two quarters.
From a factor perspective, global equity markets have shifted preferences. Initially, there was a strong inclination towards Volatility subfactors, especially high beta, in developed markets from Q1 to Q2. However, the focus now seems to be on Quality subfactors, indicating a more risk-averse approach from investors. Earlier in the year, it appeared that many managers were willing to embrace higher risks in volatile equities, which proved beneficial then but could have adverse consequences now. In Q3, all regions except the US exhibited a clear preference for Value equity over Growth equity.
One possible reason for Value’s underperformance in the US during Q3 may be the less aggressive interest rate hikes compared to what was observed in 2022. The Federal Reserve has taken multiple breaks from further rate hikes this year. However, this decision might also signal that high-interest rates are exerting a more pronounced impact on the economy compared to the beginning of the year.
Optimism in Q1 and Q2 waned during the third quarter as multiple metrics veered off course including the US inflation rate. The US labor market witnessed a decline in Q3, marking the lowest monthly new job increase since January 2021. Consumer confidence in the US and Germany decreased even when both saw an upward trend until July 2023.
Furthermore, the price of oil increased by 28% in the quarter, which had been between $70-$80/barrel all year and now has surged to $90/barrel. This will likely not improve in the near term given the recent conflict in Israel. Gold prices have decreased further to $1,848/TOz and Bitcoin, often seen as a risk-on asset, declined from its Q2 high of $30,480 to $27,000, marking an 11% decrease in Q3.
Factor summary
- US Equities: Volatility underperformed, large-cap Quality-Growth stocks outperformed in Q3
- Europe: Volatility underperformed, large-cap Value and Yield stocks outperformed in Q3
- UK: Quality outperformed in September, Value, and Yield outperformed in Q3
- Emerging Markets: Value outperformed, Growth underperformed in Q3
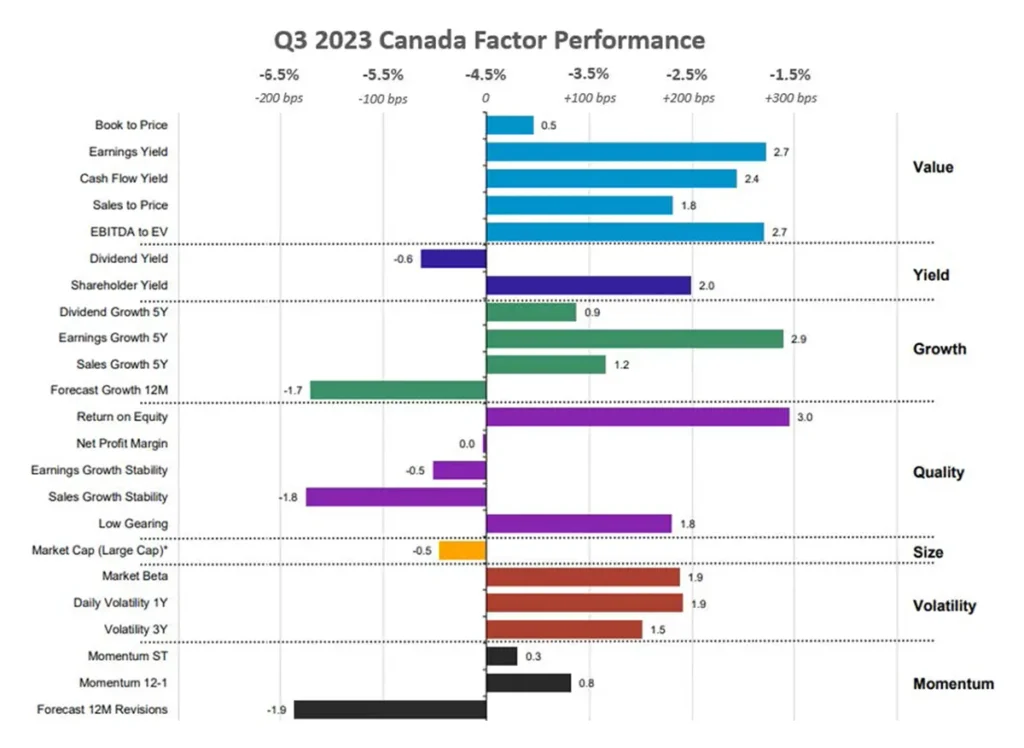
- Canada: Value and Quality stocks outperformed in Q3, mainly earnings yield and return on equity
US equities
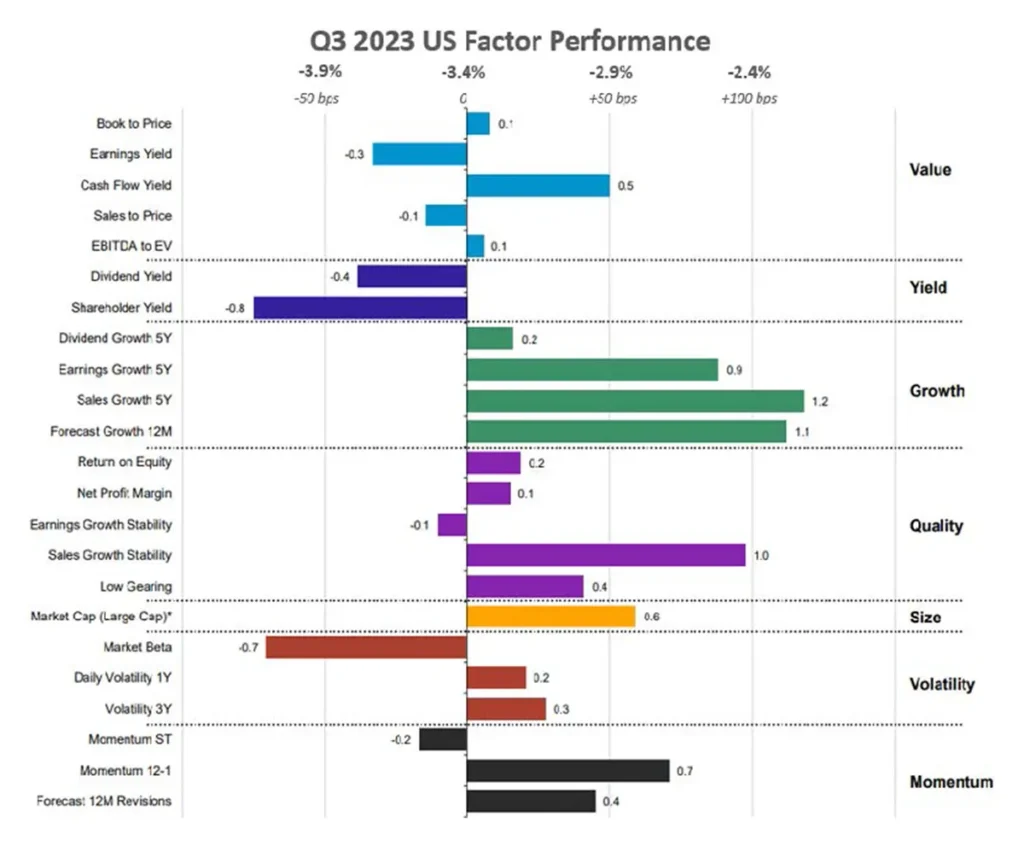
In the US, the performance of various factors has shown a strong preference for Growth equities since the beginning of 2023, and the most recent quarterly data reaffirms the consistency of this trend throughout the year. Nevertheless, there is a subtle variation in the type of Growth equity that excelled this quarter, diverging from the initial half of the year. While Growth and Volatility stocks held sway in Q1 and Q2, the third quarter observed the ascendency of Quality stocks in the absence of Volatility. This was highlighted by stability-oriented Quality subfactors like sales growth stability, which outperformed the broader US market by a notable 100bps this quarter.
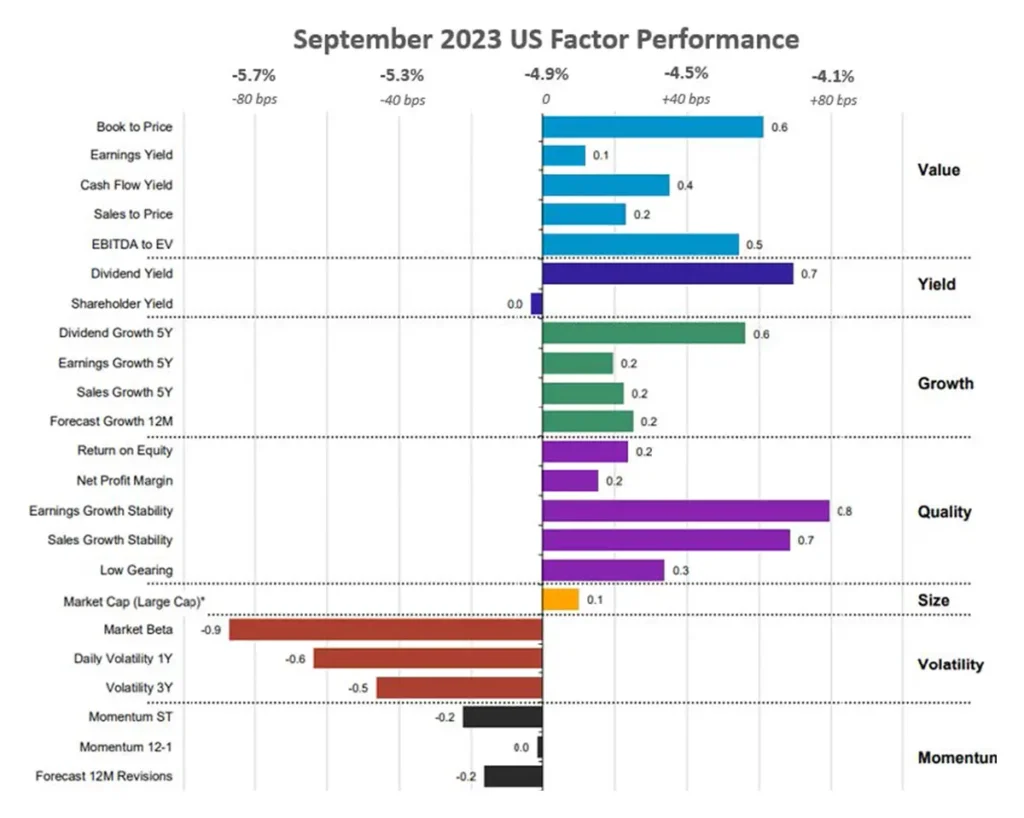
Technically, both Growth and Value did outperform the market, albeit with a modest factor premium this month ranging from -90bps to +80bps. This factor performance trend mirrors the cautious stance adopted by investors. In September, the US market underwent a correction, shedding 4.9% of its value, dragged down by Volatility subfactors like high beta, which underperformed by 90bps. Defensive subfactors like book-to-price, dividend yield, and stability-oriented Quality subfactors such as earnings growth stability and sales growth stability all outperformed by a comparable margin, falling within the range of 60-80 bps.
High beta stocks, which exhibited significant outperformance earlier this year, experienced a dismal performance in September and the remainder of Q3, weighed down by companies like NVidia (-11%) and Oracle (-12%).
Source: Investment Metrics, a Confluence company
Source: Investment Metrics, a Confluence company
European equities
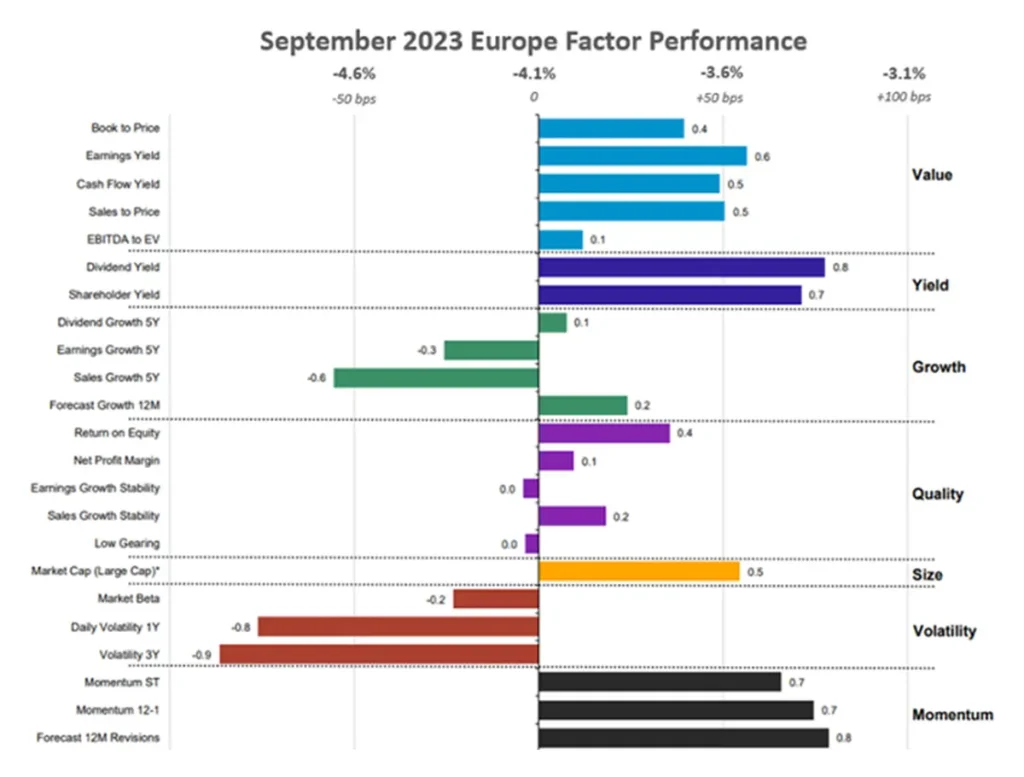
In Europe, the MSCI Europe index encountered a notable setback in Q3, with a decline of 5.24%, retracting to the levels last observed in January 2023. In this report, European equity markets underperformed all other regions in this report, except for Canada. Within this defensive market environment- Value stocks defined by earnings yield have begun to exhibit a more pronounced outperformance, surpassing the levels witnessed in the initial half of 2023, alongside Yield stocks. Volatility, which had outperformed during July and August, mirrored the same behavior as seen in the US but to a smaller extent, by underperforming the European market in September.
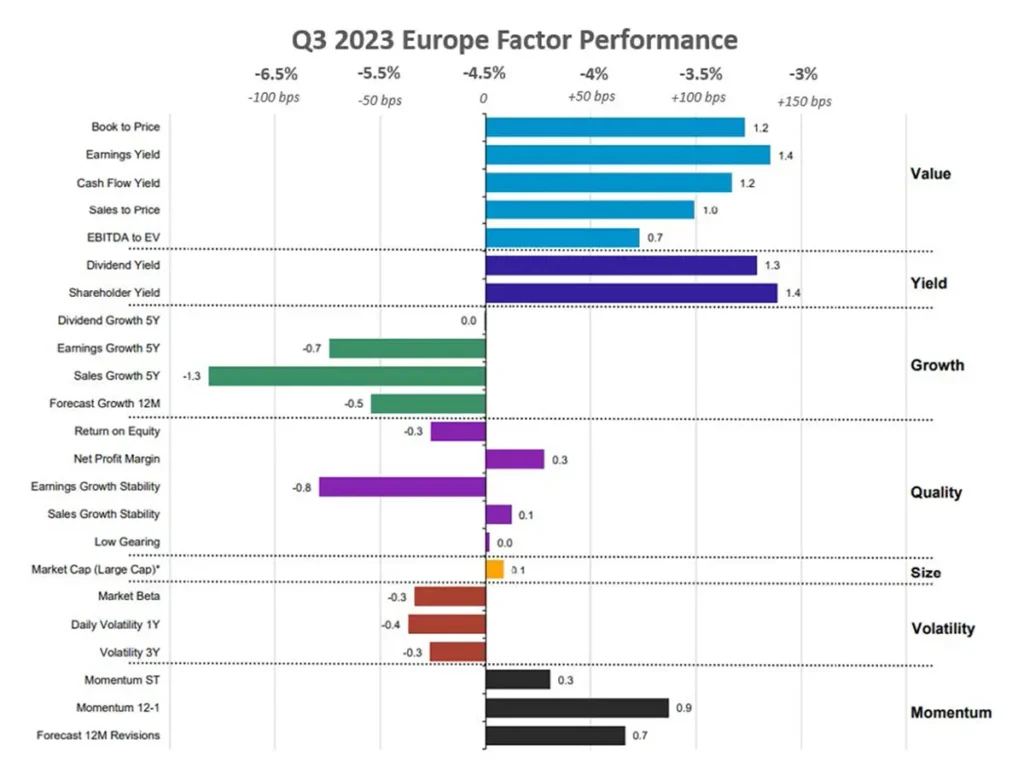
During both September and the remainder of Q3, Value stocks characterized by favorable earnings yield and cash flow yield outperformed the European market by a substantial 55bps and even more impressive 255bps, respectively.
Despite the European Union’s inflation rate being nearly double the rate observed in the US, it has fallen below the 6% mark for the first time since February 2022 and is currently displaying a downward trajectory. This is in stark contrast to the US, which has witnessed an increase in its inflation rate over the last two months.
Following the destabilization of European energy prices due to the Russian invasion of Ukraine in 2022, new suppliers have managed to stabilize German and French wholesale energy prices, reducing them to approximately €100/MWh from €190/MWh observed in January 2022. However, the trend in German consumer confidence, which initially exhibited a sharp improvement in the first half of the year, has begun to experience a slight decline instead of continuing its upward trend.
Notable outperformers include HSBC (+6%) and several energy firms such as British Petroleum PLC (+5%), and Shell PLC (+4%).
Source: Investment Metrics, a Confluence company
Source: Investment Metrics, a Confluence company
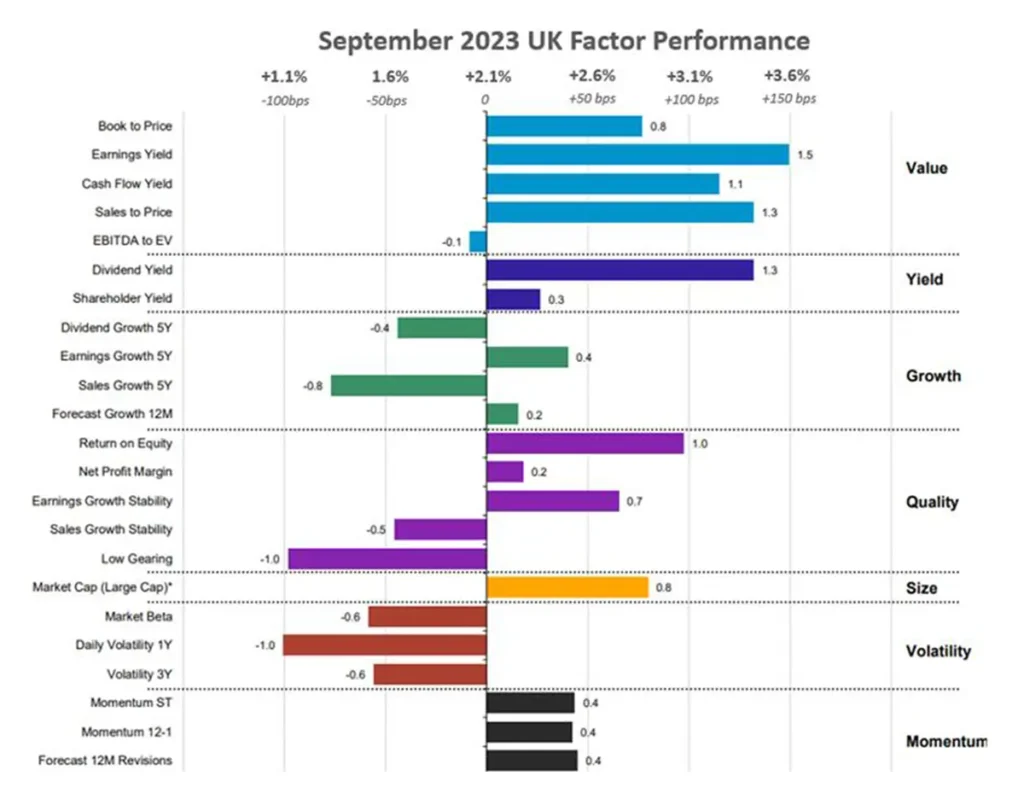
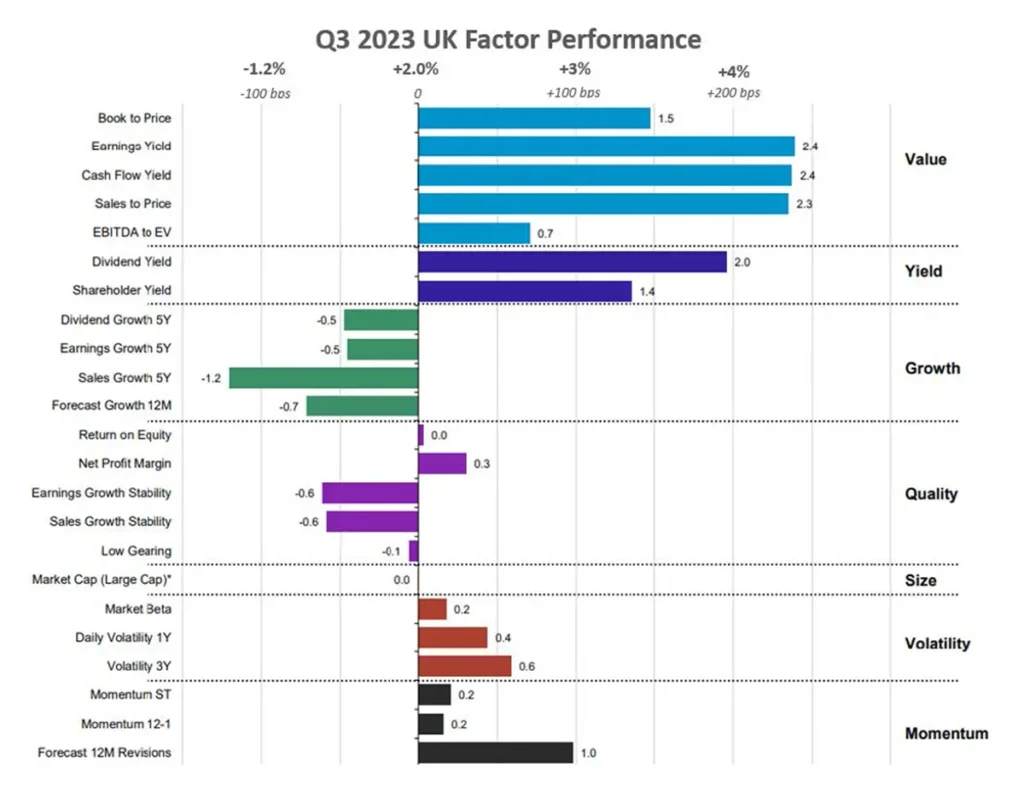
UK equities
Equity markets in the UK showed exceptional performance during September, surpassing all other regions in this report during the month and overall in Q3. Remarkably, they posted a positive return of +2.1% for September, standing alone as the sole region with a positive monthly return. While outperforming their European counterparts, the factor performance trend in both regions exhibited remarkable similarities, with the noteworthy exception of certain quality subfactors, such as return on equity, which also displayed superior performance against the market.
In terms of inflation, the UK finds itself in a similar position to that of Europe, where the annual trend is moving in the right direction but remains uncomfortably high for consumers and businesses, as August’s inflation rate sits at nearly triple the rate of the Bank of England’s long-term target at 6.7%. Just like in the US, the Bank of England also agreed to pause rate hikes in September, which was the first pause since they began hiking rates from an initial rate 0.1% in December 2021 to 5.25% today.
From a quarterly perspective, Value and Yield emerged as dominant forces in the UK market. Several Value subfactors have outperformed the market by a substantial margin, with a particular focus on companies boasting a favorable earnings yield, cash flow yield, or sales-to-price ratio, which have surged ahead by over 230 bps.
Value equities from an earnings yield perspective that helped Value outperform in the region include Glencore (+7%); Melrose Industries (+49%) and IT service provider Computacenter (+12%).
Source: Investment Metrics, a Confluence company
Source: Investment Metrics, a Confluence company
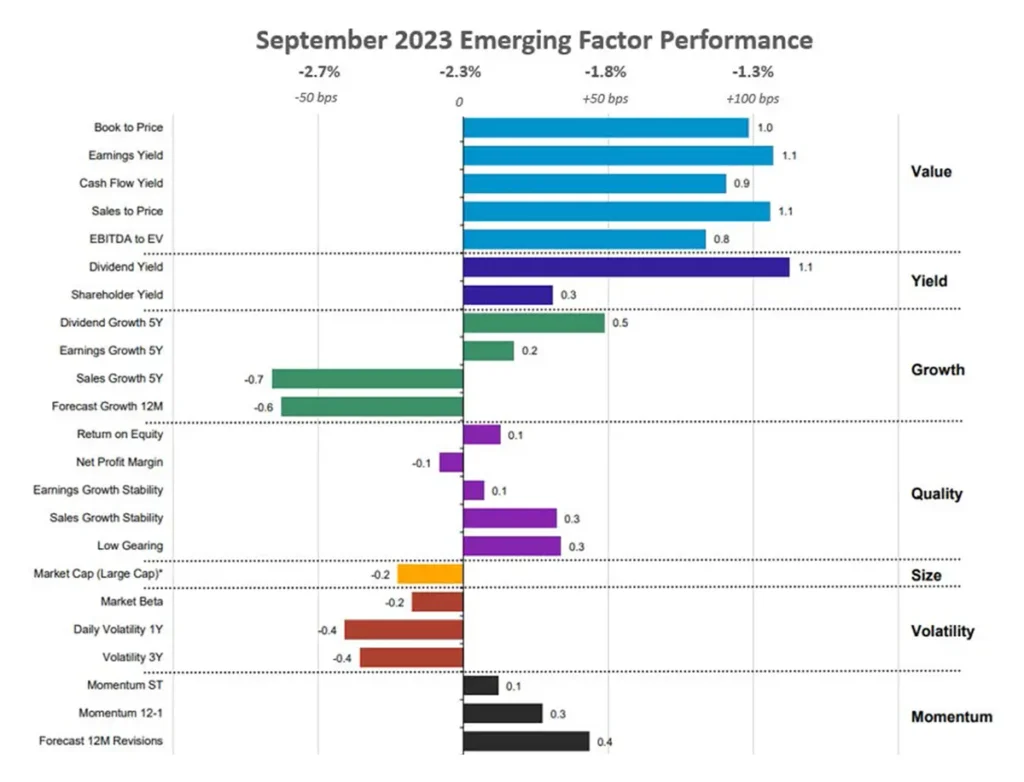
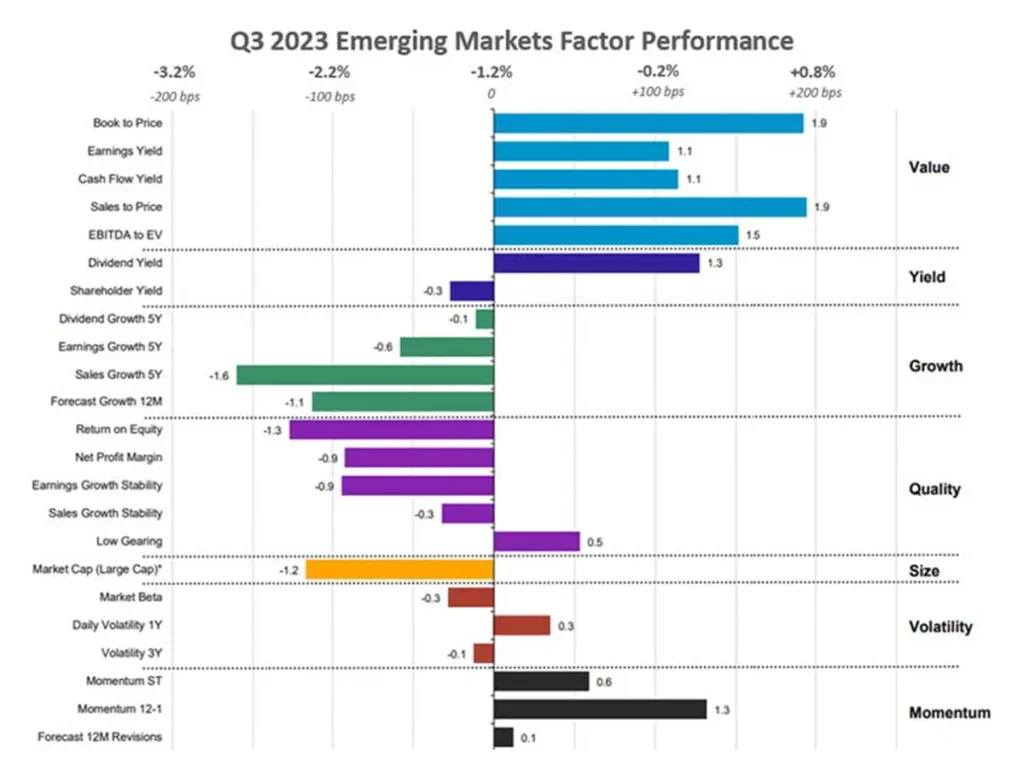
Emerging markets equities
In Emerging Markets, the prevailing trend has been the consistent outperformance of Value equity throughout September and Q3, alongside the dividend yield subfactor. Conversely, riskier subfactors like forecasted earnings growth over 12 months and high beta equities exhibited underperformance in both time periods. These trends collectively indicate a defensive environment within Emerging Markets.
Throughout the entirety of 2023, this region has exhibited remarkable resilience, displaying a strong inclination towards Value equity. There’s a pronounced focus on stocks characterized by a high cash flow yield and a low book-to-price value, both of which have significantly outperformed the broader market. While shareholder yield delivered a strong performance in Q1 and Q2, it experienced a decline in momentum during Q3. However, high-dividend stocks continued to hold their ground. Notably, stocks with high dividend growth, which was the leading subfactor in the first half of 2023, transitioned to underperforming the market within a single quarter, signaling that while Value continues to excel, the Yield factor is losing some of its previous vigor although the two are typically correlated.
From a book-to-price perspective, Indian companies like Indian Railway Finance Corp (+55%) and Power Finance Corp. Limited (+20%) led the surge observed in Emerging Markets Value equity.
Source: Investment Metrics, a Confluence company
Source: Investment Metrics, a Confluence company
Canadian equities
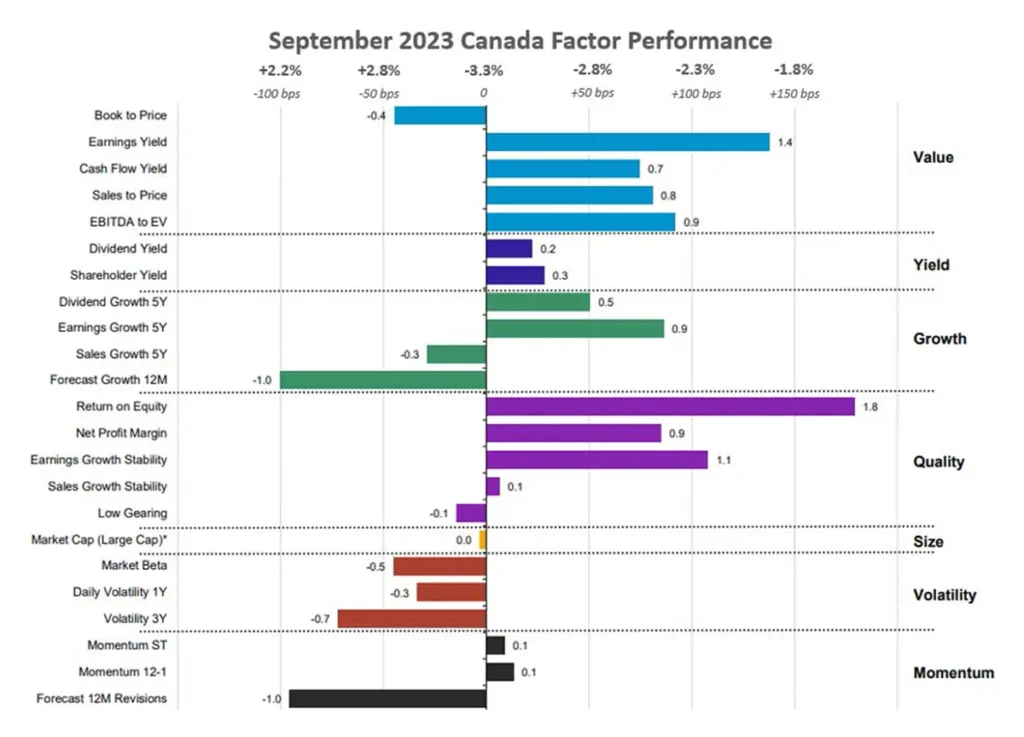
During September, Canadian equities closely mirror the pattern observed in the US. Notably, Value stocks outperformed, and alongside them, stocks with favorable Quality metrics like return on equity and earnings growth stability also showed strong performance. In contrast, Volatility exhibited a slight underperformance compared to the Canadian market. The price shift witnessed by stocks with a high earnings yield or a high return on equity ranged between 140 and 180 bps, which is a substantial shift considering a 2% monthly move or higher is quite significant from a factor perspective.
The companies that led Canadian Quality equities to outperform include energy firms like Obsidian Energy (+17%), Athabasca Oil Corporation (+16%) in part due to the surge in oil prices observed in Q3 as well.
Source: Investment Metrics, a Confluence company
Source: Investment Metrics, a Confluence company
Appendix: How to read the charts
Each factor’s performance is based on the relative performance of its top 50% of stocks by market cap, compared to the overall market. The Size factor uses the top 70% of stocks, as the only exception.
For example, for the book-to-price factor, we determine the period’s performance of the basket of stocks with the highest book-to-price values, relative to the total market. Each factor is analyzed independently, market and fundamental data are adjusted to enable sector-average (within each country) relative data to be used, and the performance measurement isolates the factor’s contribution to return.
Disclaimer
The content provided by Confluence Technologies, Inc. is for general informational purposes only and does not constitute legal, regulatory, financial, investment, or other professional advice. It should not be relied upon as a substitute for specific advice tailored to particular circumstances. Recipients should seek guidance from appropriately qualified professionals before making any decisions based on this content.
Unless otherwise stated, Confluence Technologies, Inc. (or the relevant group entity) owns the copyright and all related intellectual property rights in this material, including but not limited to database rights, trademarks, registered trademarks, service marks, and logos.
No part of this content may be adapted, modified, reproduced, republished, uploaded, posted, broadcast, or transmitted to third parties for commercial purposes without prior written consent.
Author

About Confluence® Technologies
Confluence is a global leader in enterprise data and software solutions for regulatory, analytics, and investor communications. Our best-of-breed solutions make it easy and fast to create, share, and operationalize mission-critical reporting and actionable insights essential to the investment management industry. Trusted for over 30 years by the largest asset service providers, asset managers, asset owners, and investment consultants worldwide, our global team of regulatory and analytics experts delivers forward-looking innovations and market-leading solutions, adding efficiency, speed, and accuracy to everything we do. Headquartered in Pittsburgh, PA, with 700+ employees across North America, the United Kingdom, Europe, South Africa, and Australia, Confluence services over 1,000 clients in more than 40 countries. For more information, visit www.confluence.com.